Game Industry
Library
Library
Search
Ask AI
News
Connect your AI
Browse
The Catch Up
Topics
Collections
Writers
Help
Subscribe
Game Industry
Library
Library
Search
Ask AI
Saved
Library
223 reports matching your filters
All Types
Reports
Articles
Presentations
Whitepapers
Financial
Legal
Other
Search
Japan
Market Analysis
Investment
Mobile
Global
Game Publishing
Advertising
Monetization
Game Development
Console
Asia
Marketing
RPG
Player Behavior
Market Forecast
Mergers & Acquisitions
USA
South Korea
Clear
Filters
1
Japan
Recently added
Newest first
Oldest first
Title A–Z
Title Z–A
Report
41 pages
Presentation Material: Q1 FY2026
The provided report content for Q1 FY2026 covers the period of October through December 2025.
The document outlines performance metrics specifically for the company's Internet Advertisement Business.
Management explicitly notes that actual financial results may differ materially from the provided earnings forecasts due to inherent risks and uncertainties.
Market Analysis
Game Publishing
Monetization
+2
CyberAgent
Report
1 pages
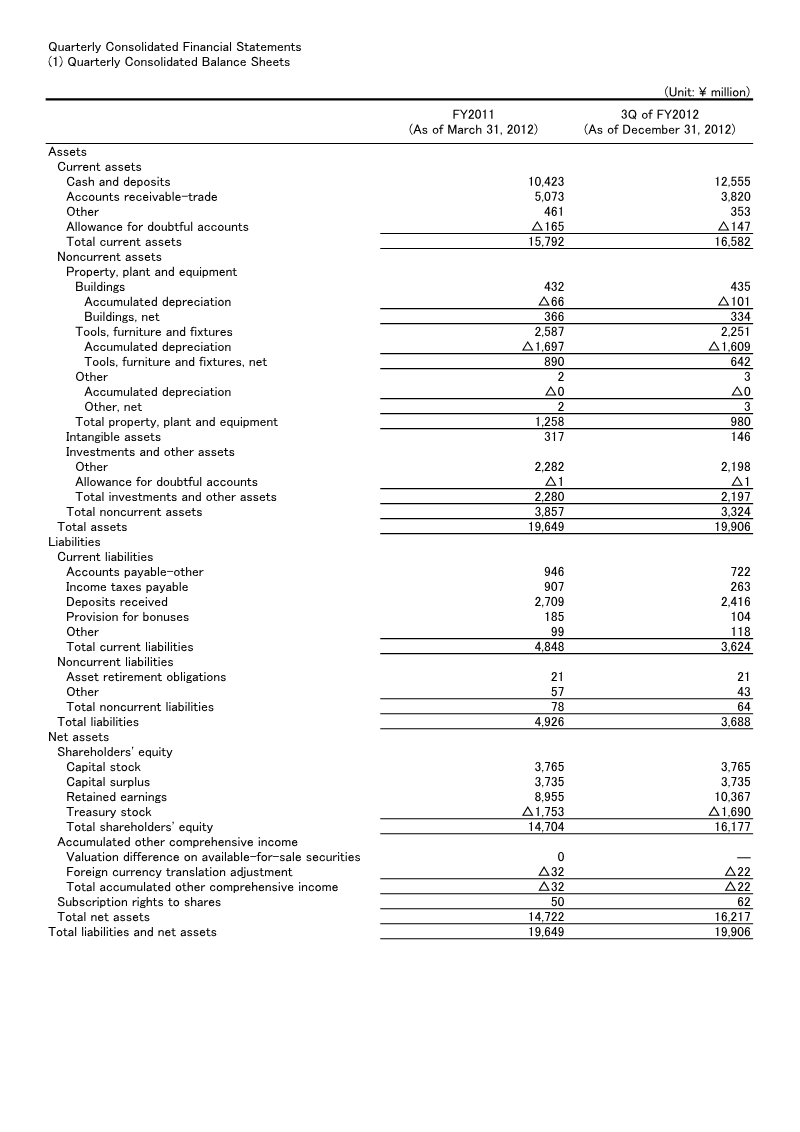
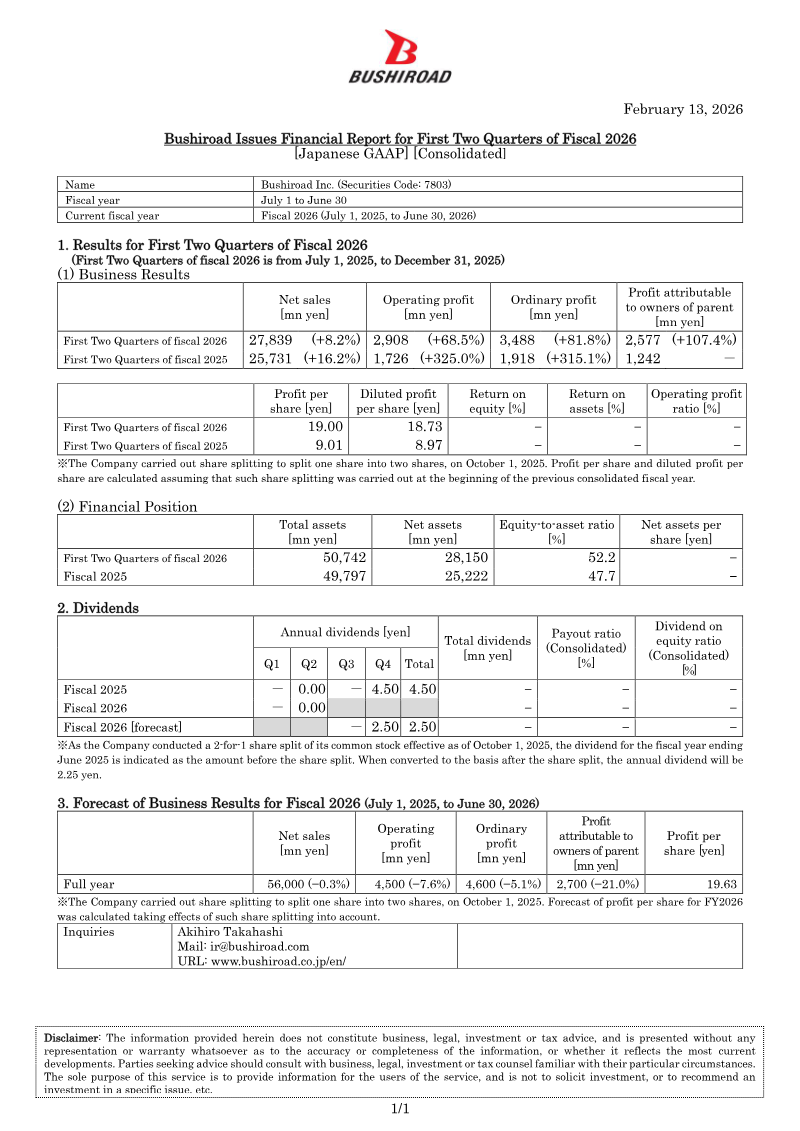
Financial Report for First Two Quarters: Fiscal 2026
Bushiroad Inc. reported strong growth for the first two quarters of fiscal 2026 (July 1–December 31, 2025), with net sales rising 8.2% to ¥27,839 million and operating profit surging 68.5% to ¥2,908 million.
Profit attributable to owners of the parent company more than doubled, increasing 107.4% to ¥2,577 million compared to the same period in fiscal 2025.
Earnings per diluted share reached ¥19.00, bolstered by improved profitability and a 2-for-1 share split implemented on October 1, 2025.
Market Analysis
Investment
Japan
+1
Bushiroad
Report
1 pages
Financial Report for First Quarter of Fiscal 2026: Japan
Bushiroad Inc. achieved a significant financial turnaround in Q1 fiscal 2026, reporting an operating profit of ¥1,668 million compared to an operating loss of ¥510 million in the same period last year.
Net sales for the quarter ending September 30, 2025, grew 12.2% year-over-year to ¥13,766 million, fueled by strong performance in the company's card game and event-ticket divisions.
Profit attributable to owners of the parent company reached ¥1,663 million, marking a substantial recovery from the ¥59 million loss recorded in Q1 fiscal 2025.
Market Analysis
Investment
Japan
Bushiroad
Report
4 pages
Quarterly Consolidated Balance Sheets: 3Q FY2012
Operating income more than doubled year-over-year, rising from ¥1,385 million to ¥2,342 million as of December 31, 2012.
Operating cash flow saw a dramatic improvement, surging from ¥246 million to ¥1,940 million compared to the same period in the previous fiscal year.
Net sales increased by 4% to ¥9,922 million, while a 10% reduction in the cost of sales drove gross profit up to ¥7,083 million.
Market Analysis
Japan
mixi
Report
6 pages
Consolidated Balance Sheets: FY2012-FY2013
Net income more than doubled from ¥749 million in FY2012 to ¥1,654 million in FY2013, bolstered by a ¥406 million extraordinary gain from the sale of subsidiary shares and reduced operating expenses.
Operating income increased from ¥2,194 million to ¥2,574 million despite a decline in net sales from ¥13,334 million to ¥12,632 million, indicating improved operational efficiency and lower cost of sales.
Shareholders' equity grew from ¥14,722 million to ¥16,291 million, supported by a ¥1,453 million increase in retained earnings.
Market Analysis
Investment
Japan
mixi
Report
4 pages
Quarterly Consolidated Balance Sheets: 1Q of FY2013
The company shifted from an operating profit of ¥889 million in 1Q 2012 to an operating loss of ¥84 million in 1Q 2013.
Net sales dropped significantly from ¥3,539 million to ¥2,144 million, while gross profit fell from ¥2,554 million to ¥1,448 million year-over-year.
Net income reversed from a profit of ¥562 million in 1Q 2012 to a net loss of ¥253 million in 1Q 2013, exacerbated by a ¥34 million impairment loss.
Market Analysis
Investment
Japan
mixi
Report
4 pages
Quarterly Consolidated Balance Sheets: 2Q FY2013
Net sales plummeted 41% year-over-year, falling from ¥6,817 million in 2Q FY2012 to ¥3,979 million in 2Q FY2013.
Operating income shifted from a ¥1,612 million profit in 2Q FY2012 to a ¥398 million loss in 2Q FY2013, driven by high selling, general, and administrative expenses relative to sales.
The company reported a net loss attributable to owners of the parent of ¥1,293 million for 2Q FY2013, a sharp reversal from the ¥1,184 million profit recorded in the same period of the previous year.
Market Analysis
Investment
Japan
mixi
Report
4 pages
Quarterly Consolidated Balance Sheets: 3Q of FY2013
Net sales plummeted 36% year-over-year, falling from ¥9,922 million in 3Q FY2012 to ¥6,357 million in 3Q FY2013.
Operating income swung from a ¥2,342 million profit to a ¥509 million loss, while net income dropped from a ¥1,621 million profit to a ¥1,573 million loss.
The company’s total assets contracted from ¥20,083 million to ¥17,623 million, accompanied by a decline in shareholders’ equity from ¥16,220 million to ¥14,318 million.
Investment
Japan
Market Analysis
mixi
Report
2 pages
Mixi Report: FY2013 Business Results
Monster Strike drove a major recovery in Q4 FY2014, generating ¥5,798 million in sales—a 143.8% increase—and contributing ¥990 million in operating income.
Mixi experienced an overall net loss of ¥227 million in FY2014, with net sales declining 3% to ¥12,155 million and operating income dropping to ¥480 million due to the decline of the legacy social networking segment.
The company is aggressively expanding Monster Strike internationally through a partnership with Tencent to localize the game for markets in China, Hong Kong, Macau, and Taiwan.
Market Analysis
Monetization
Investment
+2
mixi
Report
2 pages
FY2015 Annual Business Report: MIXI
Monster Strike served as the primary revenue driver, generating ¥112.9 billion in net sales and ¥52.7 billion in operating income, representing a growth of over 30% compared to FY2014.
The company returned to profitability with a net profit of ¥32.9 billion, leading to an increased dividend payout of ¥59 per share.
Monster Strike achieved over 30 million cumulative unique device downloads and expanded its international footprint into China, South Korea, North America, and Hong Kong/Macau.
Market Analysis
Monetization
Mobile
+1
mixi
Report
2 pages
FY2016 Annual Report (Part 1: Business Report)
mixi, Inc. experienced significant FY2016 growth, with net sales rising 84.9% to ¥208.8 billion and operating income increasing 80.4% to ¥95.0 billion.
The Entertainment Business segment, anchored by the continued success of Monster Strike and its 35 million cumulative worldwide users, served as the primary driver of the company's financial performance.
The Media Platform Business contributed ¥112.9 billion in sales and ¥52.7 billion in operating income, maintaining a stable base for long-term user engagement.
Market Analysis
Japan
Mobile
mixi
Report
104 pages
2024 Integrated Report: Value Creation Story
The 2024 Integrated Report outlines a corporate mission focused on entertaining and enriching lives to make the world a better place.
The report identifies a specific event held on April 8, 2023, which recorded an attendance figure of 4,000 participants.
The document references the Kawasaki Brave Thunders, a professional basketball team, as part of its value creation narrative.
Mobile
Live Ops
Sports Games
+1
DeNA Co.
Report
95 pages
2023 Integrated Report: Value Creation Story
The organization has defined its core strategic vision as becoming the world's premier provider of internet and AI technology.
The company's stated mission is to entertain and enrich lives while serving to improve the world.
The business model relies on leveraging individual employee strengths to drive the success of its unique business units.
AI
Japan
Mobile
+1
DeNA Co.
Report
104 pages
2025 Integrated Report: Value Creation Story
The organization aims to establish itself as a premier global provider of internet and technology services.
The company's core mission is to entertain and enrich lives while contributing to broader societal improvements.
Business success is driven by the strategic utilization of individual employee strengths.
Market Analysis
Mobile
Japan
+1
DeNA Co.
Report
1 pages
Financial Highlights: 1st Quarter of Fiscal Year Ending March 2011
Tecmo Koei Holdings achieved a significant financial turnaround in Q1 FY2011, shifting from a ¥102 million net loss in the prior year to a ¥2,604 million profit.
Operating income improved by ¥1,160 million year-over-year, moving from a ¥519 million loss to a ¥641 million profit, driven primarily by the game software and online & mobile segments.
Total net sales for the quarter declined 23.5% year-over-year to ¥34,502 million, largely due to a 32.3% drop in game software sales and a 29.3% decrease in online & mobile revenue.
Market Analysis
Investment
Japan
Koei Tecmo
Report
1 pages
Financial Highlights: 1st Half of Fiscal Year Ending March 2011
Tecmo Koei Holdings achieved a significant turnaround in the first half of fiscal year 2010, swinging from a ¥641 million operating loss in the previous year to a ¥641 million operating profit.
Net income reached ¥2.6 billion for the first half of the fiscal year, a substantial recovery from the ¥415 million loss recorded during the same period in 2009.
Despite a 27.5% year-on-year decline in first-half net sales to ¥34.5 billion, the company projects a full-year revenue of ¥36.5 billion, representing a 5.8% increase over the previous year.
Market Analysis
Investment
Japan
Koei Tecmo
Report
1 pages
Financial Highlights: 3rd Quarter of Fiscal Year Ending March 2011
The company achieved a significant financial turnaround in Q3 FY2010, swinging from an operating loss of ¥1,842 million in the prior year to an operating profit of ¥641 million.
Net sales for the quarter reached ¥34,502 million, representing an 11.1% increase over the same period in FY2009, though this figure fell slightly short of the ¥36,500 million forecast.
Net income rebounded to ¥2,604 million, marking a 34.4% gain compared to the previous year's third quarter.
Market Analysis
Investment
Japan
+1
Koei Tecmo
Report
1 pages
Financial Highlights: Fiscal Year Ending March 2011
Tecmo Koei Holdings achieved a 415.6% surge in operating income to ¥3,305 million for the fiscal year ending March 2011, despite a 7% decline in net sales to ¥32,081 million.
Profitability improved significantly through cost efficiencies and high-margin performance, resulting in a 49.4% increase in income before taxes and minority interests to ¥4,515 million.
The core game software segment saw a 6.6% decline in sales but experienced a 101.2% jump in operating income, indicating a shift toward more profitable operations.
Market Analysis
Investment
Japan
+1
Koei Tecmo
Report
1 pages
Financial Highlights: 1st Quarter of the Fiscal Year Ending March 2012
Tecmo Koei Holdings reported a 26% year-over-year increase in net sales to ¥34.5 billion and a 31.3% rise in net income to ¥2.6 billion for the first quarter of the fiscal year ending March 2012.
The Game Software segment was the primary growth driver, generating ¥23.1 billion in sales—a 54.8% increase compared to the same period in the previous year.
The Online & Mobile segment experienced significant expansion, with sales rising 79.5% to ¥4.6 billion and contributing ¥1.20 billion to operating income.
Market Analysis
Investment
Japan
+1
Koei Tecmo
Report
1 pages
Financial Highlights: 1st Half of Fiscal Year Ending March 2012
Tecmo Koei Holdings returned to profitability in the first half of fiscal year 2012, reporting ¥412 million in net income compared to a ¥571 million loss in the same period the previous year.
Operating income reached ¥641 million, a significant turnaround from the ¥1,656 million loss recorded in the first half of the prior fiscal year.
Net sales grew 23.2% year-over-year to ¥11,069 million, fueled by strong performance in the Game Software segment (+40.7%) and the Online & Mobile segment (+57.2%).
Market Analysis
Investment
Japan
Koei Tecmo
Previous
1
2
3
4
…
12
Next