Game Industry
Library
Library
Search
Ask AI
News
Connect your AI
Browse
The Catch Up
Topics
Collections
Writers
Help
Subscribe
Game Industry
Library
Library
Search
Ask AI
Saved
Library
110 reports matching your filters
All Types
Reports
Articles
Presentations
Whitepapers
Financial
Legal
Other
Search
Advertising
Global
Marketing
Mobile
Market Analysis
User Acquisition
Creative Ads
Monetization
AI
In-Game Advertising
Japan
PC
Game Publishing
Investment
Streaming
USA
Market Forecast
Casual
Clear
Filters
1
Advertising
Recently added
Newest first
Oldest first
Title A–Z
Title Z–A
Report
54 pages
FY2024 Presentation Material: October 2023 to September 2024
The company's fiscal year 2024 results cover the period from October 2023 through September 2024.
The fiscal year 2025 forecast covers the period from October 2024 through September 2025.
The report outlines performance and projections for the company's internet advertisement business.
Market Analysis
Advertising
Investment
+1
CyberAgent
Report
43 pages
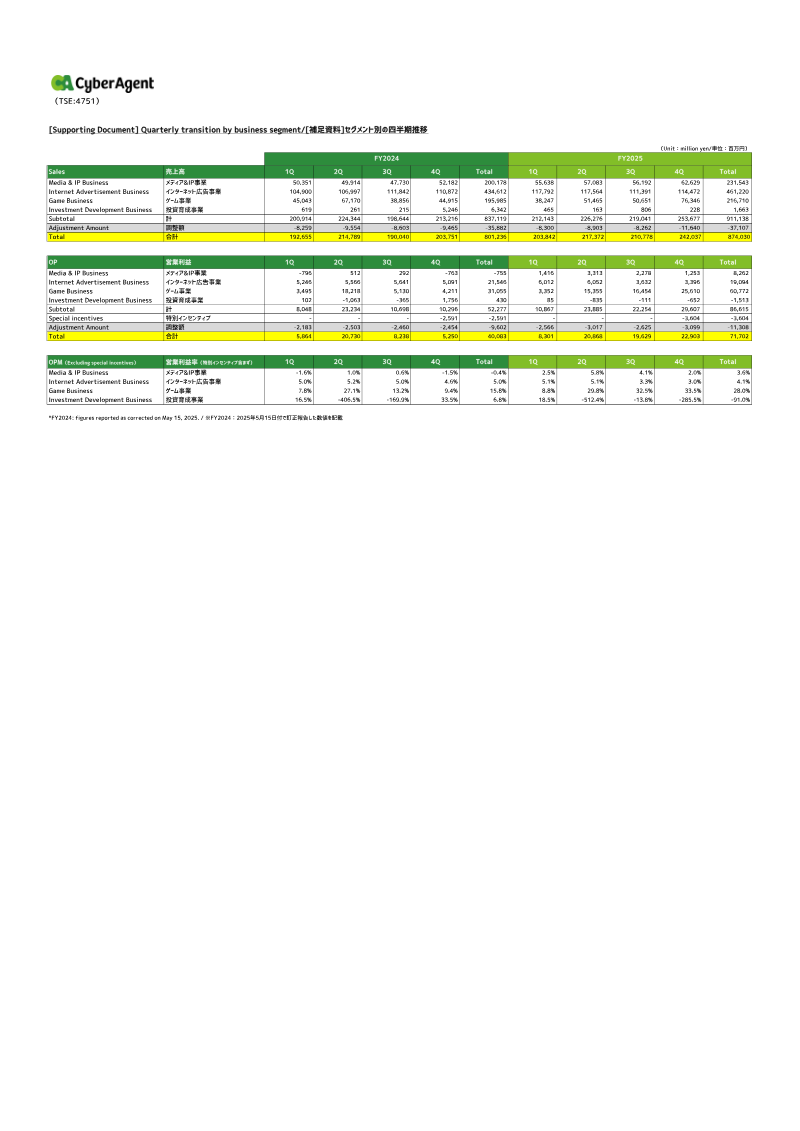
2Q FY2025 Financial Presentation Material
The company identified inappropriate accounting practices occurring at a consolidated subsidiary.
Financial statements for past fiscal years have been amended to address these accounting irregularities.
Correction reports for past annual securities reports were formally submitted on May 15, 2025.
Market Analysis
Advertising
Investment
+2
CyberAgent
Report
37 pages
1Q FY2025 Presentation Material
CyberAgent reported a 5.6% YoY revenue increase to ¥203.8 billion and a 32.1% rise in operating profit to ¥8.3 billion for 1Q FY2025.
The Game segment underperformed, recording a 15.1% YoY revenue decline to ¥38.2 billion and a 4.1% drop in operating profit due to a slower release cadence.
Growth was primarily driven by the Media & IP segment, which saw a 10.5% sales increase to ¥55.6 billion, and the Internet Advertising segment, which grew 11.8% to ¥117.7 billion.
Market Analysis
Advertising
Investment
+1
CyberAgent
Report
1 pages
Quarterly Transition by Business Segment: Japan
The Game Business is the company's most profitable segment, maintaining a FY2025 average operating profit margin of 28% and peaking at 33.5% in Q3 FY2024.
Internet Advertisement is the largest revenue generator, growing from ¥434,612 million in FY2024 to ¥461,220 million in FY2025, though it operates on thin margins of approximately 5%.
Game Business revenue is highly volatile, experiencing a sharp decline from a peak of ¥67,170 million in Q2 FY2024 to ¥38,856 million in Q3 FY2024.
Market Analysis
Advertising
Mobile
+1
CyberAgent
Report
2 pages
Summary of Q&A: FY2016 4Q GREE Results Briefing
GREE plans to launch eight native games in FY2017, targeting a release cadence of two titles per quarter.
Operating margins for Q1 FY2017 are expected to remain below 20% due to upfront investments in game operations and North American expansion, with a return to higher margins contingent on new title performance.
The company defines 'hit titles' as games that achieve top-ten rankings within the App Store games category.
Market Analysis
Investment
Advertising
+1
GREE
Report
3 pages
Summary of Main Questions and Answers at the FY2018 First Quarter GREE Results Briefing
GREE’s Q1 FY2018 revenue growth was driven by increased commission fees from partner titles that leverage strong intellectual property.
Key titles driving robust coin consumption in Q1 included 'Another Eden: The Cat Who Goes Beyond Time', 'SINoALICE', 'Senki Zesshou SYMPHOGEAR XD Unlimited', and 'Is It Wrong to Try to Pick Up Girls in a Dungeon: Memoria Freeze'.
The company expects a temporary decline in native game sales as it transitions to larger support teams, enhanced content, and more aggressive promotional activities to drive future growth.
Market Analysis
Monetization
Marketing
+3
GREE
Report
1 pages
Summary of Main Questions and Answers at the FY2018 Fourth Quarter GREE Results Briefing
GREE’s FY2019 strategy focuses on international expansion of existing game titles and the launch of new development projects to capture emerging markets.
The company recorded a goodwill impairment in its advertising and media segment due to the underperformance of the 3 Minutes unit.
Despite the impairment, GREE maintains that its advertising and media business remains a significant revenue contributor and will continue to receive investment for further expansion.
Market Analysis
Game Publishing
Mobile
+2
GREE
Report
2 pages
Summary of main supplementary explanations questions and answers at the FY2020 First Quarter GREE results briefing held on October 30, 2019
GREE projects an operating income of approximately ¥0.5 billion for the second quarter of FY2020.
First-quarter sales declined due to the conclusion of major title anniversary events and the strategic transfer of titles to improve overall profitability.
Management expects browser game revenue to continue its decline while increasing advertising spend on high-potential mobile titles.
Market Analysis
Monetization
Marketing
+3
GREE
Report
10 pages
Winning on Google Discover: A Data-Driven Guide for Gaming Media
Google Discover now accounts for roughly 50% of Google traffic for gaming sites within the Raptive network, following a February 5, 2026 core update that shifted traffic away from traditional search.
Sites that prioritize high U.S. traffic concentration, deep session depth, and structured editorial content like guides and databases experience superior Discover performance and revenue stability.
Following the February 2026 update, 20% more gaming sites began receiving Discover feed impressions, with smaller publishers seeing notable traffic growth.
Market Analysis
Marketing
Advertising
+2
Raptive
Mar 2026
Report
88 pages
Gaming and Esports in Vietnam: A New Arena for Brands
Vietnam has the world's highest adult gamer rate at 85%, with a demographic where 70% of the population is under 25 and one-third of citizens are engaged in esports.
Mobile gaming dominates the market, supported by high smartphone penetration and 4G coverage, with gamers typically spending 1–3 hours per session.
Influencer marketing is highly effective, as 51% of gamers trust key opinion leader (KOL) recommendations and 42% report purchasing products endorsed by them.
Market Analysis
Esports
Marketing
+3
Decision Lab
Feb 2026
Report
32 pages
Festive Season 2025: App Marketing Trends and Strategies for India
India's festive season (August–December) accounts for over 30% of annual digital ad spend, driving a 36% increase in installs and a 69% surge in re-engagements during the peak window.
Mobile gaming remains a primary growth driver, recording 3.2 billion downloads and $151 million in-app purchase revenue in 2024.
Ad spend efficiency improved during the festive period, with a 53% increase in mobile ad investment accompanied by a 12% reduction in cost-per-install (CPI).
Market Analysis
User Acquisition
Marketing
+3
InvestGame
Jan 2026
Report
36 pages
Winning with Creative: Building, Testing, and Scaling High-Performance Ads
High-performance ads achieve a 350% lift in ad spend when winning templates are paired with top-performing assets.
TikTok-first video structures—comprising a hook, body, and close—can increase purchase intent by up to 77% when using 30-second, sound-on formats.
AI-driven content creation tools, such as TikTok Symphony, provide a 57% efficiency gain in the production process.
Marketing
Advertising
Creative Ads
+3
Moloco
Jan 2026
Report
31 pages
State of Digital Advertising India 2026
India’s digital advertising market surpassed $4 billion in 2025 and is projected to exceed $5 billion in 2026.
Shopping remains the dominant advertising category, representing 28% of total spend with an 18% year-on-year increase.
Software recorded the highest growth rate among all sectors, surging 84% year-on-year.
Market Analysis
Advertising
Marketing
+1
Sensor Tower
Jan 2026
Whitepaper
90 pages
2026 Global Mobile Apps Marketing Trends
The mobile marketing landscape has shifted from media-centric targeting to creative-driven acquisition, evidenced by a 73.3% surge in creative output per advertiser alongside a 16.7% decline in the total number of active advertisers.
Playable ads are currently the top-performing format, consistently delivering the highest conversion metrics, scroll-stop rates, and attention duration.
The AI application sector underwent a significant contraction in 2025, with the number of active advertisers dropping by 48%.
Market Analysis
Mobile
Marketing
+4
SocialPeta
Jan 2026
Report
26 pages
2026 Predictions: Trends in Gen AI, Gaming & Digital Ad Spend
Generative AI apps will become a top-five category by 2026, generating over $10 billion in IAP revenue, 7.2 billion downloads, and 43 billion hours of usage, representing an 82% year-over-year growth.
By the end of 2026, generative AI traffic will surpass paid sources on more than 50% of the top 1,000 U.S. websites, up from 37% in late 2025.
Short-drama vertical video is projected to overtake traditional OTT streaming in download volume, capturing roughly 80% of total downloads with rapid adoption in India, Indonesia, and Brazil.
Market Forecast
AI
Advertising
+1
Sensor Tower
Jan 2026
Report
28 pages
H1 2025 AIGC Mobile App Marketing Analysis
The number of active AI-advertisers in the mobile market contracted by 35–45% in H1 2025, while the remaining players increased their creative output by 84% to an average of 416 monthly creatives per advertiser.
Meitu’s revenue grew 12.3% to RMB 1.8 billion in H1 2025, driven primarily by a 45.2% surge in AI-powered imaging and design subscriptions, which reached RMB 1.35 billion.
Video advertising currently dominates the AI mobile landscape, accounting for 84% of all ads, with over half of inventory utilizing 15–30 second formats.
Market Analysis
AI
Marketing
+4
SocialPeta
Dec 2025
Report
30 pages
2025 Report on Marketing Trends of Productivity Apps
The productivity app sector saw a 6% year-over-year decline in active advertisers to 8.9k per month, though new entrants surged to over 30% of the market share following Q2 2025.
Meta, Google, and TikTok remain the primary channels for cross-platform campaigns, with Google leading in conversion rates and TikTok offering cost-efficient Gen Z engagement at a $3.2 CPM.
Video and playable ads consistently outperform static creatives, with TikTok favoring 15–60 second native videos and Meta utilizing a combination of carousel and video formats.
Market Analysis
Marketing
Advertising
+2
SocialPeta
Dec 2025
Report
56 pages
Digital Marketing Index Report: Q4 2025
India was the only major global market to record positive overall digital marketing growth in Q4 2025, while other leading economies experienced stagnation or decline.
Generative AI referrals surged by 133% year-over-year in the US, UK, and France, signaling their emergence as significant discovery engines despite currently accounting for less than 1% of total traffic.
US retail-media impressions grew 13% quarter-over-quarter to 123 billion, with Amazon capturing the entire volume and delivering six times the impressions of Walmart.
Marketing
Advertising
Global
+2
Sensor Tower
Oct 2025
Report
46 pages
Digital Market Index: Q2 2025
In Q2 2025, non-gaming applications surpassed mobile games for the first time, accounting for 52% of the record $40 billion in total in-app purchase revenue.
Global mobile gaming downloads contracted by 6.8% year-over-year, while Strategy titles replaced RPGs as the highest-grossing gaming category with a 23% increase.
ChatGPT became the fastest application to reach one billion downloads and secured a top-five position in global revenue, signaling a major shift toward AI-driven utility.
Market Analysis
Global
Mobile
+1
Sensor Tower
Aug 2025
Report
37 pages
Southeast Asia: Mobile Game Market Insights 2025
Southeast Asia is the world’s second-largest mobile gaming market by volume, recording 1.93 billion installs in early 2025, while ranking seventh globally in revenue at $625 million.
Indonesia is the region's primary volume driver with 870 million installs, whereas Thailand leads in monetization, generating $162 million in consumer spending.
Publishers based in Singapore and Vietnam have become a dominant global force, contributing over 5.8 billion installs to the international market through hypercasual and competitive titles.
Market Analysis
Mobile
Southeast Asia
+3
Sensor Tower
Jun 2025
Previous
1
2
3
4
5
6
Next