FinancialKonami Group Corporation
Consolidated Financial Results: Six Months Ended September 30, 2022
19 pages~31 min full read
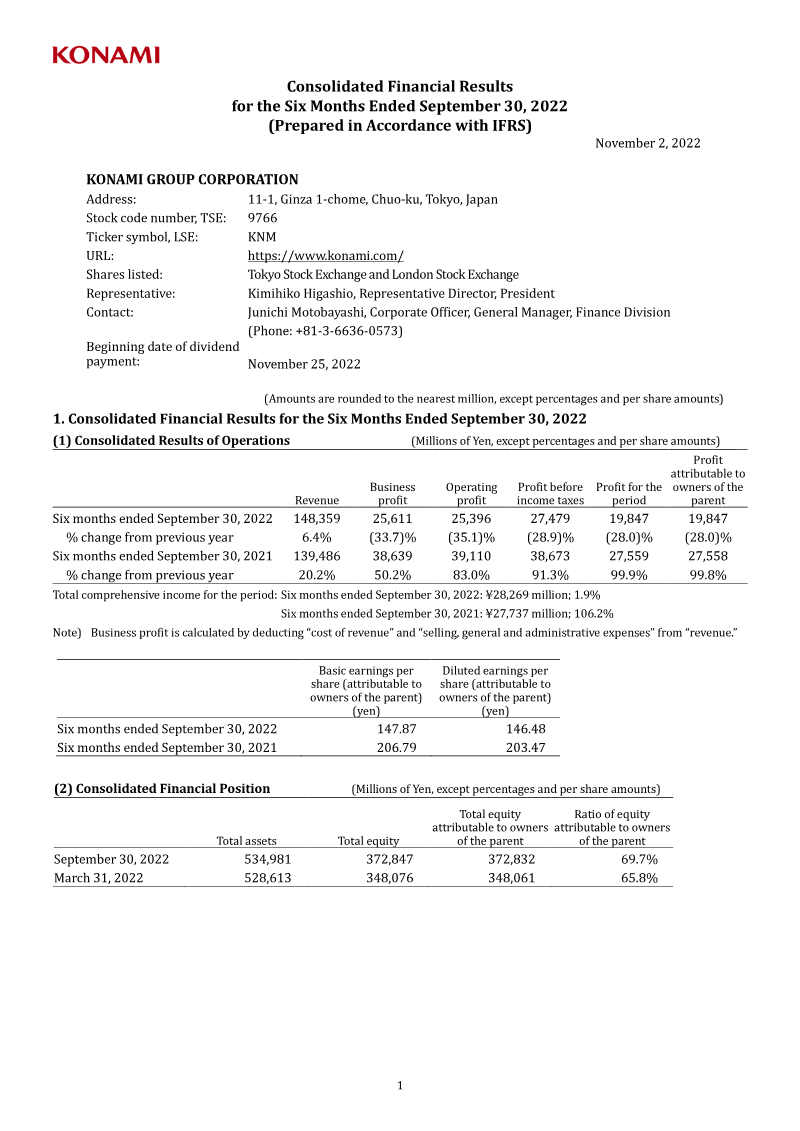
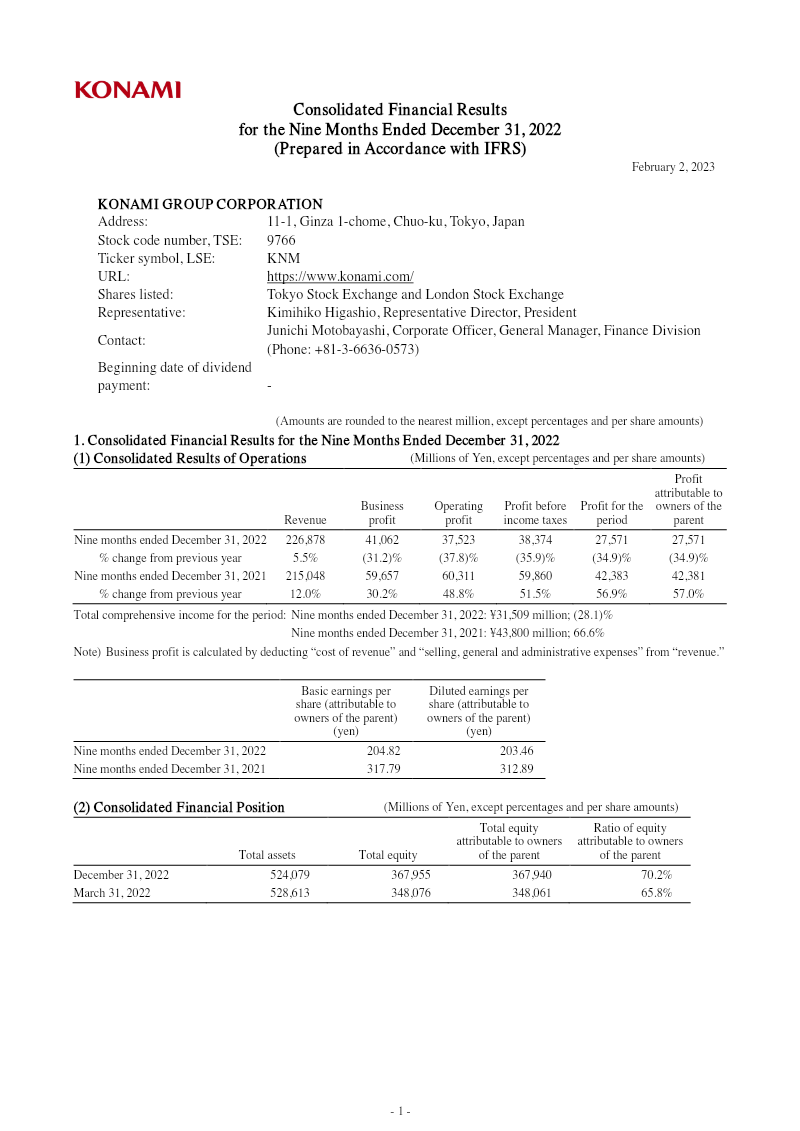
Konami Group achieved record-high revenue of ¥148,359 million for the six-month period ending September 30, 2022, representing a 6.4% year-on-year increase. This growth was primarily fueled by the successful launch of new titles, robust performance within the Gaming & Systems and Sports segments, and a notable surge in revenue from the United States market. Favorable exchange rates further bolstered these top-line results, allowing the company to maintain its original full-year fiscal forecast of ¥320,000 million in revenue and ¥76,500 million in operating profit.
Despite these revenue gains, profitability faced significant downward pressure during the first half of the fiscal year. Consolidated business profit fell by 33.7% to ¥25,611 million, while net profit declined to ¥19,847 million. This contraction in margins was largely attributed to rising operational costs, specifically increased expenditures related to product development, marketing promotions, and higher global energy prices. The Digital Entertainment and Amusement segments were particularly impacted, experiencing profit declines compared to the same period in the previous year.
To navigate these financial headwinds and secure long-term growth, the organization is focusing on a strategic pivot toward cross-platform development and the expansion of global eSports initiatives. Furthermore, the company is actively revitalizing legacy intellectual properties, including the Silent Hill and Suikoden franchises, to capture renewed consumer interest. By balancing these creative investments with a disciplined approach to its existing business segments, the company aims to stabilize its bottom line while leveraging its diverse portfolio across the global gaming and sports entertainment landscape.
Konami Group Corporation
Konami Group Corporation
Konami Group Corporation
Konami Group Corporation
Konami Group Corporation
Konami Group Corporation

Capcom · 2026

Capcom Co. · 2026

Capcom · 2026

Sony Group Corporation · 2026
Marvelous · 2026

Square Enix · 2026
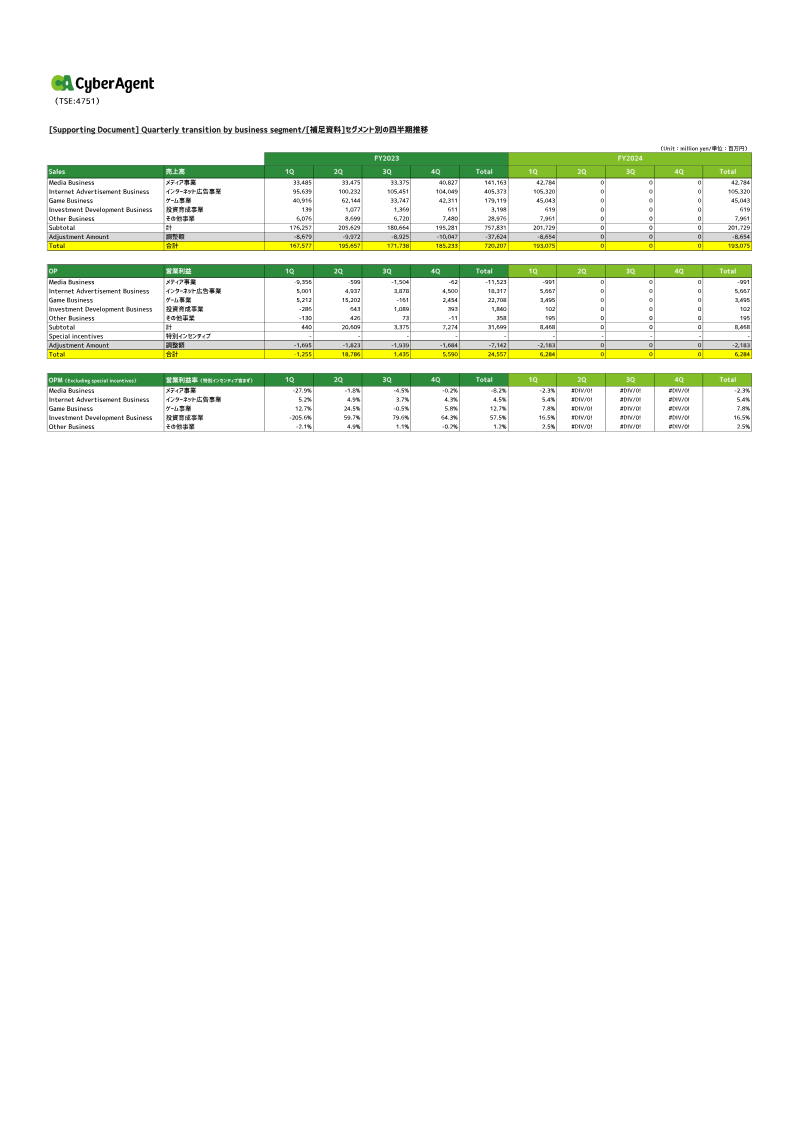
CyberAgent · 2026
Nippon Ichi Software · 2026
Square Enix · 2026
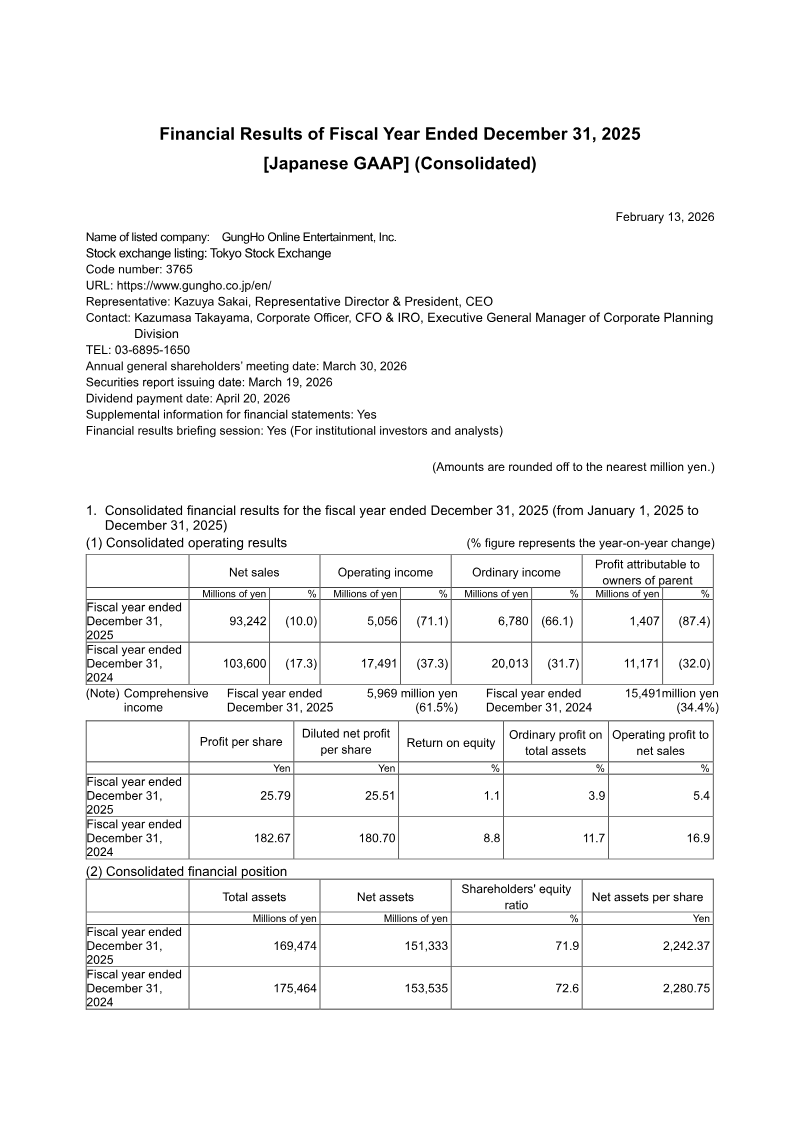
GungHo Online Entertainment · 2026
GungHo Online Entertainment · 2026
Nihon Falcom Corporation · 2026