FinancialKonami Group Corporation
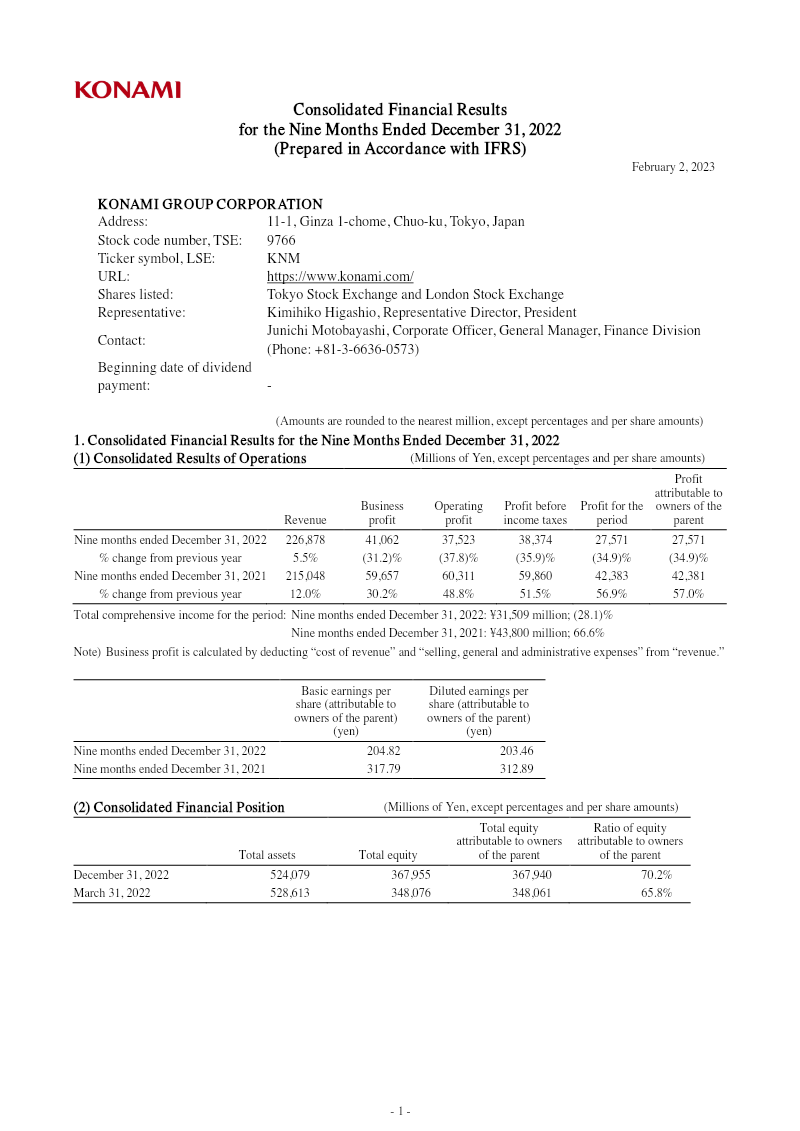
Consolidated Financial Results: Nine Months Ended December 31, 2022
18 pages~31 min full read
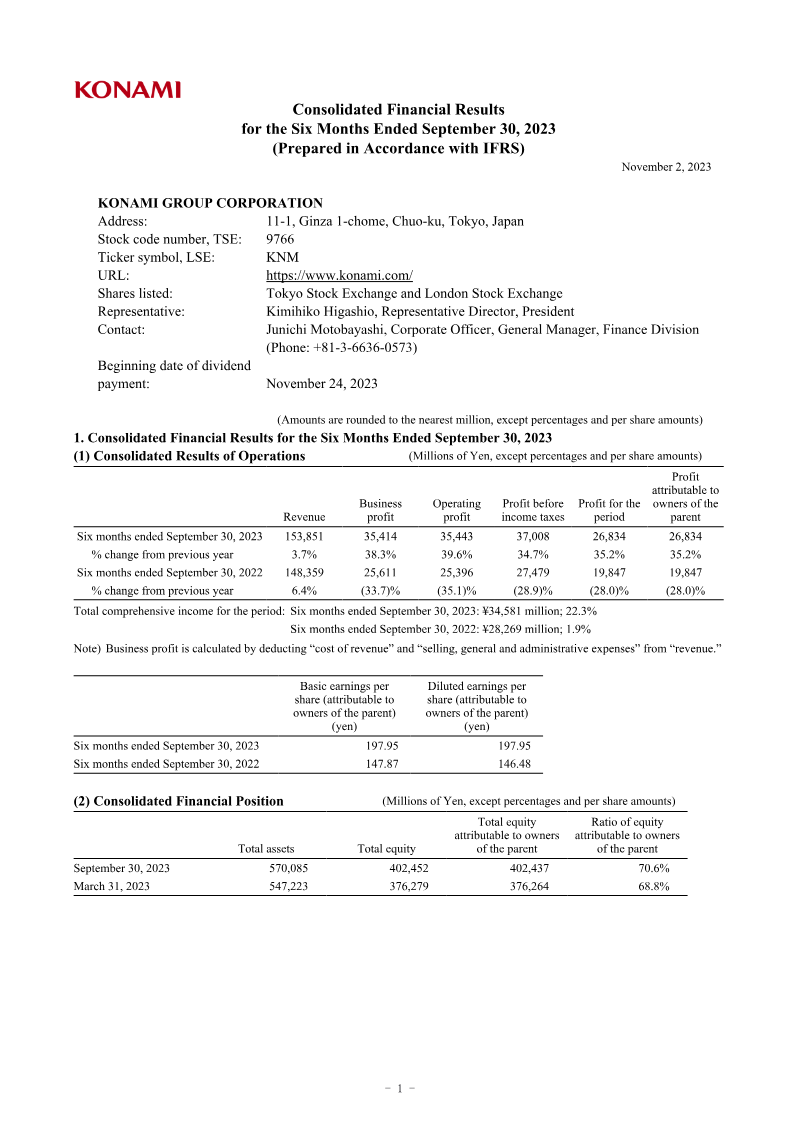
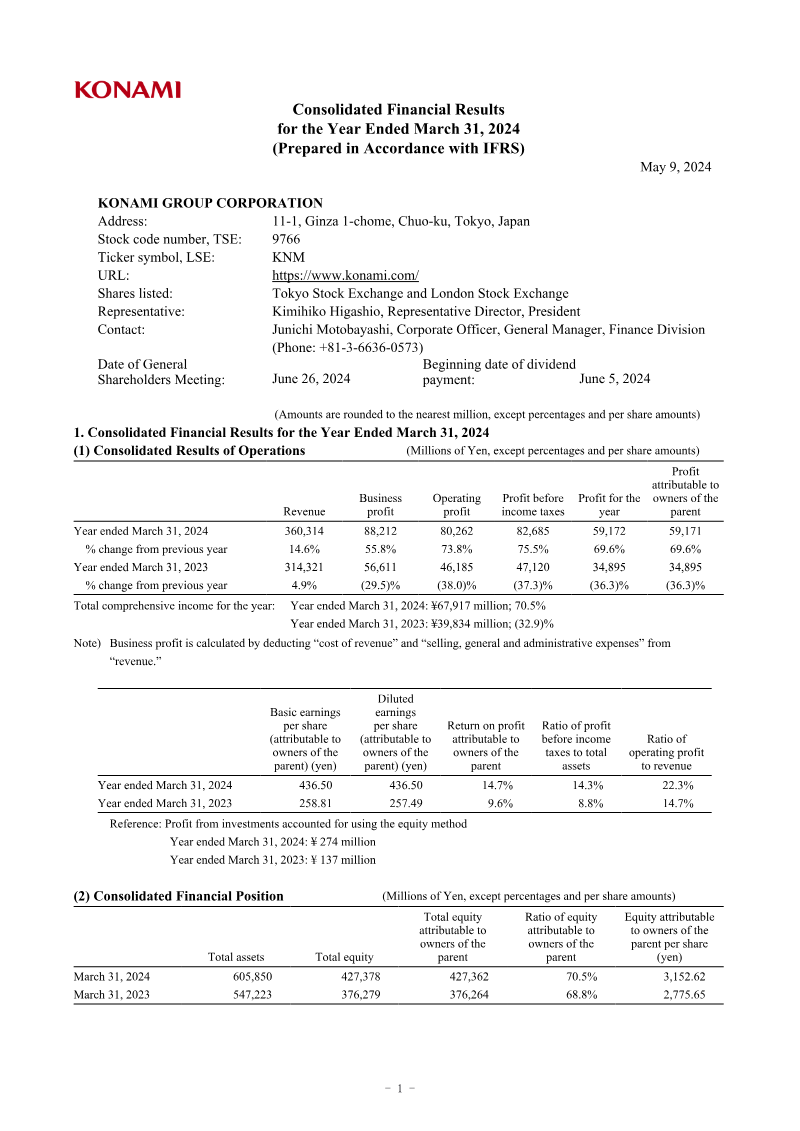
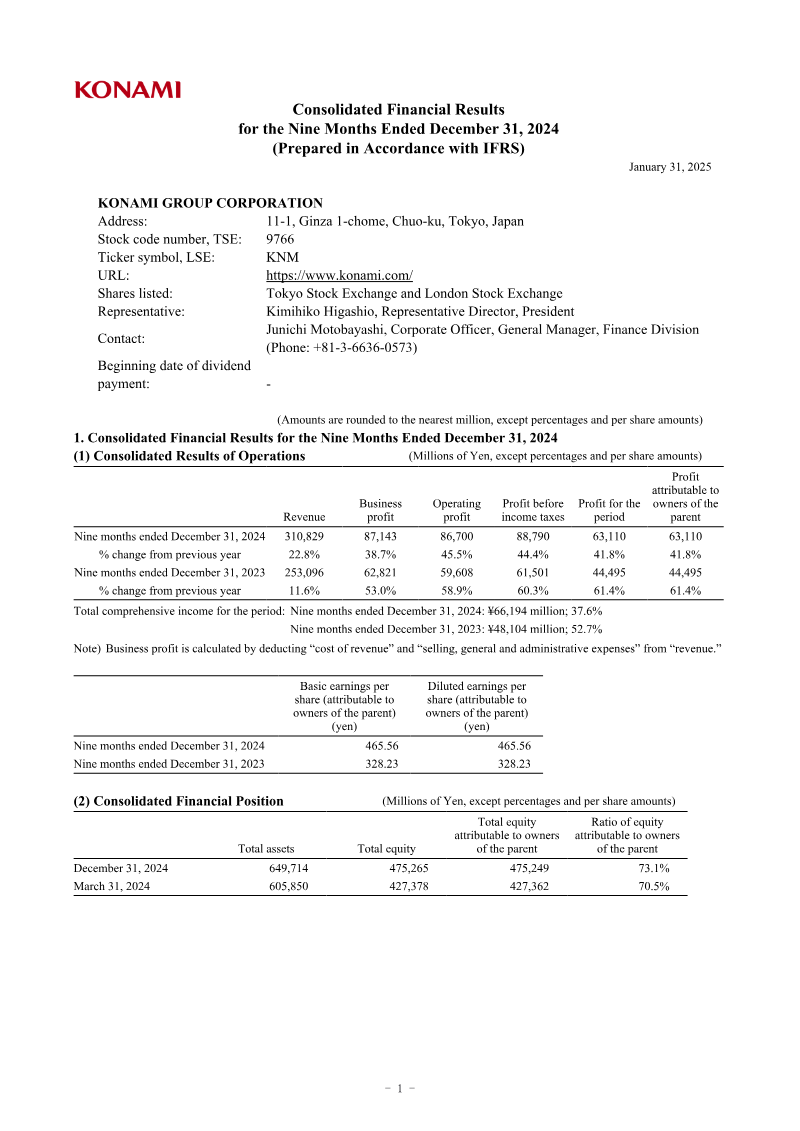
Konami Group experienced a period of financial divergence during the nine months ending December 31, 2022, characterized by top-line revenue growth coupled with significant bottom-line contraction. Total revenue rose by 5.5 percent to 226.8 billion yen, bolstered by the release of core gaming titles, favorable currency fluctuations stemming from yen depreciation, and robust performance within the Gaming and Systems segment, particularly in the United States market. This growth trajectory underscores the company’s continued reliance on its Digital Entertainment division as a primary revenue engine, even as it diversifies its international footprint.
Despite these gains, profitability faced substantial headwinds, with business profit falling 31.2 percent to 41.06 billion yen and operating profit declining to 37.5 billion yen from 60.3 billion yen in the prior year. This margin compression resulted from a confluence of rising operational costs, including increased product amortization, elevated promotional expenditures, and higher energy prices. The Amusement and Sports segments also contributed to the overall profit decline, reflecting broader challenges in maintaining cost efficiency across diverse business units.
In response to these fiscal pressures, the company revised its full-year consolidated earnings forecast downward, specifically adjusting profit expectations within the Digital Entertainment business. Moving forward, the strategic focus remains centered on long-term value creation through cross-platform game development, the expansion of eSports initiatives, and the stabilization of its amusement and sports club operations. By prioritizing these growth areas, the organization aims to navigate current macroeconomic volatility while leveraging its established intellectual property to regain operational momentum.
Konami Group Corporation
Konami Group Corporation
Konami Group Corporation
Konami Group Corporation
Konami Group Corporation
Konami Group Corporation

Sony Group Corporation · 2026

Bandai Namco · 2026

InvestGame · 2025

Square Enix · 2025

Konami · 2025

Nintendo · 2024

Bandai Namco · 2022

Bandai Namco · 2021

GREE · 2017

Bandai Namco · 2017
GREE Inc. · 2016
Bandai Namco · 2014