FinancialKonami Group Corporation
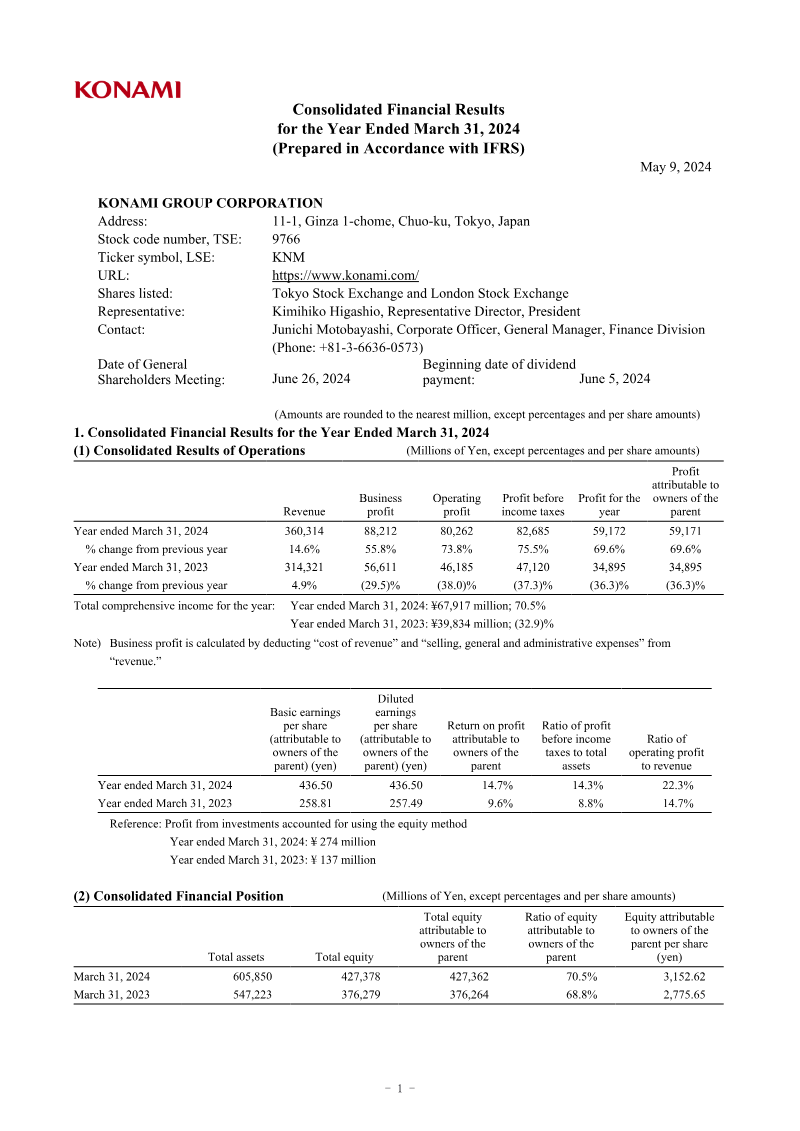
Consolidated Financial Results: Year Ended March 31, 2024
21 pages~42 min full read
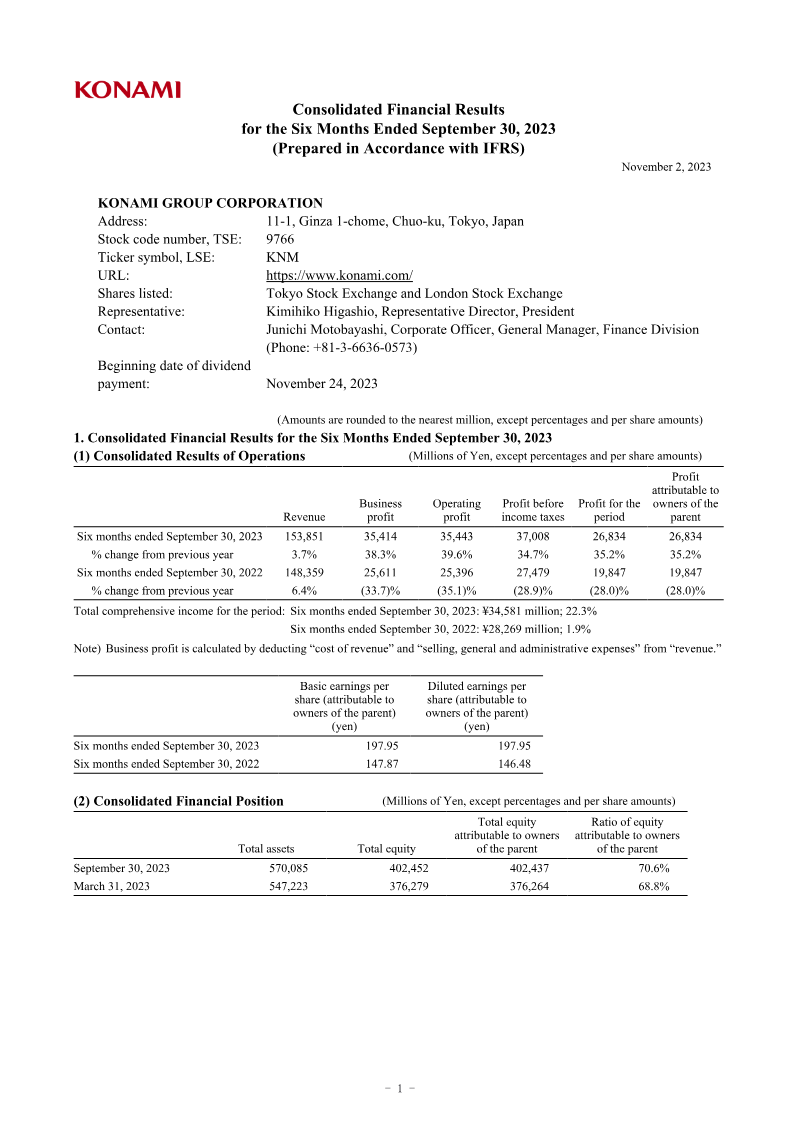
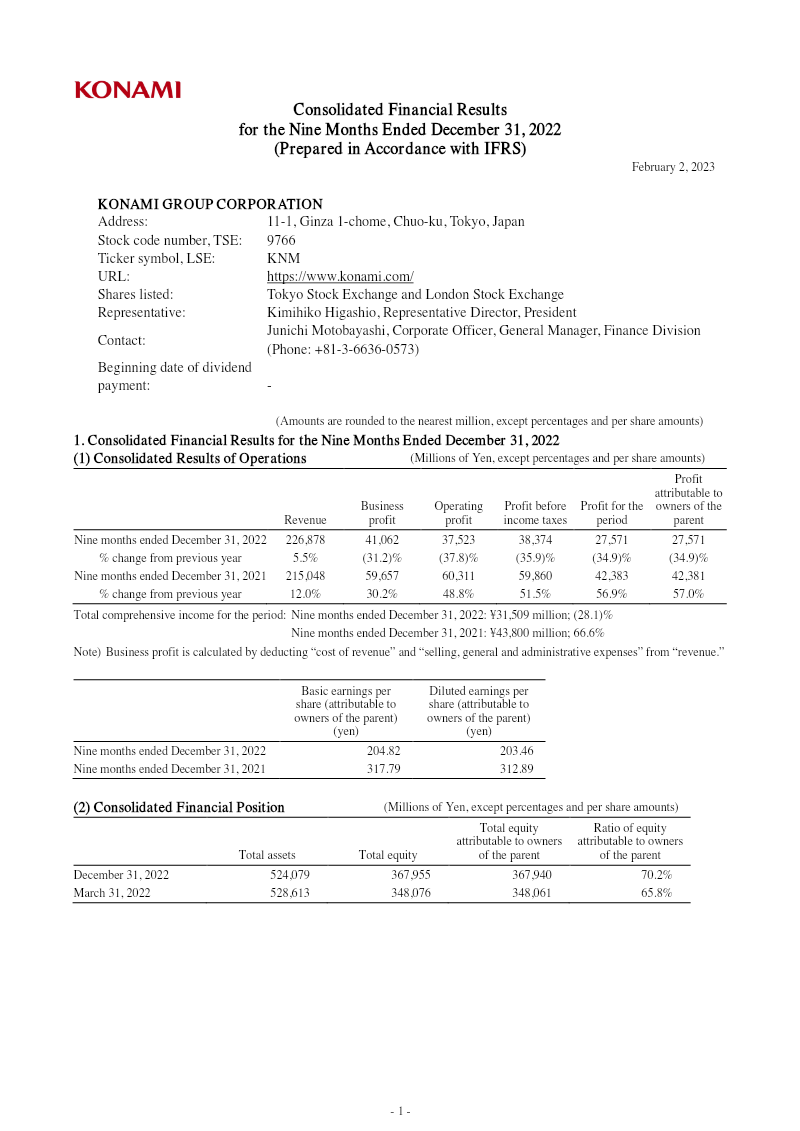
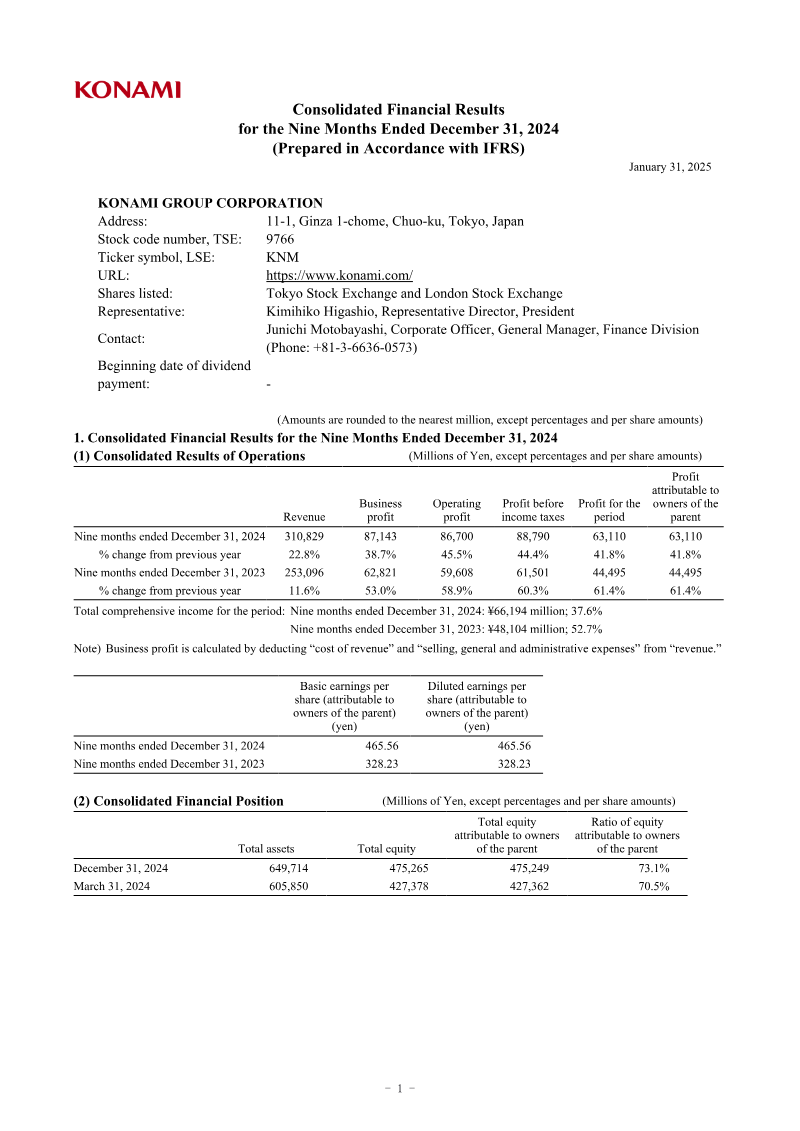
Konami Group Corporation achieved record-breaking financial performance for the fiscal year ending March 31, 2024, characterized by a 14.6% increase in total revenue to ¥360.3 billion and a substantial 69.6% surge in profit attributable to owners of the parent, reaching ¥59.2 billion. This growth trajectory was underpinned by robust performance across all primary business segments, with the Digital Entertainment division serving as a key driver through successful new title launches and consistent updates to core content. Earnings per share saw a marked improvement, rising to ¥436.50 from the previous year’s ¥258.81, reflecting the company’s strengthened market position and operational efficiency.
The organization’s financial health is further evidenced by a significant rise in cash and cash equivalents to ¥273,747 million, supported by a 185.5% increase in net cash provided by operating activities. With total assets reaching ¥605,850 million and a solid equity ratio of 70.5%, the company maintains a stable foundation for future investment. Diversified growth was evident across the Gaming & Systems, Sports, and Amusement segments, with the Sports division notably achieving a 415.8% profit increase. These gains were bolstered by strong performance within the Japanese market, which served as a primary catalyst for the overall revenue expansion.
Looking toward the fiscal year ending March 31, 2025, the company projects continued momentum with a revenue forecast of ¥380 billion. Strategic initiatives will focus on leveraging core intellectual property, expanding the reach of the DIMENSION slot series and SYNKROS casino systems, and further developing the network of sports and fitness facilities. By maintaining disciplined capital expenditure and consistent dividend distributions, the company remains positioned to sustain its growth trajectory while maximizing shareholder value through its multifaceted business model.
Konami Group Corporation
Konami Group Corporation
Konami Group Corporation
Konami Group Corporation
Konami Group Corporation
Konami Group Corporation

Bandai Namco · 2021
Bandai Namco · 2019
Bandai Namco · 2018

Bandai Namco · 2017
Bandai Namco · 2015
Bandai Namco · 2014

Bandai Namco · 2012
Bandai Namco · 2011

Bandai Namco · 2010

Bandai Namco · 2009
Bandai Namco · 2006
Koei Tecmo