Marketing & User Acquisition
Campaigns, ad creatives, app store optimization and the cost of a player.
271 documents


Sensor Tower · 2025
ReportThe State of Puzzle Games: An Analysis of the Puzzle Category in Mobile Gaming
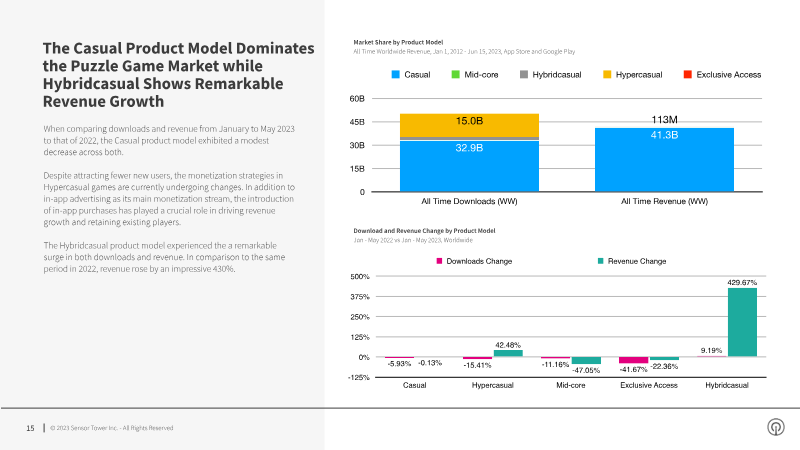
The mobile puzzle game market is undergoing a significant structural evolution, characterized by a shift in product models and a notable rise in hybridcasual gaming. This analysis, covering global data from January 2018 through June 2023, examines the performance of various puzzle sub-genres, including swap, blast, chain, and pair mechanics. By leveraging store intelligence and download estimates from the Apple App Store and Google Play, the findings highlight how developers are increasingly integrating meta-features and diversified monetization strategies to sustain revenue in a maturing landscape. A central finding is the remarkable growth of the hybridcasual product model, which saw a 430% increase in revenue between early 2022 and early 2023. While traditional casual games continue to dominate overall market share through consistent operations and robust meta-features, they have experienced modest declines in both downloads and revenue. Conversely, hybridcasual titles—particularly within the pair sub-genre—have successfully captured user interest by blending accessible gameplay with more sophisticated monetization tactics, such as in-app purchases, which were previously less common in hypercasual-leaning segments. The data indicates that sub-genres like pair have emerged as high-growth areas, with hybridcasual revenue in this category rising from $7 million in the first quarter of 2022 to $40 million by the first quarter of 2023. Meanwhile, other established sub-genres, such as merge and physics, have seen download declines as their reliance on hypercasual models wanes. Successful top-tier games across all categories now frequently employ a combination of live operations, season passes, and social clans to drive engagement. Ultimately, the puzzle market is moving toward a hybrid approach, where the simplicity of casual mechanics is increasingly supported by the deeper monetization and retention frameworks typically associated with mid-core titles.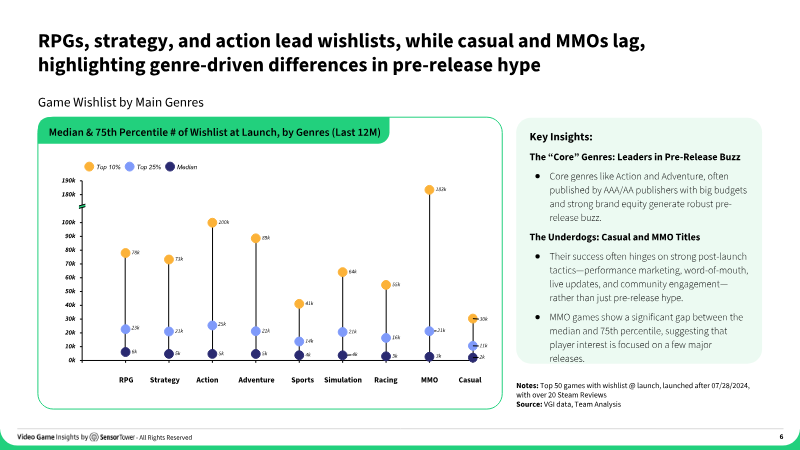

Video Game Insights · 2025
ReportThe Importance of Wishlists in 2025: Do Wishlists Matter?
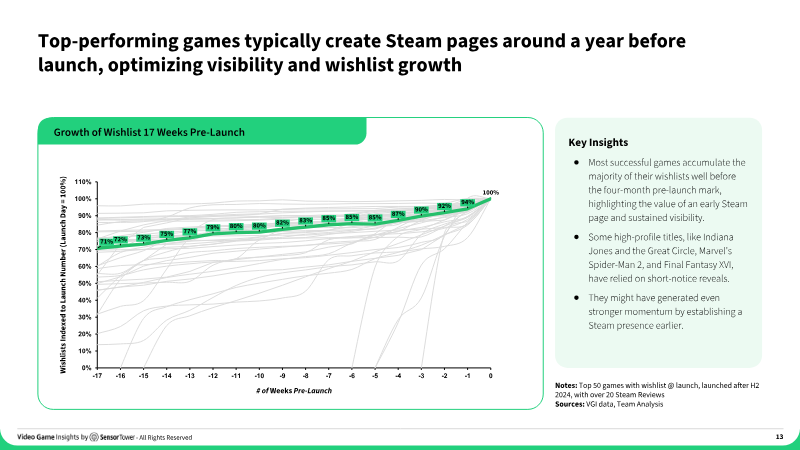
Steam wishlists serve as a critical metric for predicting commercial success in the video game industry, functioning as a primary indicator of pre-launch momentum. Data analysis reveals that wishlist distribution is highly top-heavy, with a significant majority of games launching with fewer than 10,000 wishlists, while only a small fraction of titles achieve the 100,000-plus threshold required to reliably forecast a breakout performance. There is a strong 70% correlation between pre-launch wishlist counts and first-month unit sales, particularly for titles that surpass the 100,000-wishlist milestone. Genre-specific trends highlight that action and adventure titles consistently generate the highest levels of pre-release buzz, often benefiting from the brand equity and marketing budgets of AAA and AA publishers. Conversely, casual and MMO titles frequently rely on post-launch engagement, such as live updates and community building, rather than pre-release wishlist accumulation. Regardless of genre, the timing of a Steam page launch is vital; top-performing games typically establish their presence six to twelve months before release, utilizing a steady stream of trailers and development updates to build and maintain audience interest. The findings are based on an analysis of games launched on Steam from March 2024 onwards, utilizing proprietary estimation models and industry data. The research emphasizes that while wishlists are not a guarantee of success for every title, they act as a essential barometer for market interest. For developers and publishers, the data underscores that early visibility and sustained marketing efforts are necessary to reach the wishlist tiers that statistically correlate with long-term commercial viability.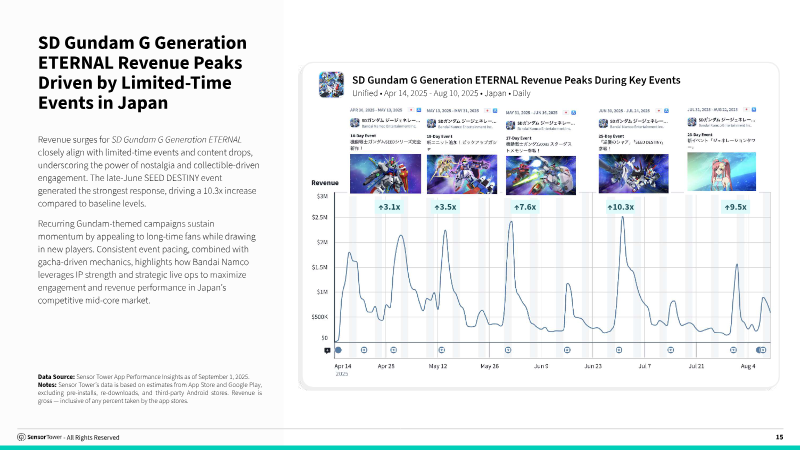

Sensor Tower · 2025
ReportJapan Game Market Insights 2025
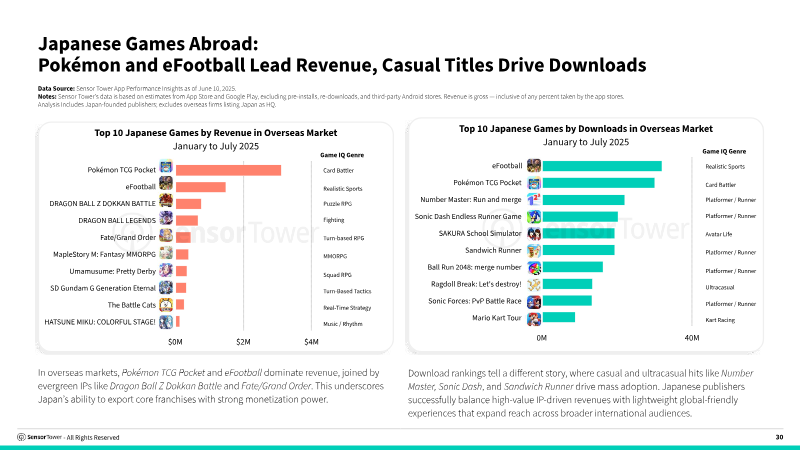
The analysis demonstrates that Japan’s mobile gaming sector has reached a mature equilibrium, with download volumes stabilising after 2020 while in‑app purchase (IAP) revenue continues to grow, largely driven by high‑spending iOS users. Domestic publishers hold a dominant position in downloads—capturing roughly one‑third of the market—and command more than half of total IAP revenue, underscoring Japan’s robust monetisation models and loyal consumer base. Genre preferences have shifted toward strategy titles such as Pokémon TCG Pocket and SD Gundam G Generation ETERNAL, alongside puzzle games that now lead download charts. Live‑ops and event‑driven monetisation prove highly effective, as illustrated by Last War: Survival’s H1 2025 performance. Aggressive daily offers and themed events produced a 2.7‑fold increase in downloads and significant revenue spikes during campaigns like Double Joy, confirming that adaptive event strategies resonate with Japanese players. Anime‑style IPs maintain a commanding presence, accounting for 42 % of in‑app purchase revenue from January to July 2025. Legacy franchises—Monster Strike, Fate/Grand Order, Umamusume—continue to perform strongly, while new titles such as Shadowverse: Worlds Beyond and Honkai: Star Rail expand the ecosystem, illustrating the enduring commercial relevance of anime IP. Digital advertising remains tightly coupled with gaming, with mobile action/strategy titles consuming 63 % of ad spend in H1 2025. LINE dominates the channel landscape, delivering approximately 40 billion impressions and over 80 % of mobile ad exposure. Cross‑IP collaborations and event‑driven campaigns sustain long‑term monetisation, reinforcing gaming’s role as a core growth driver for digital advertising in Japan. Overall, Japanese publishers retain global leadership through strong IP‑driven franchises across PC, console, and mobile platforms, with culturally resonant engagement and targeted advertising underpinning sustained revenue growth. Sensor Tower’s comprehensive analytics platform provides the critical insights that enable stakeholders to navigate this mature yet dynamic market.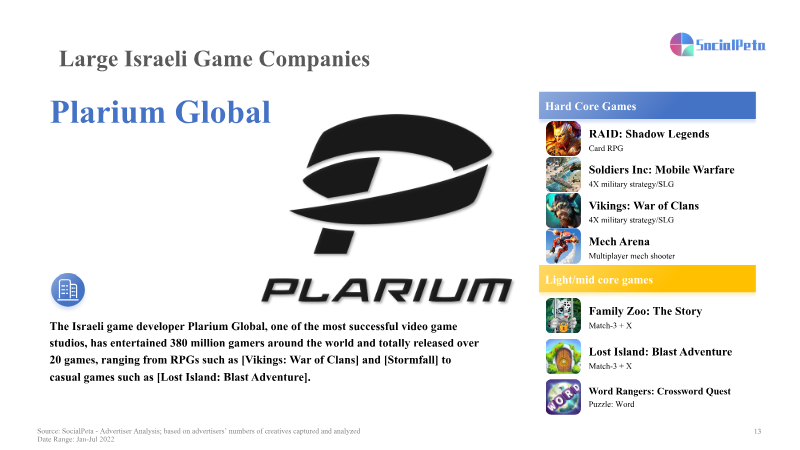

SocialPeta · 2025
ReportThe Israeli Mobile Game Market Report (2022)
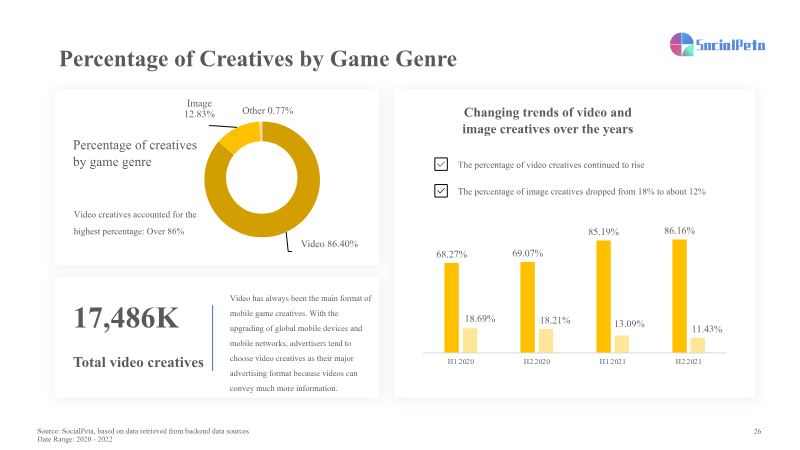
The Israeli mobile game market reached approximately $9 billion in 2021, driven by more than 200 companies and 14,000 employees. Casual, puzzle, and hyper‑casual titles now represent about one‑third of global mobile game advertising spend, a share amplified by COVID‑19‑induced growth in user acquisition and in‑app purchases. Israel has emerged as a pivotal source of high‑volume advertisers, particularly for action, strategy, and simulation games across iOS and Android platforms. Leading studios—Playtika, Plarium, Moon Active, and Crazy Labs—have scaled to global prominence, with their games ranking among the top 20 Israeli titles by ad spend and contributing substantially to worldwide revenue. Two flagship games illustrate this trend. RAID: Shadow Legends, launched in 2019, has exceeded 50 million downloads and generated roughly $700 million, with the United States accounting for 70 % of revenue and 40 % of downloads. Its 2022 advertising strategy deployed an average of 1,100 creatives daily, primarily on Google Ads and Facebook, with a heavier focus on Android. Coin Master, released in 2010 and revitalized in 2019, earned about $1.3 billion in 2021—over half from the U.S.—and averaged 2,500 creatives per day in 2022. The campaign concentrated on video formats across Google Ads for both iOS and Android, reflecting the dominance of video in mobile‑game advertising. Regional analysis shows distinct creative preferences. In the U.S., live‑action, KOL‑driven strategy tips dominate; Japanese campaigns emphasize character art and voice to drive gacha revenue; Korean ads showcase advanced graphics through extended gameplay footage. Across genres, short, engaging videos that spotlight core mechanics or narrative hooks are rising in popularity. Hyper‑casual ads now conclude on success rather than failure, strategy titles incorporate casual puzzles to widen appeal, RPGs employ influencer‑style clips, and simulation games use sympathetic drama with accessible gameplay to attract female players. These findings underscore a highly segmented, video‑centric advertising ecosystem that aligns creative content with regional tastes and genre conventions.
Unity · 2025
ReportMobile Growth and Monetization Report 2023
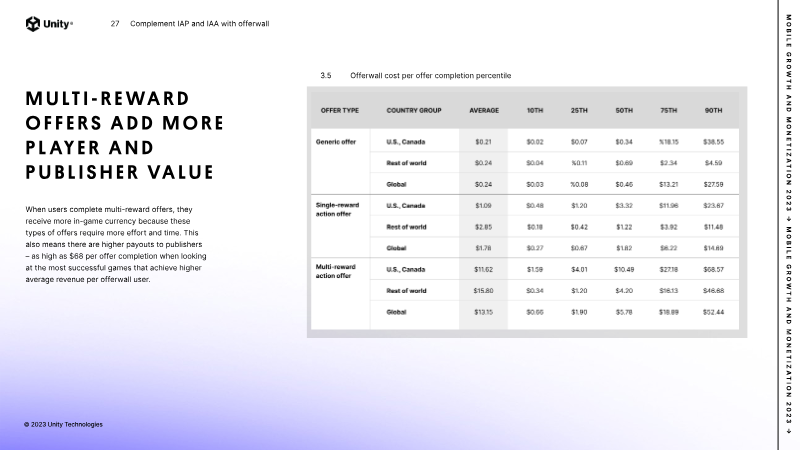
The report establishes that mobile game monetization is most effective when focused on early‑stage conversion and strategic ad placement. Analysis of 31 billion in‑app purchase events shows that 77 % of players who convert do so within the first two weeks, with currencies and limited‑time sales accounting for 22–23 % and 15–20 % of revenue respectively. Pricing the first purchase between $1 and $5 maximizes conversion efficiency, while targeting tier‑2 markets and deploying offerwalls can further enhance retention. Rewarded‑ad data, derived from 31 billion monthly impressions and 158 million installs, identifies high‑engagement placements between levels, in the IAP store, and lobby screens. Extra‑reward, currency, and gacha offers drive the greatest engagement. Offerwalls contribute roughly 33 % of total ad revenue, delivering about $4.68 per converted user; multi‑reward offers generate 60–82 % of conversions and can yield up to $68 per completion. These insights suggest that placing high‑visibility rewarded ads and integrating offerwalls can simultaneously boost retention and monetization. Complementary tactics such as custom store pages further improve player engagement. Offerwall conversions can increase day‑7 to day‑120 retention by up to fivefold, especially for high‑engagement segments. Custom store pages allow developers to align in‑game messaging with ad creatives, reducing resource costs and enhancing conversion rates. Targeting genre‑specific markets—sports in Japan or trivia in South Korea—can lift click‑through rates above tier‑2 averages, underscoring the importance of data‑driven audience and creative optimization. Overall, the findings emphasize a focused strategy: early conversion pricing, strategic rewarded‑ad placement, offerwall integration, and tailored store experiences. These combined tactics deliver measurable gains in retention, revenue, and campaign efficiency across iOS and Google Play platforms worldwide.

Adjust · 2025
ReportThe Gaming App Insights Report: 2025 Edition
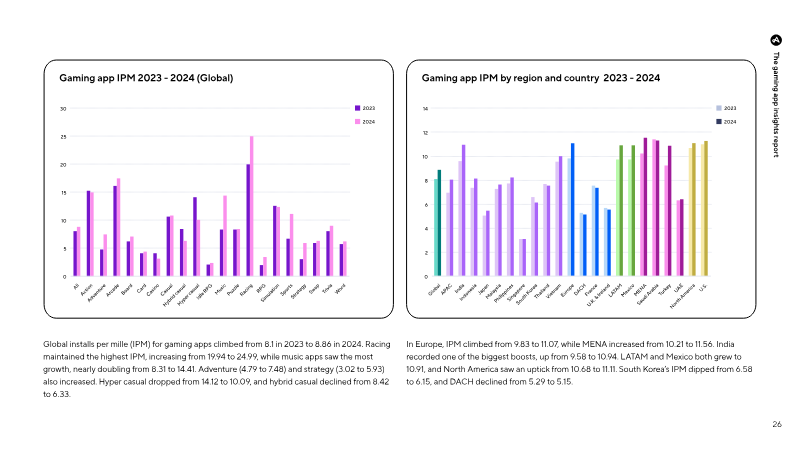
The 2025 Gaming App Insights Report presents a resilient mobile gaming market that rebounded strongly in 2024, projecting global revenue of $126.1 billion for 2025 and a 49% share of total gaming revenue, eclipsing console (28%) and PC (23%). AI‑driven personalization, dynamic monetization models, and cross‑platform play emerge as key drivers of higher retention, session length, and in‑app spending, particularly within battle royale and strategy genres. New acquisition channels—TikTok, connected TV, and influencer marketing—are reshaping player discovery, while studios that invest in AI for predictive churn mitigation and long‑term relationship building are positioned to capture the largest growth opportunities, especially as mobile gaming expands into LATAM and MENA regions. Privacy compliance shows modest improvement, with global ATT opt‑in rates rising to 37.9 % in Q1 2025; arcade titles lead the surge (42.4 → 59.3 %). Regional gains are strongest in Indonesia (58.6 %) and Malaysia (51.9 %), whereas markets such as the UAE, Japan, Saudi Arabia, and the Philippines experienced slight declines. Despite these gains, compliance remains uneven across genres and geographies. Advertising performance improved in 2024: installs per mille increased from 8.1 to 8.86, click‑through rates rose from 7 % to 9 %, and median cost per install fell slightly (0.38 → 0.36 USD). Median cost per mille dropped to $3.41, indicating more efficient ad spend. However, revenue‑per‑user metrics declined overall—ARPM fell across most categories and ARPMAU dropped from $0.31 to $0.28—though casino and strategy games bucked the trend with higher monetization. The report concludes that mobile gaming’s next growth wave will hinge on AI‑driven, culturally tailored experimentation and hyper‑personalized user journeys. Precise targeting—through dynamic difficulty, hybrid monetization, and live events—combined with community‑building tactics drives higher lifetime value. Teams that leverage cross‑platform measurement and analytics to iterate on data‑driven decisions will be best positioned to scale and shape the future of mobile gaming.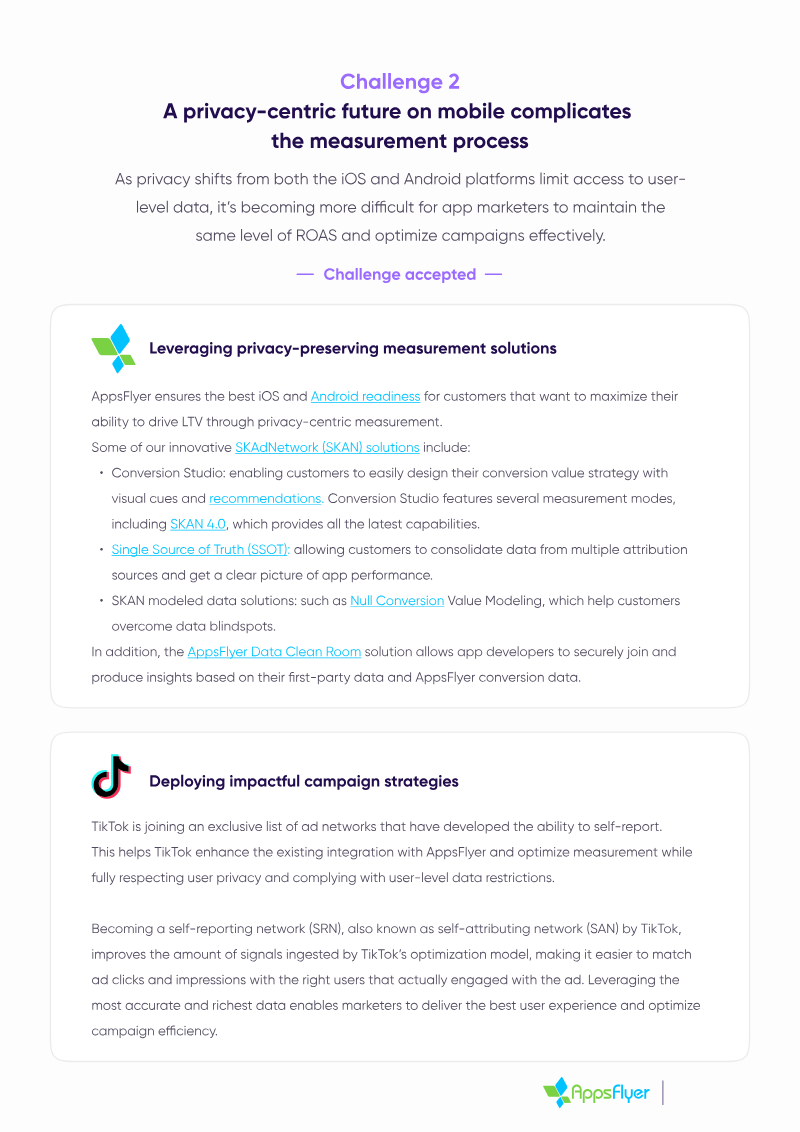


AppsFlyer · 2025
ReportTarget. Connect. Engage: Driving Profitable App Growth with Revenue-Boosting Strategies
The primary purpose of the analysis is to demonstrate how a strategic partnership between a mobile measurement partner (MMP) and TikTok’s advertising ecosystem can unlock profitable growth for app marketers. By integrating real‑time attribution, privacy‑preserving measurement, and value‑based optimization, brands can accurately credit campaigns, reduce fraud, and maximize return on ad spend (ROAS) across the entire customer journey. Key findings show that cross‑platform visibility is essential for identifying high‑value users and optimizing acquisition budgets, especially amid tightening privacy regulations on iOS and Android. AppsFlyer’s comprehensive measurement suite, combined with TikTok’s SKAdNetwork tools and self‑reporting network, delivers precise audience targeting and cost‑effective user acquisition. Case studies from Burger King, Casas Bahia, and Carrefour illustrate tangible results: a 7× ROI for coupon activations, a 44 % lift in conversion rates with a 55 % ROI gain, and a 29 % increase in in‑app revenue with triple the return compared to other channels. The document outlines best practices for app install and retargeting campaigns, recommending the use of App Event Optimization (AEO) and Value‑Based Optimization (VBO) to focus spend on high‑value actions. Automated Smart Performance Campaigns and real‑time ROAS measurement via AppsFlyer integrations further enhance efficiency and lifetime value. Geographically, the insights apply globally across major mobile markets, with a focus on the U.S., Europe, and emerging regions where TikTok’s user base is rapidly expanding. The time frame covers current privacy‑driven advertising environments and anticipates ongoing downturns, positioning the partnership as a resilient growth strategy for 2024‑2026.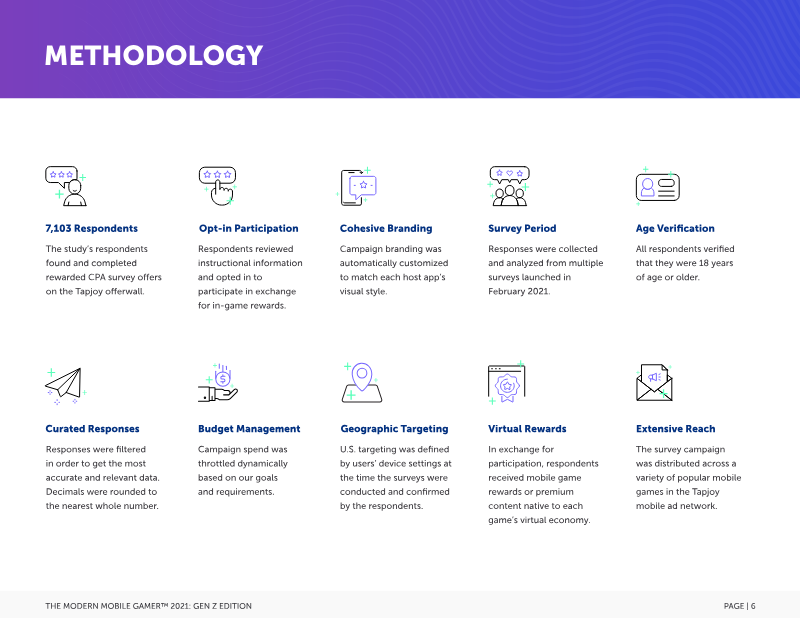

Tapjoy · 2025
ReportMobile Gamer 2021: Gen Z Edition
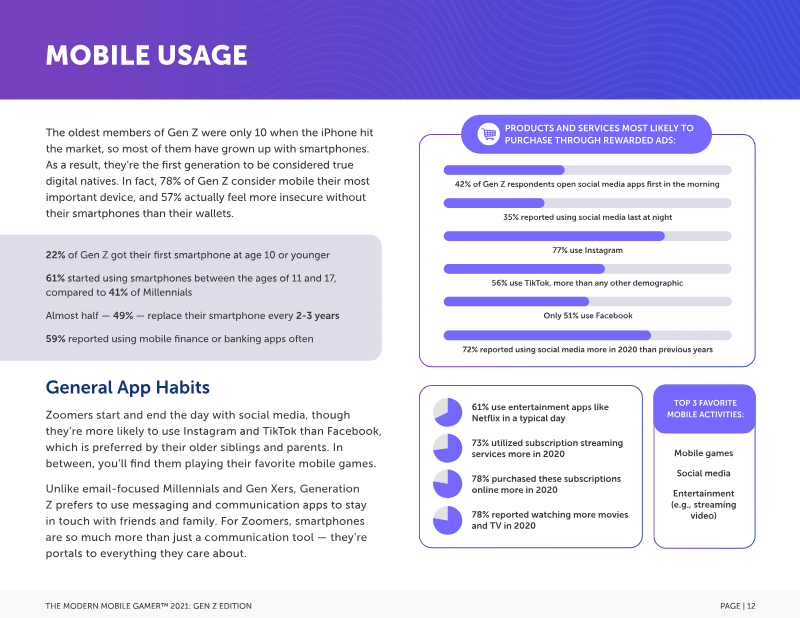
The report examines Generation Z (born 1997 and later) as the newest cohort of mobile gamers, highlighting their purchasing power, digital habits, and advertising preferences. Surveying 7,103 U.S. respondents aged 18‑24 on the Tapjoy network in February 2021, it finds that 86 % of Gen Z use mobile devices for gaming, far exceeding console (42 %) and PC (38 %) usage. Nearly one‑quarter first owned a smartphone before age 10, and 49 % replace devices every two to three years. Mobile shopping dominates their retail behavior: 68 % shop on phones one to four times per week, with 60 % ordering food delivery and 57 % making retail purchases. Preferred purchase channels include branded apps, e‑commerce storefronts, rewarded offers in games, and Instagram ads. Advertising engagement shows a strong preference for rewarded mobile game ads (61 % enjoy offerwalls) and short, creative content such as memes (50.4 %) and humor‑driven brand posts (57 % value humor). Traditional formats—banner ads, non‑skippable videos, and celebrity endorsements—are largely ineffective. Gen Z follows brands that align with their values; 52 % discover new products via social media, and 67 % follow brands for product interest. The methodology involved opt‑in participation with age verification, automatic reward distribution, and a geographically targeted U.S. sample. Overall, the findings portray Gen Z as highly engaged mobile gamers with significant discretionary spending, a preference for value‑based advertising, and a strong inclination toward brands that reflect their social and environmental values.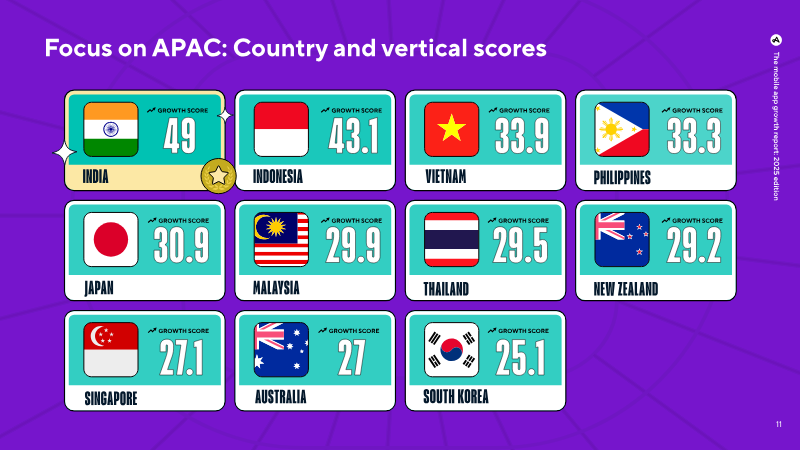

Adjust · 2025
ReportThe Mobile App Growth Report: 2025 Edition
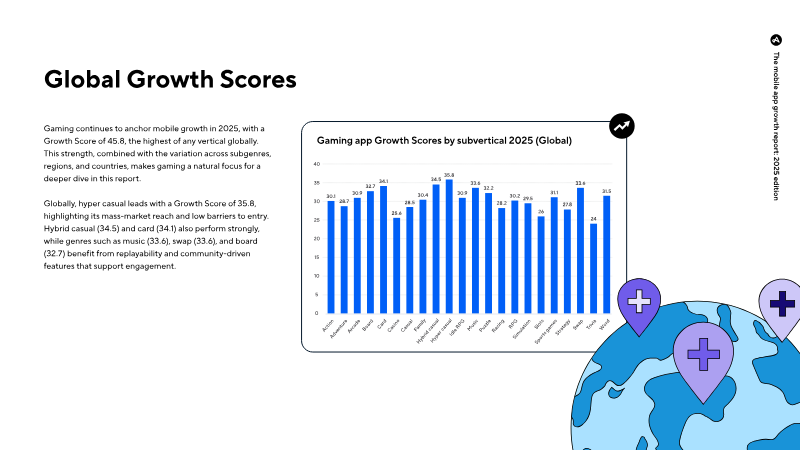
Global mobile app growth remains resilient in 2025, characterized by an 11% year-over-year increase in installs and a 10% rise in user sessions. This expansion is increasingly defined by a shift from pure volume-based acquisition toward a value-driven model that balances cost efficiency, engagement, and long-term retention. The Asia-Pacific region has emerged as the primary engine of this global momentum, achieving the highest regional growth score of 45, with India specifically leading all individual nations with a score of 49. While established markets like North America show more modest growth metrics, they remain critical hubs for high-value user monetization and sophisticated optimization strategies. Gaming continues to be the dominant vertical worldwide, particularly within the hyper-casual and hybrid-casual subgenres. This sector is especially potent in emerging markets; India’s gaming growth score of 52.2 underscores its status as a premier expansion target, while the Latin American and Middle Eastern markets are projected to reach significant revenue milestones of $35.9 billion and $3.73 billion respectively by 2030. Beyond gaming, the publications and utilities sectors have demonstrated consistent strength across Western markets, indicating a diversified landscape where functional and content-driven apps maintain high engagement levels. The current mobile ecosystem requires a strategic pivot toward sophisticated analytics and retention-focused operations. In regions like North America, where user acquisition costs are higher, success depends on maximizing average revenue per user and leveraging artificial intelligence to refine marketing spend. Meanwhile, specific regional opportunities, such as the rise of card and arcade games in Türkiye, highlight the importance of localized content strategies. Ultimately, the global market is transitioning into a phase where sustainable growth is achieved through the integration of high-quality user experiences and data-driven efficiency rather than simple install volume.
Sensor Tower · 2025
ReportPlaying to Win: 2025 Digital Game Advertising Report
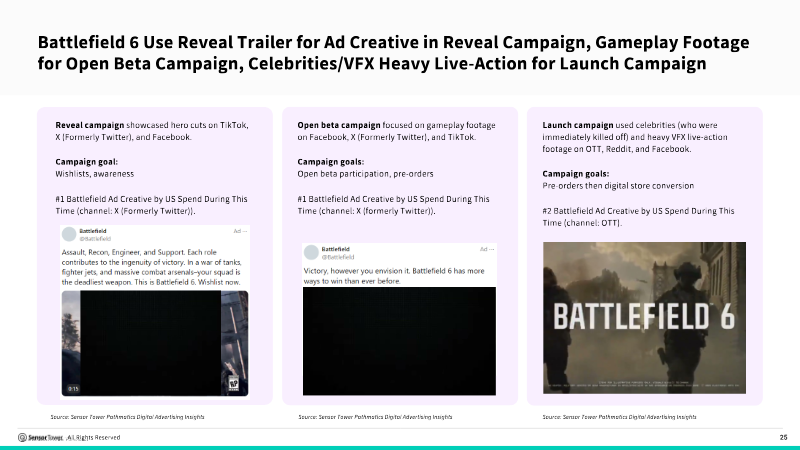
The 2025 digital gaming market is defined by a strategic pivot toward user quality and high-velocity creative iteration, with global advertising expenditure reaching $8.7 billion. Despite a year-over-year decline in total mobile and PC downloads, the industry remains robust through the resurgence of the shooter genre and the continued dominance of 4X Strategy and Casual titles. Geographically, growth is concentrated in North American and Asian markets, fueled by high-profile releases such as Battlefield 6 and Valorant Mobile. This landscape reflects a shift where major publishers like Microsoft and Dream Games utilize aggressive spending to maintain market share in an increasingly competitive environment. Advertising strategies have evolved to prioritize "instantly legible" gameplay and the rapid deployment of creative assets to combat audience fatigue. Static image ads remain a resilient tool due to their cost-effectiveness, while generative AI is increasingly employed to test and iterate high volumes of creative concepts. Intellectual property collaborations, featuring franchises like Naruto and Teenage Mutant Ninja Turtles, serve as a primary mechanism for lowering acquisition costs. Furthermore, platforms like YouTube have become essential for reaching PC and console audiences, while Apple Search Ads are leveraged tactically to capture competitor keywords and dominate search visibility. The digital ecosystem also highlights the growing influence of internal discovery and content creators. Roblox maintains a massive web presence with over 187 billion visits, driven largely by organic traffic and internal discovery mechanisms rather than traditional external advertising. Meanwhile, viral indie titles and major releases like Marvel Rivals achieve commercial success by leveraging creator-led marketing. Ultimately, the industry in 2025 is characterized by a sophisticated blend of data-driven acquisition, aggressive platform-specific tactics, and a reliance on established IPs to navigate a market where engagement quality has surpassed sheer scale as the primary metric for success.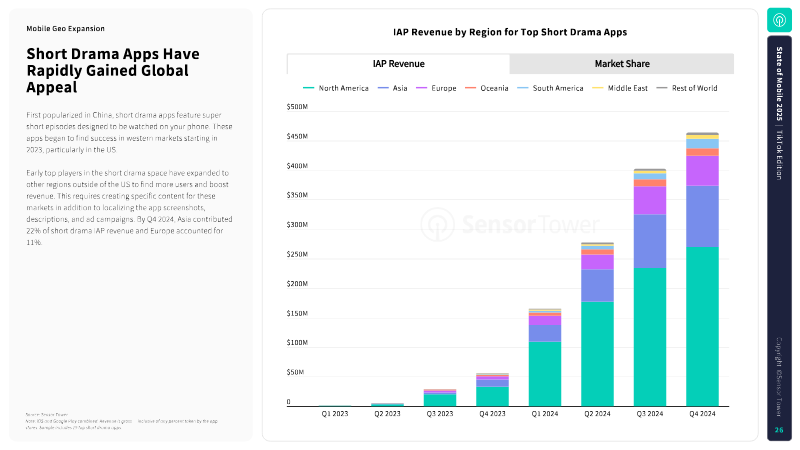

Sensor Tower · 2025
ReportState of Mobile 2025: TikTok Edition
The mobile industry reached a significant milestone in 2024, generating a record $150 billion in in-app purchase revenue, representing a 12.5% year-over-year increase. While global downloads experienced a marginal 1% decline to 136 billion, user engagement reached an all-time high of 4.2 trillion total hours. This growth was primarily fueled by non-gaming sectors, specifically Entertainment, Productivity, and Photo & Video, alongside a recovering mobile gaming market where eleven titles surpassed $1 billion in annual revenue. Geographically, North America and Europe remain the strongest monetization hubs, though nearly 80% of total consumer spend now occurs outside an app’s home country, signaling a highly globalized marketplace. Artificial Intelligence has emerged as the primary catalyst for industry transformation, with AI chatbots recording a 200% revenue surge and generative AI apps reaching $1.3 billion in annual spend. This technology is being integrated across diverse verticals, from productivity tools to dating apps like Tinder and Grindr, which are utilizing AI to streamline user experiences and facilitate real-world connections. The Productivity and Utility sector specifically benefited from this trend, seeing a 35% revenue increase to $15 billion. Furthermore, niche categories such as short-form drama apps and fitness reward platforms are gaining significant traction, with the latter benefiting from a shift toward social "run clubs" and outdoor exercise. The 2024 landscape also highlights a shift in monetization strategies and user behavior. In the dating sector, revenue grew by 14% despite a decrease in time spent, suggesting that users are prioritizing efficient, high-value interactions over passive scrolling. Meanwhile, the Health and Fitness category continues to see strong seasonal surges and global expansion in markets like Germany and Australia. Across all sectors, the industry is moving toward community-focused retention and sophisticated subscription models, leveraging AI to maintain high per-user monetization even as traditional download growth stabilizes in mature markets.

Stream Hatchet · 2025
Report