Marketing & User Acquisition
Campaigns, ad creatives, app store optimization and the cost of a player.
232 documents

Adjust · 2022
ReportJapan Mobile App Trends 2022: Essential App Performance Benchmarks and Insights
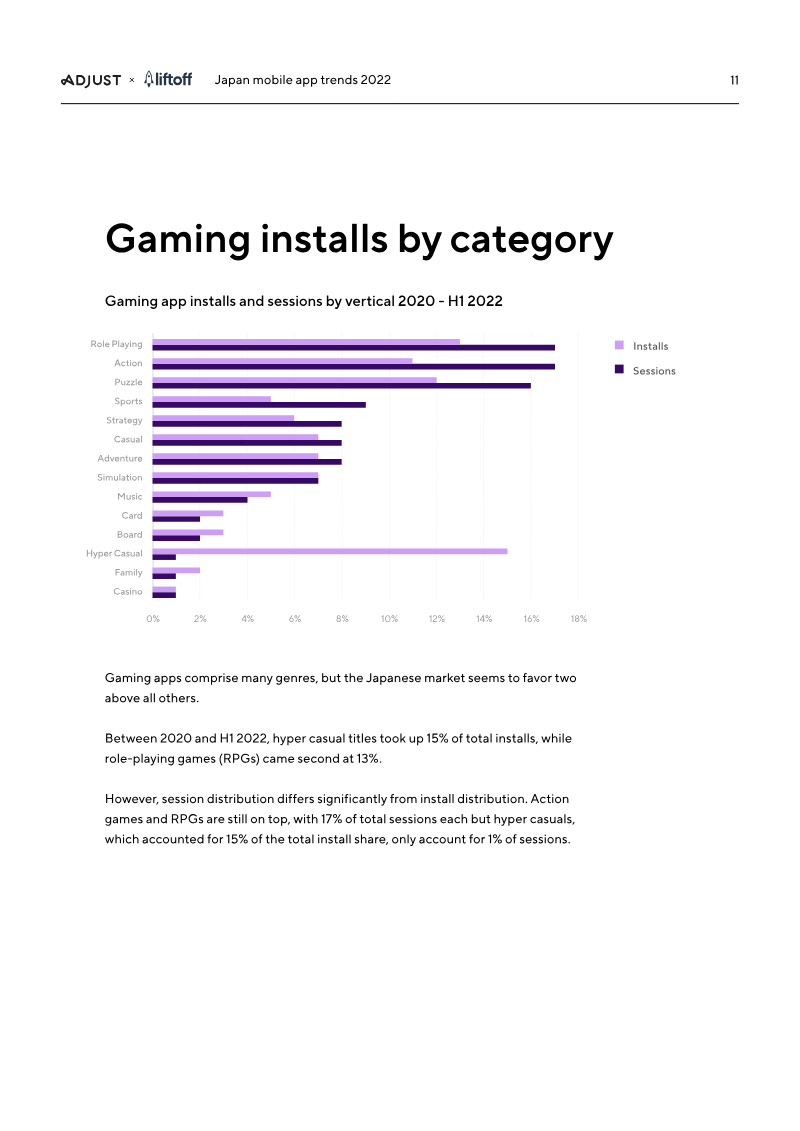
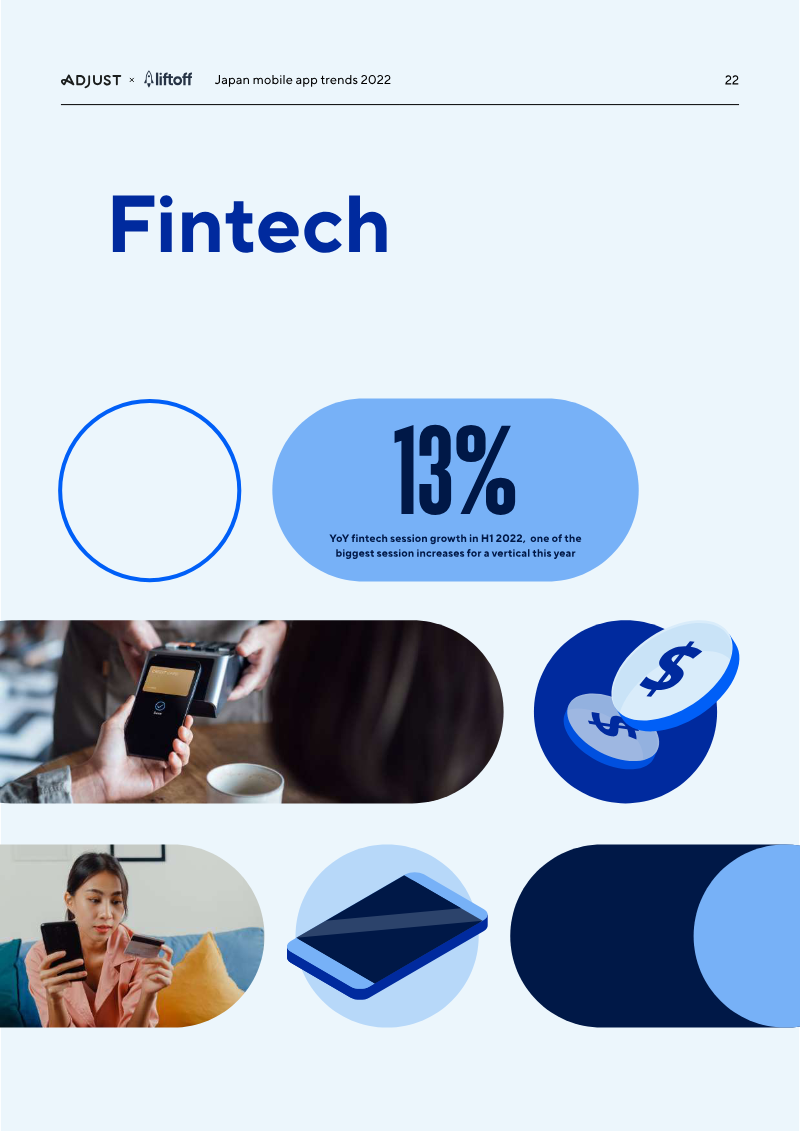
The Japanese mobile app market underwent a period of significant expansion between 2020 and mid-2022, characterized by a 19% increase in total installs and a 12% rise in user sessions. Gaming remains the primary driver of this growth, with installs surging 52% year-over-year. Within this vertical, Hyper Casual and RPG titles command the largest market shares, accounting for 15% and 13% of installs respectively. While gaming leads in volume, the Fintech and E-commerce sectors have reached record engagement levels, with E-commerce sessions growing 29% over 2020 benchmarks and Fintech sessions rising 13% annually. User acquisition dynamics in Japan reveal a complex landscape of costs and returns across different platforms and genres. Dating apps face particularly high acquisition hurdles, with costs per install peaking at $6.60, while puzzle games average a $5.48 cost per install. Data indicates that Android users frequently outperform iOS users in terms of conversion efficiency and return on ad spend, particularly within the gaming and dating verticals. These performance metrics suggest that while the market is maturing, strategic platform selection remains critical for optimizing marketing budgets. Looking toward future growth, the Japanese digital landscape is shifting toward multi-channel engagement, with Connected TV emerging as a vital marketing frontier. Projections suggest that ad spend in the Japanese Connected TV sector will reach ¥58.8 billion by 2024. This evolution, supported by data from the top 2,000 performing apps, underscores a resilient mobile economy where traditional gaming dominance is being supplemented by rapid digital transformation in financial services and retail. The transition from 2020 through the first half of 2022 highlights a market that is both expanding in scale and diversifying in its technological reach.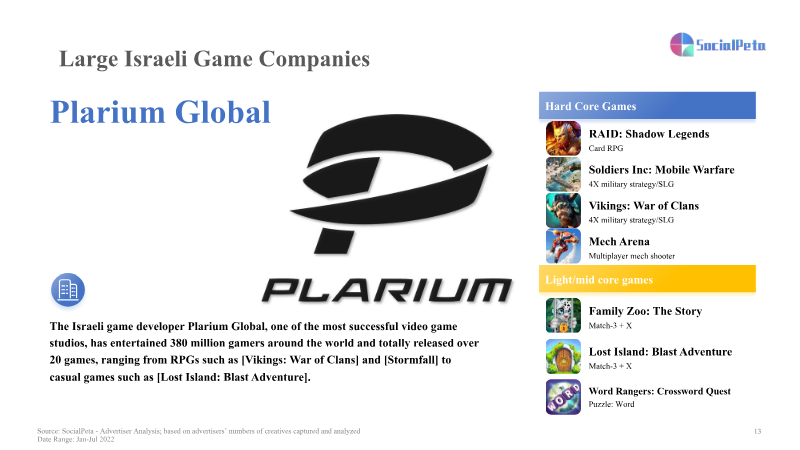
SocialPeta · 2022
Report2022 Israeli Mobile Game Market Report
The 2022 Israeli mobile-game market is portrayed as a rapidly expanding sector that now commands a global presence, with the analysis aiming to quantify its economic weight, identify the drivers behind its growth, and assess its competitive standing worldwide. In 2022 the market generated roughly nine billion dollars in revenue, supported by about two hundred development studios employing fourteen thousand people. Social and casual titles dominate both investment flows and install numbers, while action, strategy and hyper-casual games lead in downloads and earnings, exemplified by hits such as Coin Master, PUBG Mobile and Fill the Fridge!. The surge was accelerated by the COVID-19 pandemic, which deepened user engagement and boosted in-app purchases, turning mobile gaming into a habitual pastime for a broad audience. Leading Israeli publishers—Playtika, Plarium, Moon Active and Crazy Labs—have leveraged this momentum to become global players, delivering diversified portfolios that span social, casino, RPG and simulation genres and consistently ranking among the world’s top-performing titles. Beyond domestic performance, the study highlights divergent creative advertising formats across key international markets. U.S. campaigns favor live-action influencer videos, Japanese ads emphasize character artwork, voice acting and gacha-driven narratives, while South Korean promotions adopt their own distinct stylistic approaches. These regional preferences underscore the importance of tailored marketing strategies for Israeli developers seeking to expand beyond their home market.


Appsumer · 2022
ReportMobile Advertising Benchmark Report Q2 2022
The analysis evaluates how the universal rollout of Apple’s AppTrackingTransparency framework reshaped media-mix decisions for performance-driven mobile-app advertisers between the second quarters of 2021 and 2022. By comparing adoption rates and share-of-wallet across the principal acquisition channels, it demonstrates that Apple Search Ads (ASA) has moved from a peripheral position to a core component of the duopoly with Google, overtaking Facebook in advertiser adoption while narrowing the gap in spend allocation. ASA’s adoption climbed to 94.8%—a four-point year-over-year increase—and its share-of-wallet rose five points to 15%. In contrast, Facebook’s adoption slipped to 82.8% (down three points) and its share-of-wallet fell four points to 28%, though a modest rebound from Q4 2021 to Q2 2022 hints at recovery. Google remained stable, with roughly 95% adoption and a 34% share-of-wallet, reflecting its dominance on Android. Among lower-tier channels, TikTok’s adoption fell to 43.2% (down seven points) while its spend share held steady at 3%; Snap’s adoption edged up to 32.7% after a dip, yet its share-of-wallet halved to 2%. Top-five DSPs and ad networks grew to 27% adoption, indicating a shift toward non-self-attributing solutions
Sensor Tower · 2022
ReportStore Intelligence Data Digest: Q1 2022
Global app downloads reached 36.9 billion in the first quarter of 2022, representing a 1.4% year-over-year increase. This period marked a significant milestone for TikTok, which surpassed 3.5 billion all-time downloads to become the top global app, while Meta reclaimed its position as the leading publisher for the first time in two years. Although Google Play growth began to flatten as pandemic-era surges subsided, the mobile gaming sector showed signs of recovery with total downloads reaching 14.34 billion across both major storefronts. India remained the largest market for total downloads, while Vietnam and Pakistan emerged as high-growth regions with year-over-year increases exceeding 20%. Market dynamics were heavily influenced by viral trends and macroeconomic shifts. The "Wordle" phenomenon revitalized the word game sub-genre, driving a 74% quarter-over-quarter increase in U.S. downloads and prompting major publishers like AppLovin and Rovio to acquire similar titles. Simultaneously, high inflation and rising fuel costs triggered a 1,500% spike in demand for gas-tracking apps like GasBuddy in the United States. In the entertainment sector, the U.S. video streaming market continued to fragment; the market share of the top three apps plummeted from 80% in 2019 to just 37% as newer platforms like HBO Max and Disney+ gained traction through major content releases and live sports. The competitive landscape remains dominated by established giants, yet regional variations persist. While Meta and Google maintained a stronghold in Western markets, shopping apps like Shopee saw massive adoption in Asia, where Google Play shopping installs surged by 63%. In the gaming sector, Garena Free Fire maintained its global lead, particularly in Asia, while Subway Surfers experienced a notable 45% growth resurgence in Europe. These findings illustrate a maturing global app economy where growth is increasingly driven by specific regional demands, viral social trends, and shifting consumer priorities in response to economic pressures.

CyberAgent · 2022
Presentation1Q FY2022 Presentation Material: October to December 2021
CyberAgent demonstrated significant financial growth during the first quarter of fiscal year 2022, with consolidated sales reaching 171 billion yen and operating profit increasing nearly threefold to 19.8 billion yen. This performance was primarily catalyzed by the Game business, where sales nearly doubled to 58.3 billion yen. The massive success of Uma Musume Pretty Derby, which surpassed 12 million downloads, drove a 15.1-fold year-over-year increase in operating profit for the segment. Despite this momentum, the inherent volatility of the gaming market led to a cautious approach regarding full-year forecasts. The Media segment, led by the streaming platform ABEMA, achieved 24.9 billion yen in sales but reported an operating loss of 3.8 billion yen. This deficit reflects aggressive reinvestment into the online betting platform WINTICKET and content expansion, including the acquisition of Babel Label and integration with the Nintendo Switch. ABEMA continues to scale its reach, recording over 76 million downloads and 18 million weekly active users. Meanwhile, the Internet Advertisement business achieved record sales, supported by the launch of three new subsidiaries focused on digital transformation. The long-term strategic framework involves utilizing high-margin profits from the Advertising and Game segments to fund the evolution of Media into a primary growth pillar and essential social infrastructure. This vision is underpinned by a corporate purpose focused on overcoming economic stagnation through digital innovation and global expansion. Future growth in the gaming sector is anticipated through a robust pipeline of high-profile intellectual properties, including titles based on Final Fantasy VII and Jujutsu Kaisen, while broader corporate sustainability is managed through integrated ESG initiatives.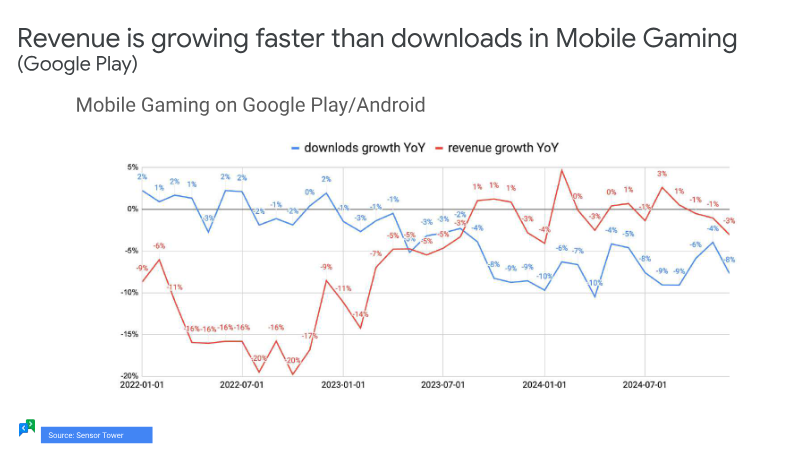
Google · 2022
ReportData for Mobile Gaming 2022-2024
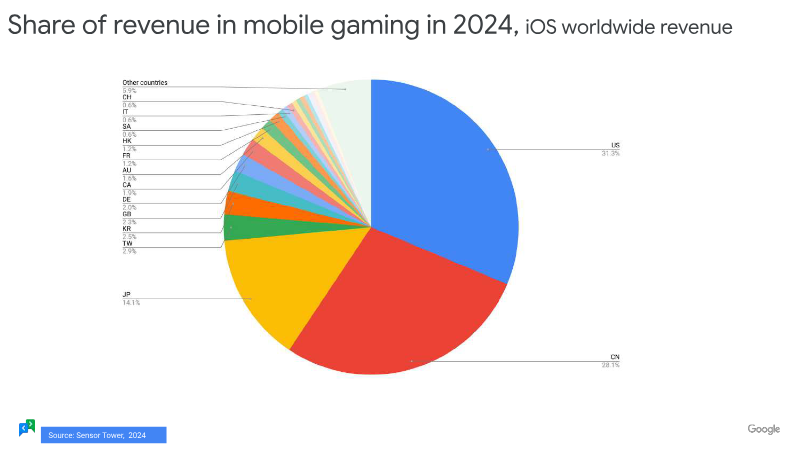
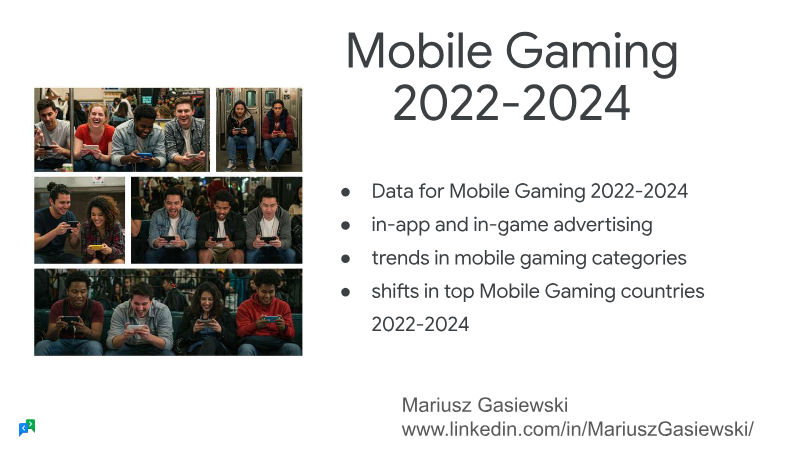
Mobile gaming maintains its position as the primary driver of industry expansion, fueled by widespread smartphone adoption and consistent engagement across both emerging and established markets. Between 2022 and 2024, the sector has demonstrated a clear trend where revenue growth consistently outpaces download volume on both iOS and Android platforms. This financial trajectory is increasingly supported by a strategic shift toward in-game advertising, which is currently outpacing traditional in-app purchases as a primary revenue stream. Global market dynamics remain anchored by the United States, China, and Japan, which continue to serve as the most significant revenue generators. However, emerging markets are playing an increasingly critical role in the industry’s growth, particularly in regions like Brazil, where smartphone gaming penetration has surpassed 90% across all demographics. In these regions, player behavior is heavily influenced by free-to-play accessibility, narrative depth, and social recommendations. Furthermore, data from the U.S. and U.K. confirms that younger demographics prioritize smartphones over consoles and PCs, solidifying the mobile device as the central hub for modern gaming. Despite the proliferation of available titles, the global player base exhibits a preference for focused engagement, with many users choosing to dedicate their time to a single game rather than managing multiple titles simultaneously. While market concentration among top-tier publishers remains stable, the rapid expansion of the advertising sector suggests a fundamental change in how developers monetize their audiences. Ultimately, the industry is transitioning toward a model that prioritizes long-term retention and diversified revenue streams over simple volume-based growth, ensuring that mobile gaming remains the most influential segment of the broader interactive entertainment landscape.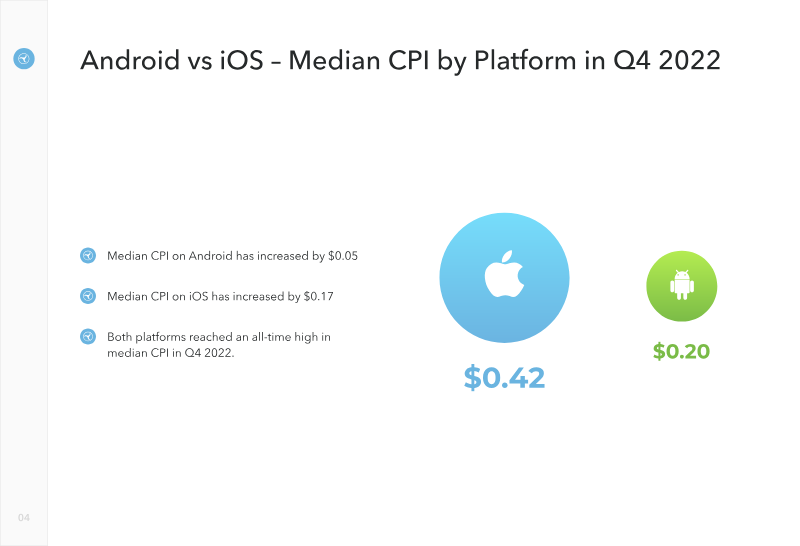
Tenjin · 2022
ReportThe Hyper-Casual Benchmark Report: Q3 2022
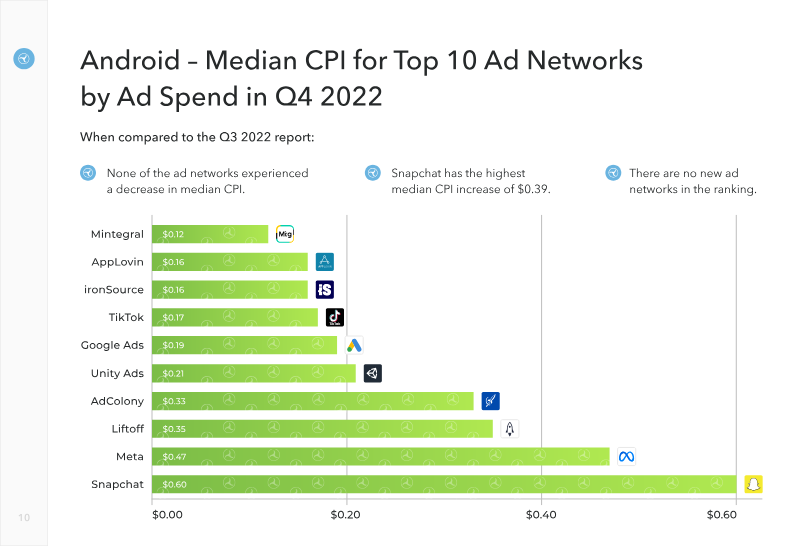
The hyper-casual mobile gaming sector experienced a notable escalation in acquisition costs during the latter half of 2022, characterized by rising median cost-per-install (CPI) rates across both Android and iOS platforms. By the fourth quarter of 2022, median CPI reached all-time highs of $0.20 on Android and $0.42 on iOS. This upward trend in acquisition spending was global, as no major market tracked by ad spend experienced a decrease in median CPI on Android, while iOS markets saw varied fluctuations, including a significant decrease in the United States and notable increases in France and Germany. Retention metrics reveal a consistent performance advantage for iOS over Android across all tiers of game quality. For the top 2% of hyper-casual titles, iOS achieved a 45% Day 1 retention rate compared to 38% on Android, with Day 7 retention figures similarly favoring iOS at 19% versus 14%. This performance gap persists among the top 25% of games and the median cohort, where iOS maintains a higher percentage of returning players. These findings underscore a widening disparity between high-performing titles and average games, emphasizing the critical importance of engagement optimization in a landscape of increasing user acquisition costs. The analysis draws upon data from over 100,000 games and one-third of the global mobile player base to establish these benchmarks. By segmenting performance by platform and geographic region, the data highlights the shifting economic landscape for developers and publishers. The findings suggest that while market saturation and rising costs present significant challenges, the ability to maintain player retention remains the primary differentiator between top-tier hyper-casual games and the broader market.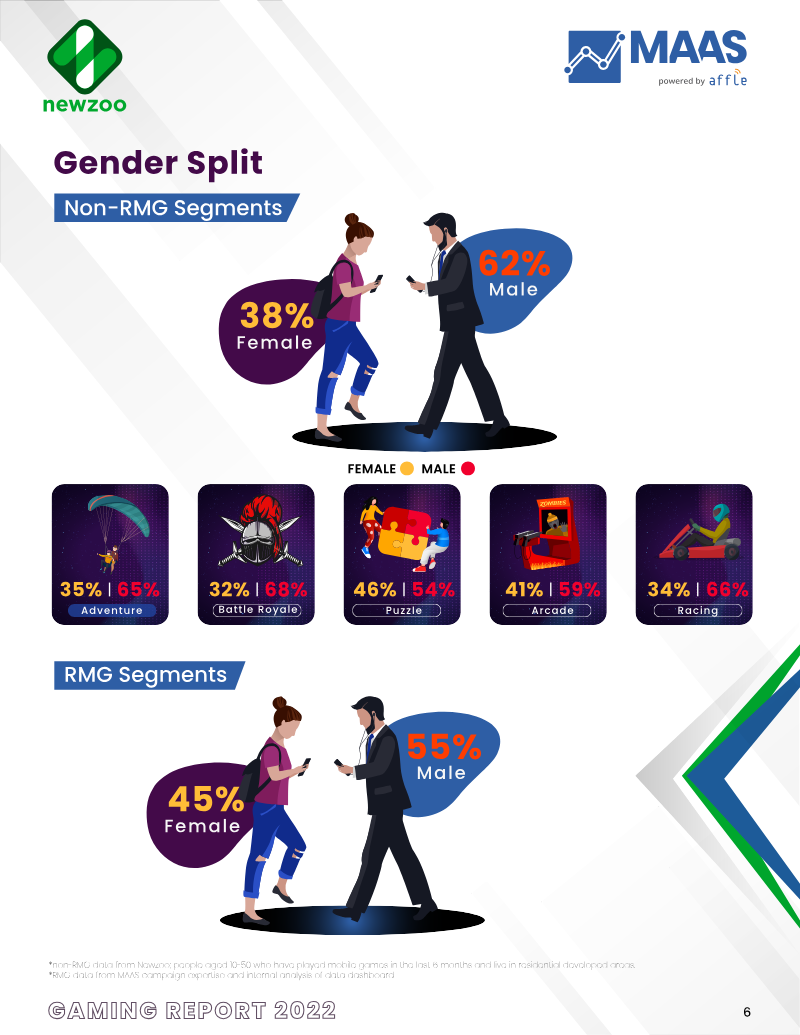
EA · 2022
ReportGames: India Plays!
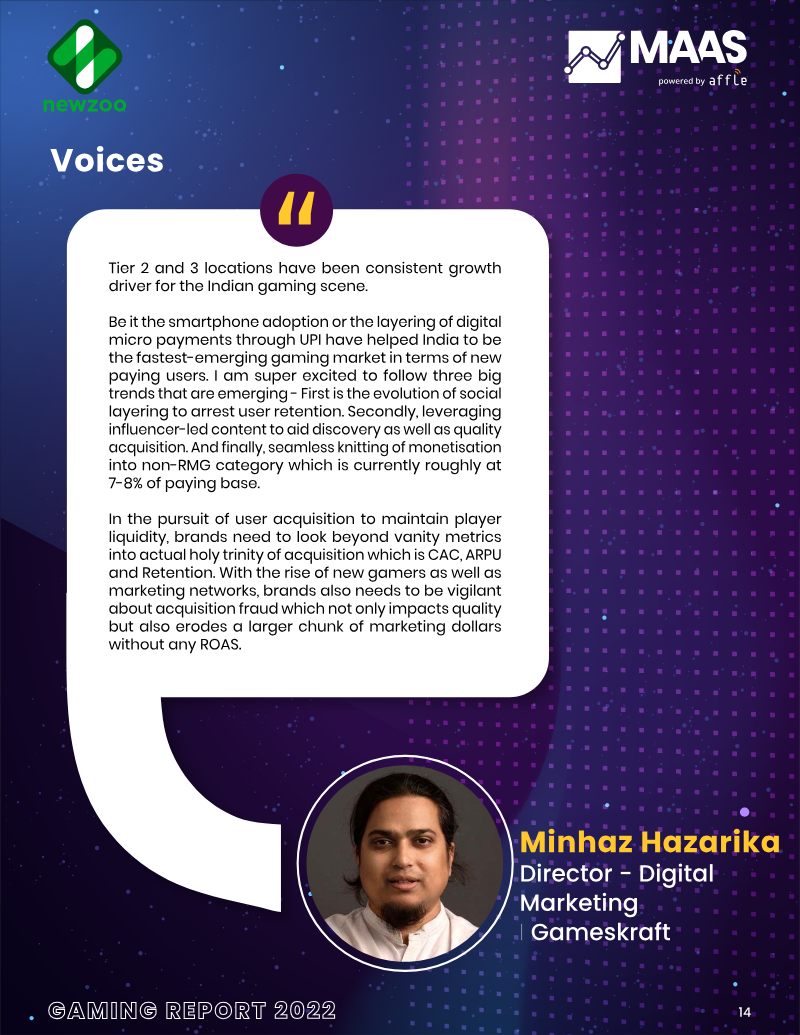
The report examines the rapidly expanding Indian mobile gaming market, highlighting a projected 91% share of online gamers playing on smartphones and an estimated revenue of US$2.2 billion in 2022, with a projected average revenue per user of US$1.5 by 2027. It distinguishes between non-real-money gaming (non-RMG) and real-money gaming (RMG), focusing on the top five non-RMG genres—Adventure, Battle Royale, Puzzle, Arcade, and Racing—and key RMG categories such as card-based games, sports-fantasy, and casual RMG. Data sourced from Newzoo consumer research and MAAS campaign analytics reveal that 62% of non-RMG players are male, while RMG users skew slightly more balanced at 55% male. Millennials and Gen-Z (ages 13–41) dominate, with 55% of adventure and battle royale players in the 13-27 bracket. Motivations differ: non-RMG gamers seek entertainment and challenge, whereas RMG players are driven by seasonal events like cricket tournaments or festive card-game gatherings. Key performance indicators for advertisers include install-to-registration rates of ~50% for casual games and ~25% for card-based RMG, with retention dropping from 30% on day one to 3% by day thirty for casual titles. The analysis underscores the importance of vernacular creatives, cross-interest programmatic targeting, and multi-channel optimization to reduce audience overlap. It also notes emerging trends—Web3 play-to-earn models, esports growth, and super-app consolidation—that signal continued market maturation. The report concludes that while monetization remains a challenge for non-RMG segments, strategic acquisition and in-game advertising innovations can unlock substantial growth across India’s diverse gaming ecosystem.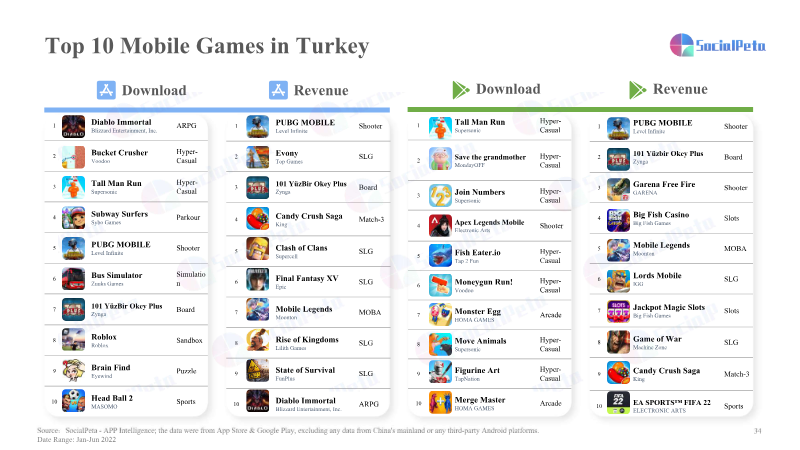
Tencent · 2022
ReportGlobal White Paper on Mobile Advertising & Marketing Game
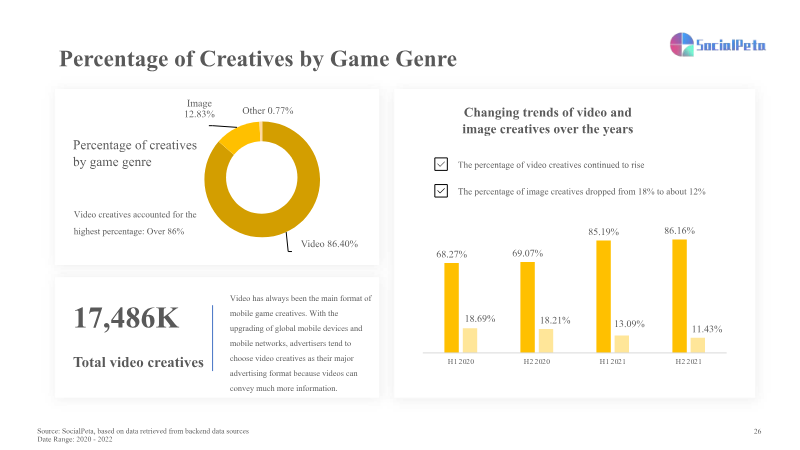
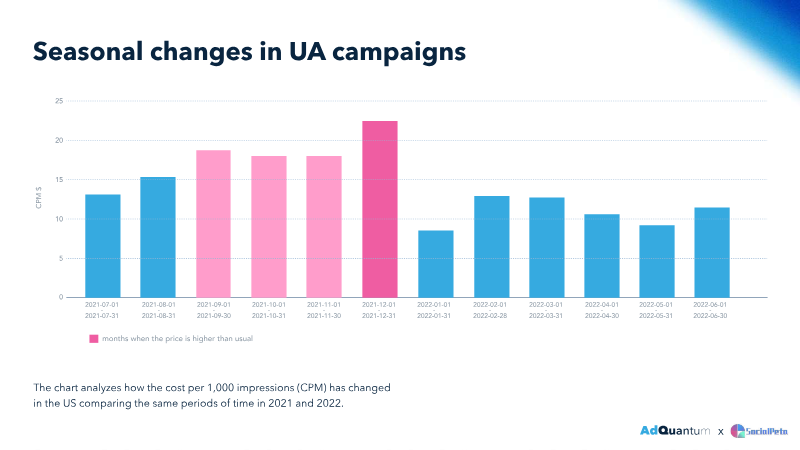
Mobile game advertising in 2022 experienced a pronounced contraction, with total creatives falling nearly 30% year-over-year to 15.8 million while the advertiser base stayed flat at 45,100. The decline stemmed from a shift toward quality-focused marketing and the impact of Apple’s IDFA changes, which pushed spend to Android. Video ads dominated the format mix (over 86% of creatives), and casual/puzzle titles captured the majority of spend, displacing RPGs in many markets. Tier 2 and Tier 3 regions saw significant growth, driven by cross-platform titles such as Genshin Impact and the rise of esports and metaverse expectations. Geographically, China’s HK/Macau/TW region maintained RPG dominance but broadened to action, casual and MOBA campaigns with large budgets. In the United States, mid-core and hardcore titles produced the most creatives despite a 10% revenue decline. Japan’s simulation games led advertising, while Korea shifted from MMOs to card-RPGs and early NFT experimentation. South Asia’s market was shooter-heavy, with casual games generating the most creatives and RPGs producing the highest volumes. Turkey’s top titles were ARPGs and shooters, with a surge in casual and parkour advertising tied to esports and influencer content. Cost dynamics varied by genre and platform: strategy games commanded the highest CPM ($21.58), while casual titles hovered around $17–$18; iOS ads were 15% costlier than Android. Female and older users (55–64) paid the highest CPMs ($22.26) and CPCs ($2.90), yet CTR increased with age across formats. Playable ads delivered the lowest CPI but weakest ROAS, whereas banner ads offered the best return on spend. Emerging channels such as social-first platforms and AR filters proved highly engaging, with Snapchat’s concise, sound-driven ads capturing attention within five seconds and AR filters generating 1.7× more immersive brand links. In India, vernacular marketing and programmatic unified platforms are expanding reach to Tier II/III audiences, while playable and rewarded video formats mitigate banner blindness. Overall, the data underscore a diversification of genre advertising, a continued emphasis on high-budget flexible media strategies, and a pivot toward video-centric, narrative-driven campaigns across high-revenue titles.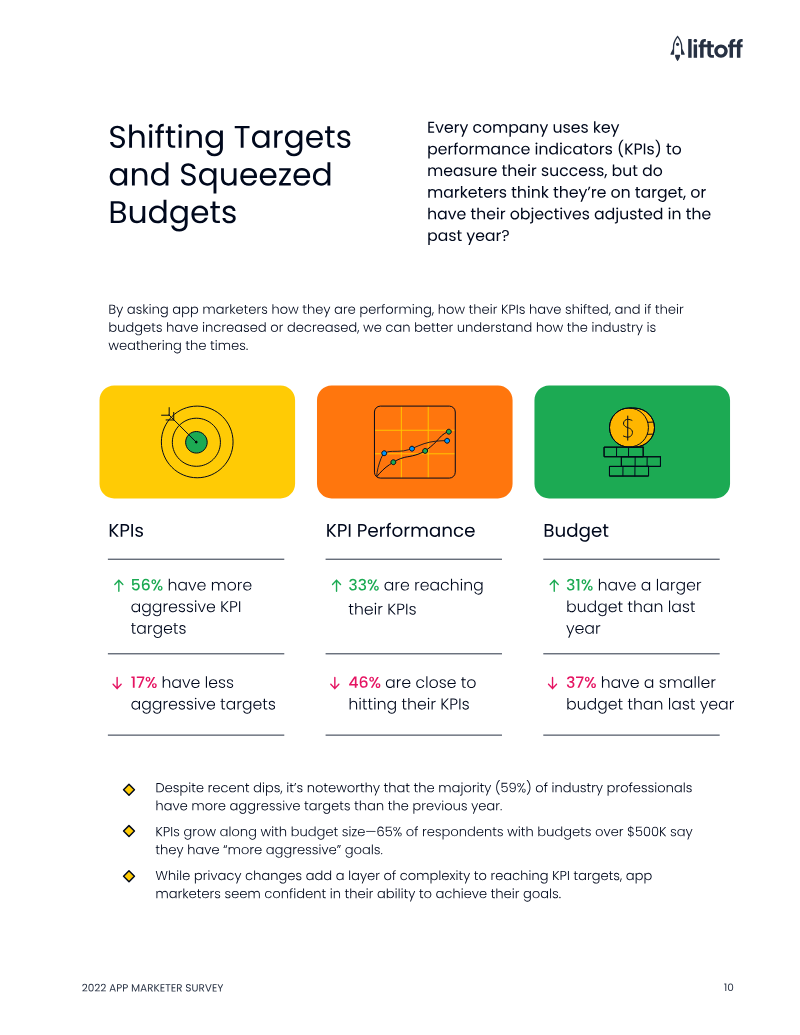
Liftoff · 2022
ReportApp Marketer Survey
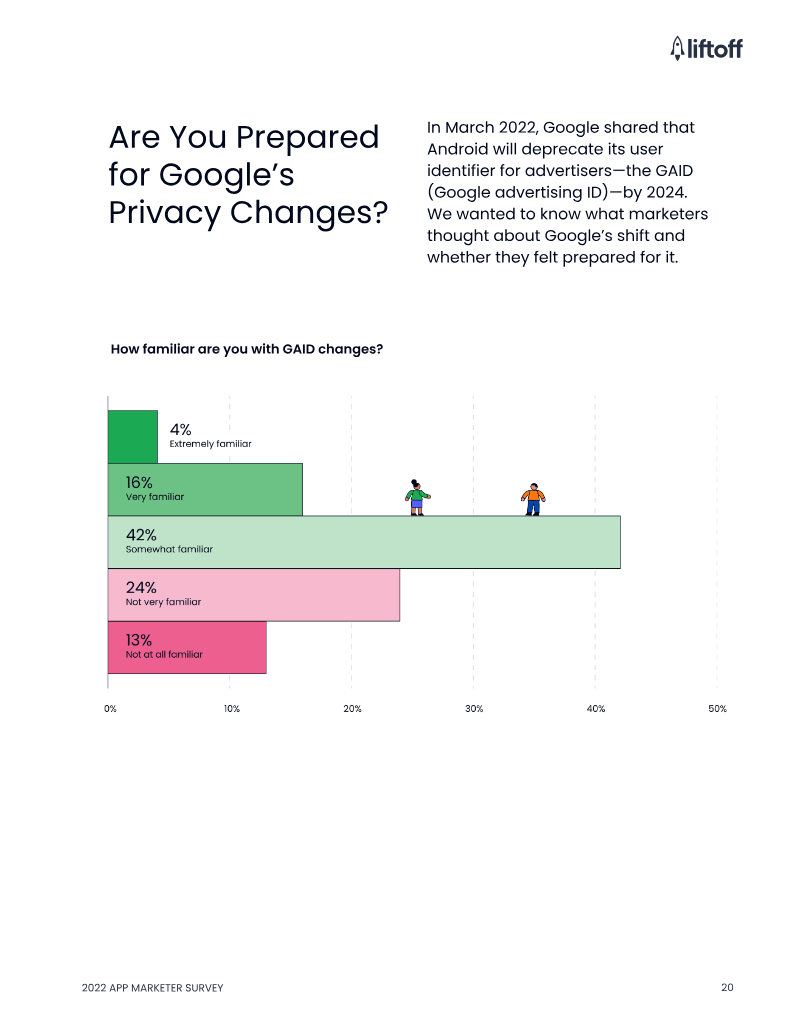
The global app marketing landscape is currently defined by a paradox of rising performance expectations and diminishing data visibility. While nearly 60% of marketing professionals face more aggressive key performance indicators than in previous years, approximately half are struggling to meet these targets. This friction is primarily driven by the implementation of Apple’s App Tracking Transparency framework, which has negatively impacted 64% of user acquisition campaigns. The resulting data scarcity has complicated decision-making for 73% of marketers and led to increased costs for 72% of respondents, forcing a heavy daily focus on manual campaign analysis to compensate for the loss of granular tracking. In response to these privacy-centric shifts, the industry is undergoing a strategic pivot toward diversification and alternative platforms. Marketers are increasingly reallocating budgets toward Android and exploring less trackable channels, with over half of professionals prioritizing influencer marketing and organic social media. Despite the challenges posed by rising costs and low familiarity with upcoming privacy updates like SKAN 4 and the deprecation of Google Advertising ID, the outlook for the sector remains growth-oriented. Fifty-two percent of marketers intend to increase their advertising spend in 2023, focusing on expanding their network of partners to navigate the post-ATT environment. This transition is supported by a global infrastructure of programmatic user acquisition and monetization tools designed to scale revenue across sectors such as gaming, finance, and e-commerce. By leveraging creator-led campaigns and advanced game data analytics, businesses across 74 countries are attempting to offset the limitations of the current privacy era. The overarching trend indicates that while privacy regulations have fundamentally disrupted traditional acquisition models, the industry is responding through increased investment and a broader, multi-channel approach to mobile growth.
ESAC – Entertainment Software Association of Canada · 2022
ReportRapport Annuel 2022 de l'ALD: Canada
The Association canadienne du logiciel de divertissement (ALD) presents an overview of its 2022 activities, emphasizing the organization’s mandate to champion the Canadian video-game sector through policy advocacy, industry research and public-relations initiatives. Central to the narrative is the 2021 economic study conducted with Nordicity, which quantifies the sector’s contribution to the national economy and underscores its resilience amid pandemic-induced disruptions. The study reveals that the industry expanded from fewer than 700 active studios in 2019 to nearly 1 000 in 2021, employing more than 32 000 full-time workers and supporting an additional 23 000 indirect jobs. Direct output now adds $5.5 billion to Canada’s gross domestic product, the highest level recorded to date. Survey participation reached a record 160-plus responses, representing over 150 studios that supplied employment and financial data. Diversity and inclusion policies are in place at more than 80% of studios with 100 or more employees, indicating a sector-wide commitment to balanced talent pipelines. Complementary efforts include a bilingual “#MyWhy” vaccination campaign that mobilized seven influencers to produce eight videos, and a newly funded guide outlining electronic-waste recycling obligations for members. Media outreach, coordinated with Hill & Knowlton Strategies, generated roughly 39 million impressions, 66 000 Twitter impressions, 11 000 Instagram impressions and 42 000 YouTube views, translating into over 1 200 hours of video consumption. Virtual engagements with federal officials covered economic impact, immigration, skills development and cultural funding, while plans are under way for an in-person “Games on the Hill” event in November 2022. Overall, the report demonstrates that despite pandemic constraints, the Canadian video-game industry has continued to grow, diversify and increase its cultural and economic influence, positioning Canada as
AdQuantum · 2022
Report