Marketing & User Acquisition
Campaigns, ad creatives, app store optimization and the cost of a player.
232 documents
SocialPeta · 2022
Whitepaper2022 Global White Paper on Mobile Advertising & Marketing Game
The global mobile market in the first half of 2022 underwent a significant transition, characterized by a contraction in total advertising volume alongside a strategic pivot toward high-quality, video-centric content. While the total number of advertisers and ad creatives declined year-over-year, emerging markets in the Middle East, South America, and Southeast Asia experienced robust growth. This period saw a sharp rise in advertising costs, with the average CPM reaching $19.31 and the United States and South Korea emerging as the most expensive regions for user acquisition. Casual and puzzle games dominated the advertising landscape by volume, yet RPGs and strategy titles commanded the highest revenue and advertising spend. A notable trend involved mid-core developers utilizing "lightweight" or drama-based video creatives to lower entry barriers for broader audiences. Video formats now constitute over 86% of all creatives, with interactive AR filters and short-form content on platforms like Snapchat and TikTok challenging the traditional dominance of Meta. In the non-gaming sector, shopping and finance apps led in advertiser activity, while reading apps produced the highest volume of individual creatives. The industry faced headwinds from Apple’s IDFA privacy changes, prompting a shift toward "motivation-based" creative strategies and localized global launches, particularly by Chinese firms seeking relief from domestic regulatory pressures. Despite rising costs and a 27% drop in creative volume, the market remains dynamic, driven by the expansion of esports, cross-platform play, and a growing consumer interest in the metaverse. Success is increasingly defined by down-funnel conversion optimization and the use of immersive, emotionally resonant storytelling to engage diverse global demographics.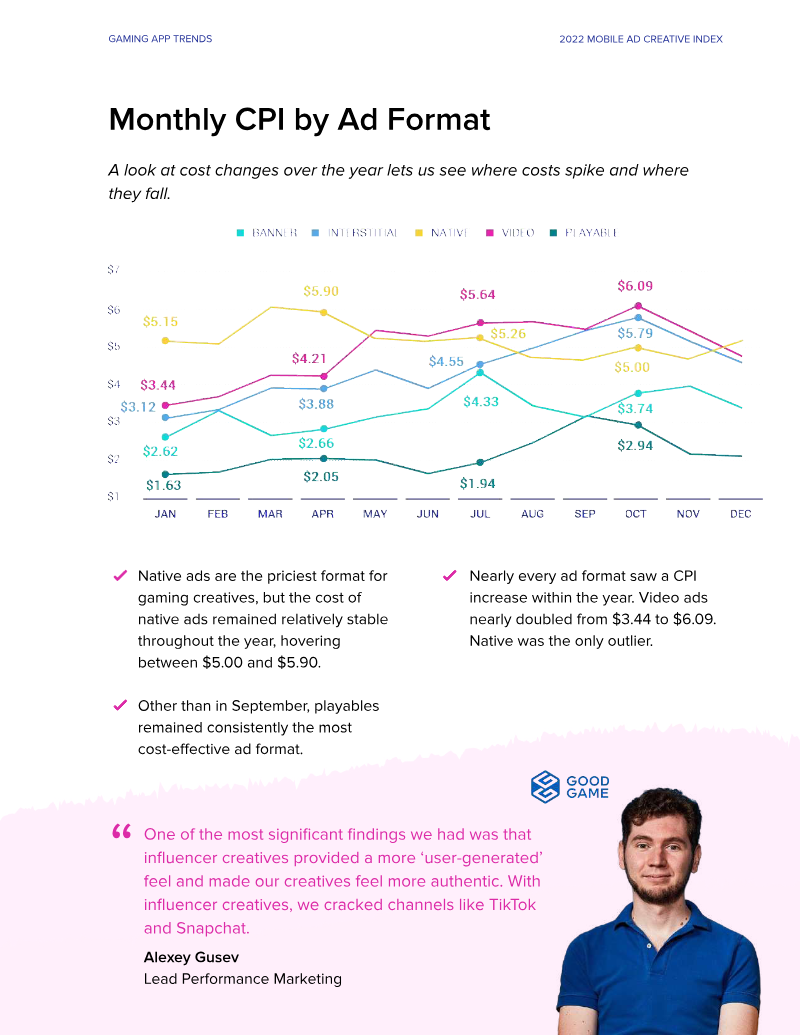


Liftoff · 2022
ReportMobile Ad Creative Index: 2022
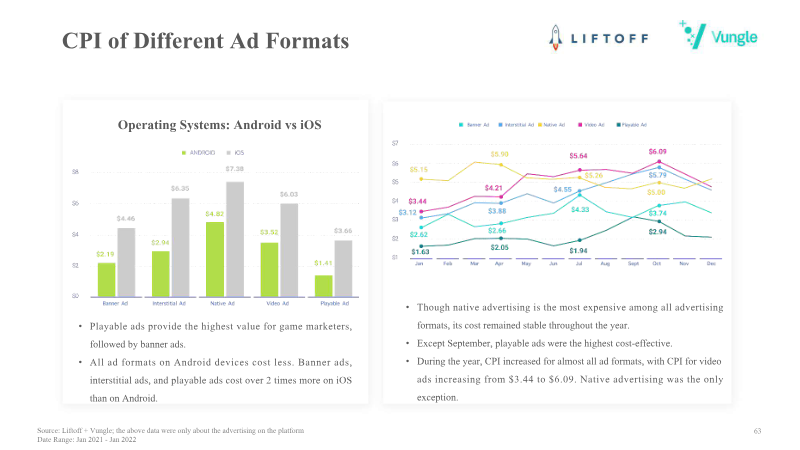
The 2022 Mobile Ad Creative Index analyzes performance trends and benchmarks across four major mobile app verticals: gaming, e-commerce, entertainment, and finance. The report focuses on the strategic importance of ad creative excellence in a privacy-first landscape following Apple’s IDFA changes. It evaluates five primary ad formats—banners, interstitials, playables, native, and video—across both iOS and Android platforms. The findings are based on a massive dataset spanning January 1, 2021, to January 1, 2022, encompassing 805 billion impressions, 12.6 billion clicks, and 200 million installs. Data points indicate that while Android remains more cost-effective, with iOS costs often doubling those of Android for the same formats, specific creative types offer distinct advantages. In gaming, playable ads provide the lowest cost-per-install (CPI) at $1.98, though banner ads deliver the highest return on ad spend (ROAS), reaching nearly 22% by day 30. In the e-commerce and finance sectors, banner ads emerge as the most value-driven format, offering the lowest CPIs and high install-to-action rates. A significant portion of the analysis, supported by GameRefinery and VisualMind technology, examines player motivations. Despite the potential of tailoring creative to specific psychological drivers like "thinking and solving" or "excitement and thrill," the data reveals a massive gap in execution: only 4% of casual game video ads and less than 1% of midcore ads successfully tap into these motivations. The conclusion emphasizes that future performance marketing success depends on "hyper-localization," interactive elements like gamification for non-gaming brands, and iterative creative testing to combat ad fatigue.
ironSource · 2022
ReportModern Mobile Consumer 2022: App Discovery Report
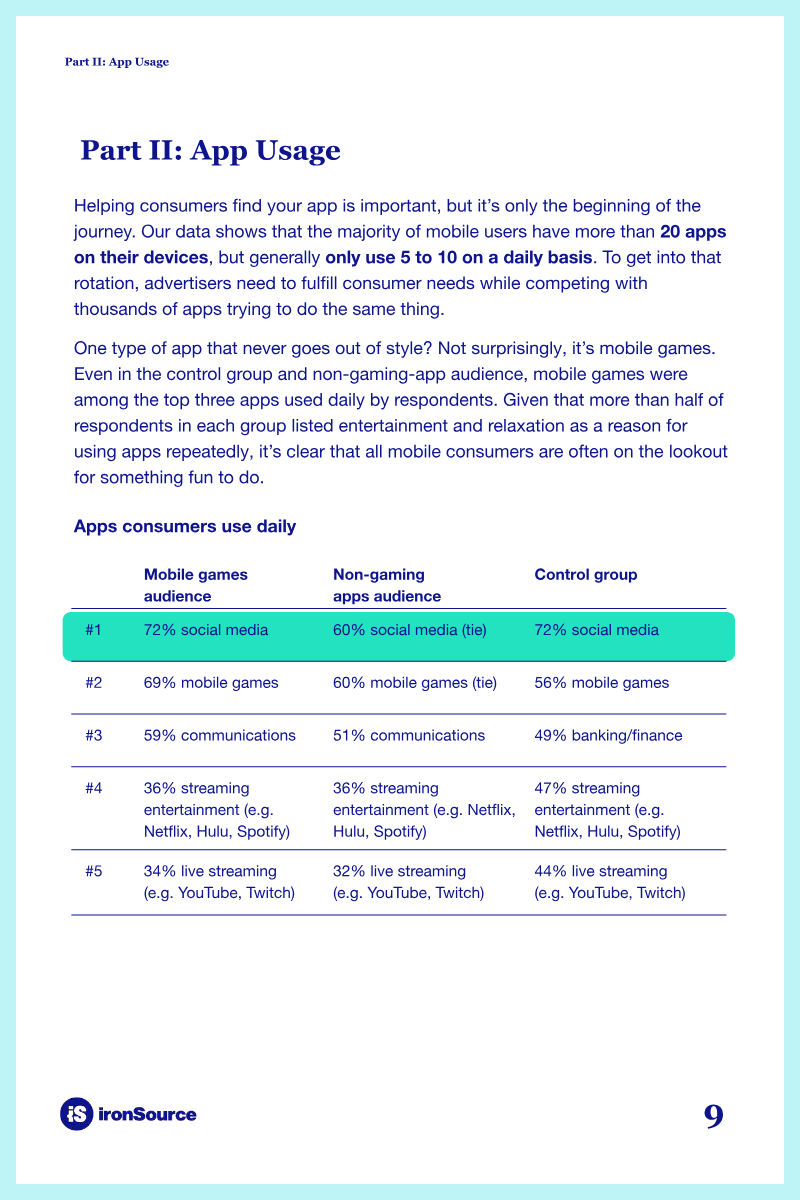
The Modern Mobile Consumer 2022: App Discovery Report examines the evolving journey of mobile users from initial app discovery to daily usage and long-term engagement. The primary thesis suggests that the traditional distinction between gamers and non-gamers is increasingly obsolete, as consumer behaviors and attitudes toward advertising are remarkably consistent across different app categories. Findings indicate that mobile gaming has become a universal hobby, with 60% of non-gaming app users playing mobile games daily, tying with social media for the top usage category. Data highlights the dominance of in-app advertising as a discovery tool, with 70% of gaming audiences and 78% of a control group reporting they have downloaded apps after seeing mobile advertisements. While most users maintain over 20 apps on their devices, the majority only engage with five to ten apps daily. To break into this limited rotation, the research suggests that video ads, app store promotions, and interactive formats are the most effective. Furthermore, rewarded ads—traditionally associated with gaming—show broad appeal, with 33% of non-gaming audiences paying more attention to ads that offer in-app incentives. The research methodology involved a large-scale survey of 30,457 respondents conducted in April and May 2022. The sample included 18,894 consumers from gaming apps and 11,563 from non-gaming apps within the ironSource network, supplemented by a 500-person third-party control group to eliminate bias. All participants were verified adults aged 18 or older. The geographic scope is global, focusing on the broader mobile app economy. Conclusions emphasize that successful user acquisition strategies must prioritize interest-based relevance, humor, and rewarded engagement to capture the attention of the modern mobile consumer.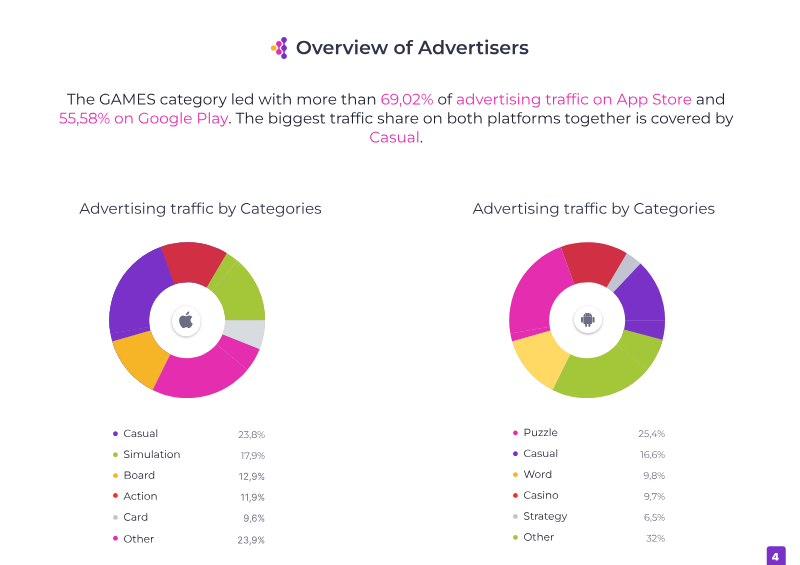
Apptica · 2022
ReportAd Intelligence: An Overview 2022
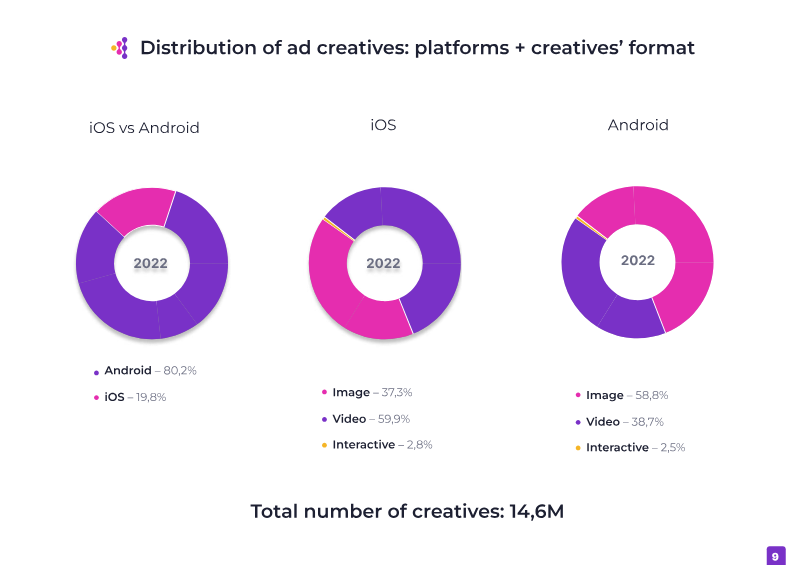
Analysis of mobile advertising intelligence from 2022 reveals a rapidly expanding market, with the number of advertisers doubling since 2019 to exceed 120,000. Data collected from 35 countries across the Apptica platform indicates a significant platform disparity, as Android accounts for 71% of advertisers and over 80% of the 14.6 million total creatives tracked during the period. While Android publishers outnumber those on iOS by a factor of two, the gaming sector remains the dominant force on both platforms, capturing 69.02% of advertising traffic on the App Store and 55.58% on Google Play. The gaming landscape is primarily led by the Casual and Puzzle genres. Casual games represent the largest traffic share on iOS at 23.8%, while Puzzles lead on Android at 25.4%. Beyond gaming, the Shopping and Social categories emerge as the other primary drivers of high-volume traffic. Top individual advertisers by traffic share include Meta Platforms, Playrix, and TikTok, while NewsBreak and ITI Inc. lead in the sheer volume of unique creatives. Methodological findings highlight distinct creative strategies between operating systems. On iOS, video is the preferred format, accounting for 59.9% of creatives. Conversely, Android relies more heavily on static images, which make up 58.8% of its ad inventory. Interactive or playable ads remain a niche but consistent segment, representing less than 3% of the total share on both platforms. The data suggests that publishers are significantly more aggressive with creative testing on Android, often running between 2 and 124 times more creative variations than they do on iOS. Playrix, Easybrain, and Tripledot Studios are identified as the most consistent market leaders, appearing in the top ten for buying share across both ecosystems.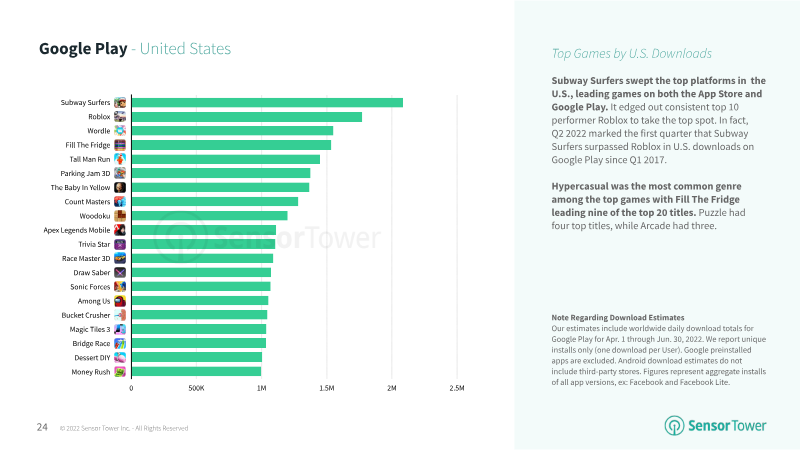
Sensor Tower · 2022
ReportStore Intelligence Data Digest: Q2 2022
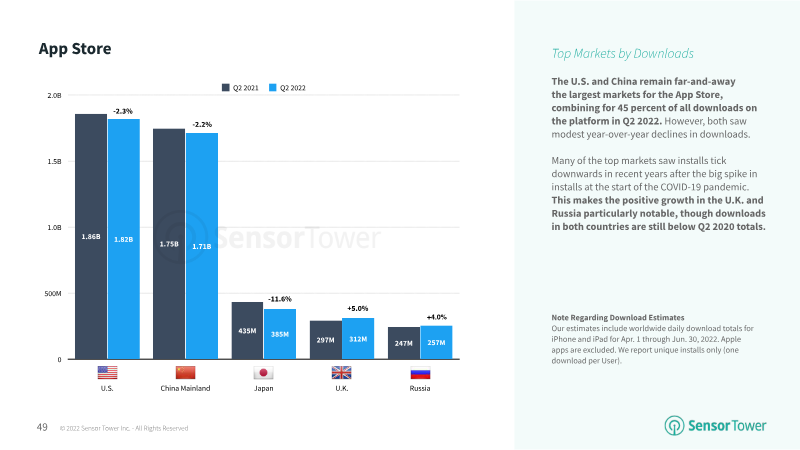
The global mobile application market experienced a pivotal transition in the second quarter of 2022, characterized by a 2.5% year-over-year decline in total downloads to 35 billion. While Google Play maintained the largest volume with 27.2 billion installs, the most significant development occurred within the United States, where consumer spending on non-gaming applications surpassed gaming revenue on the App Store for the first time. This shift was fueled by a 40% compound annual growth rate in subscriptions, with non-game subscription revenue soaring 129% above 2019 levels. This trend underscores a fundamental change in consumer behavior as 400 non-game titles generated over $1 million in quarterly revenue, signaling a maturation of the subscription economy. The gaming landscape remained highly competitive, led by the resurgence of Subway Surfers, which achieved its best performance since 2014 with over 80 million downloads. While Garena Free Fire continued its dominance on Google Play, particularly in Asia, the quarter was defined by the successful entry of mid-core titles like Apex Legends Mobile and Diablo Immortal. Regional growth was most pronounced in Indonesia, which surpassed 2 billion quarterly downloads for the first time, while the U.S. market saw a resurgence in travel and ticketing sectors as consumers returned to pre-pandemic activities. Publisher dynamics remained concentrated among established giants, with Meta and Google maintaining their global leadership. Meta saw an 11% year-over-year increase in downloads, driven by its ownership of four of the top five most-installed apps worldwide. The industry also witnessed significant consolidation and strategic shifts, notably Take-Two Interactive’s rise to the top of the U.S. gaming market following its acquisition of Zynga, and Miniclip’s acquisition of the Subway Surfers franchise. These movements, combined with the rising influence of domestic publishers in China and the U.S., illustrate a market balancing global scale with localized dominance.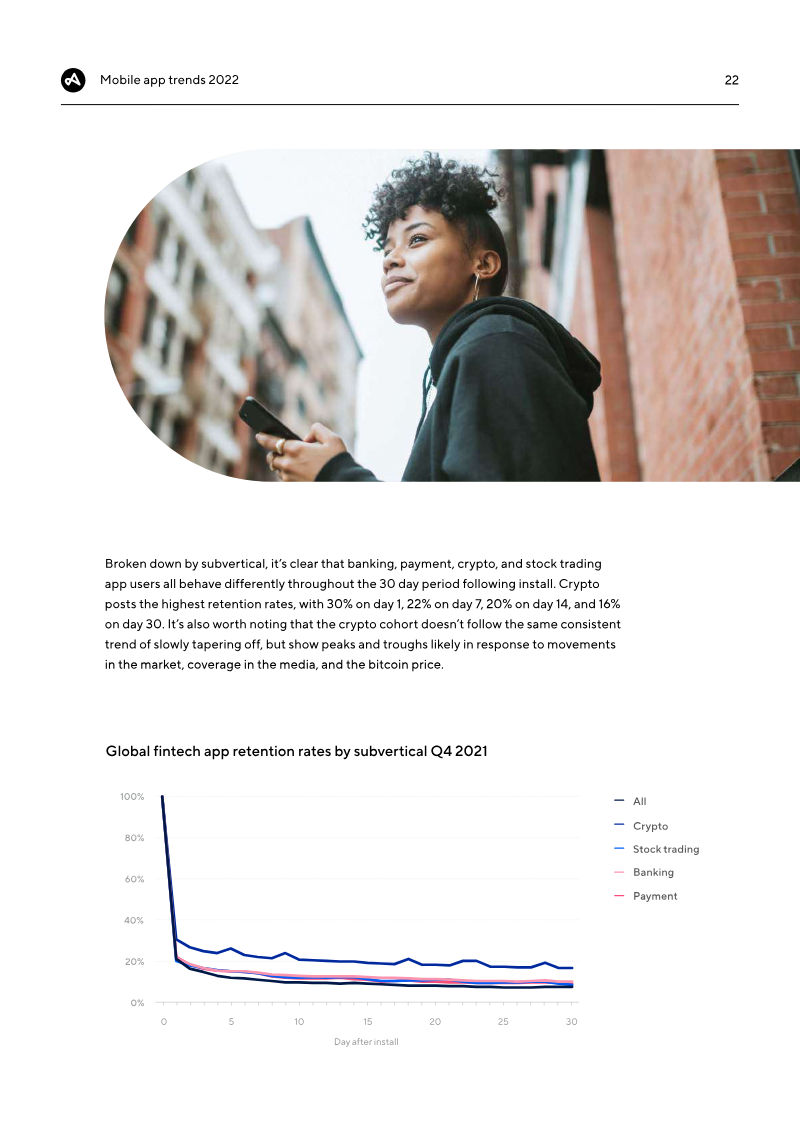

Adjust · 2022
ReportMobile App Trends 2022
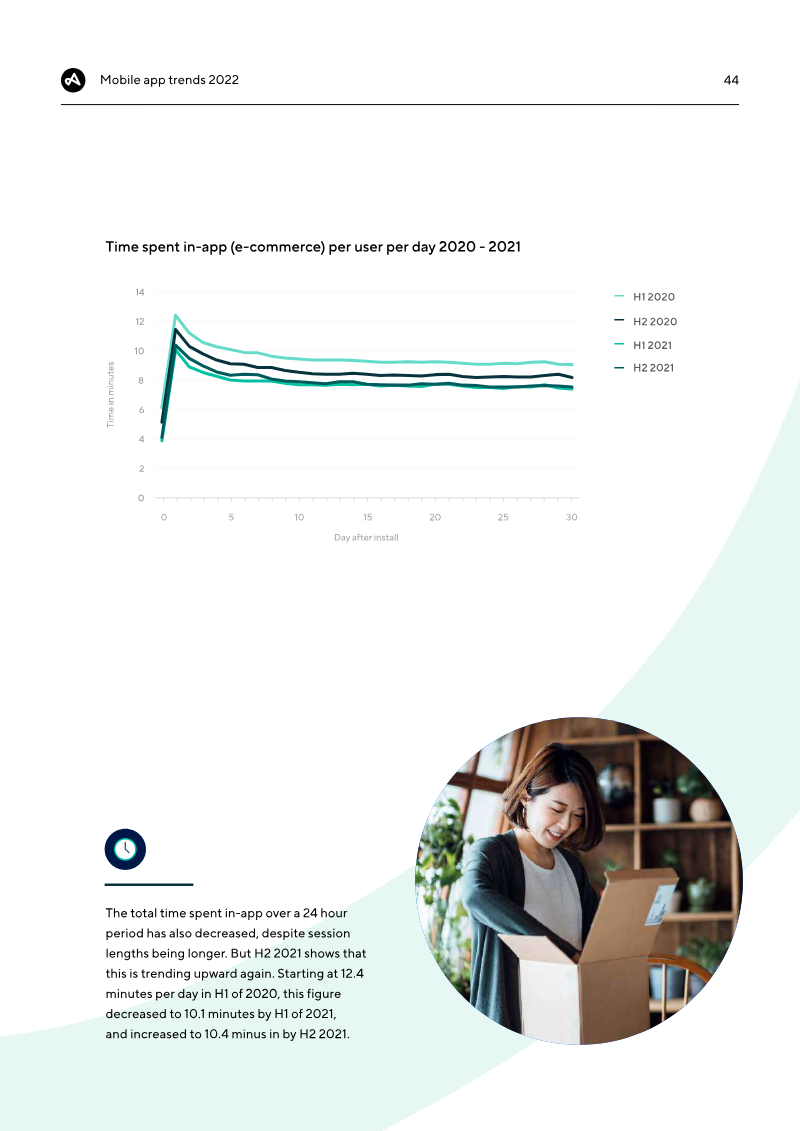
The mobile app industry experienced a period of robust expansion throughout 2021, characterized by $170 billion in consumer spending and $288 billion in advertising expenditures. Despite the implementation of Apple’s App Tracking Transparency framework, the sector demonstrated unexpected resilience as global opt-in rates reached 25%, significantly outperforming initial industry forecasts. This growth was distributed across several key verticals, with fintech and gaming leading the surge in installs at 35% and 32% respectively, while e-commerce maintained steady upward momentum with a 12% increase in downloads. Fintech emerged as a primary driver of engagement, particularly within the asset management and cryptocurrency subverticals. While traditional banking and payment apps maintained the highest share of installs, crypto apps achieved record session lengths exceeding 15 minutes. This heightened engagement occurred alongside a sharp rise in acquisition costs, with effective cost-per-install (eCPI) for fintech apps more than tripling. Consequently, developers are increasingly pivoting toward subscription-based models to ensure long-term profitability and offset the rising price of user acquisition. The e-commerce and gaming sectors mirrored this trend of higher costs paired with increased user value. Although e-commerce retention rates saw a slight decline, total in-app revenue jumped by 46%, driven by longer session durations in marketplace apps. Similarly, the gaming industry saw hyper-casual titles dominate download volumes while adventure and strategy games secured deeper engagement. Across all sectors, the transition toward higher-quality user bases is evident; while it is becoming more expensive to acquire users, those who remain are spending more time and money within apps, making retention and lifetime value the critical metrics for sustained success in a maturing mobile market.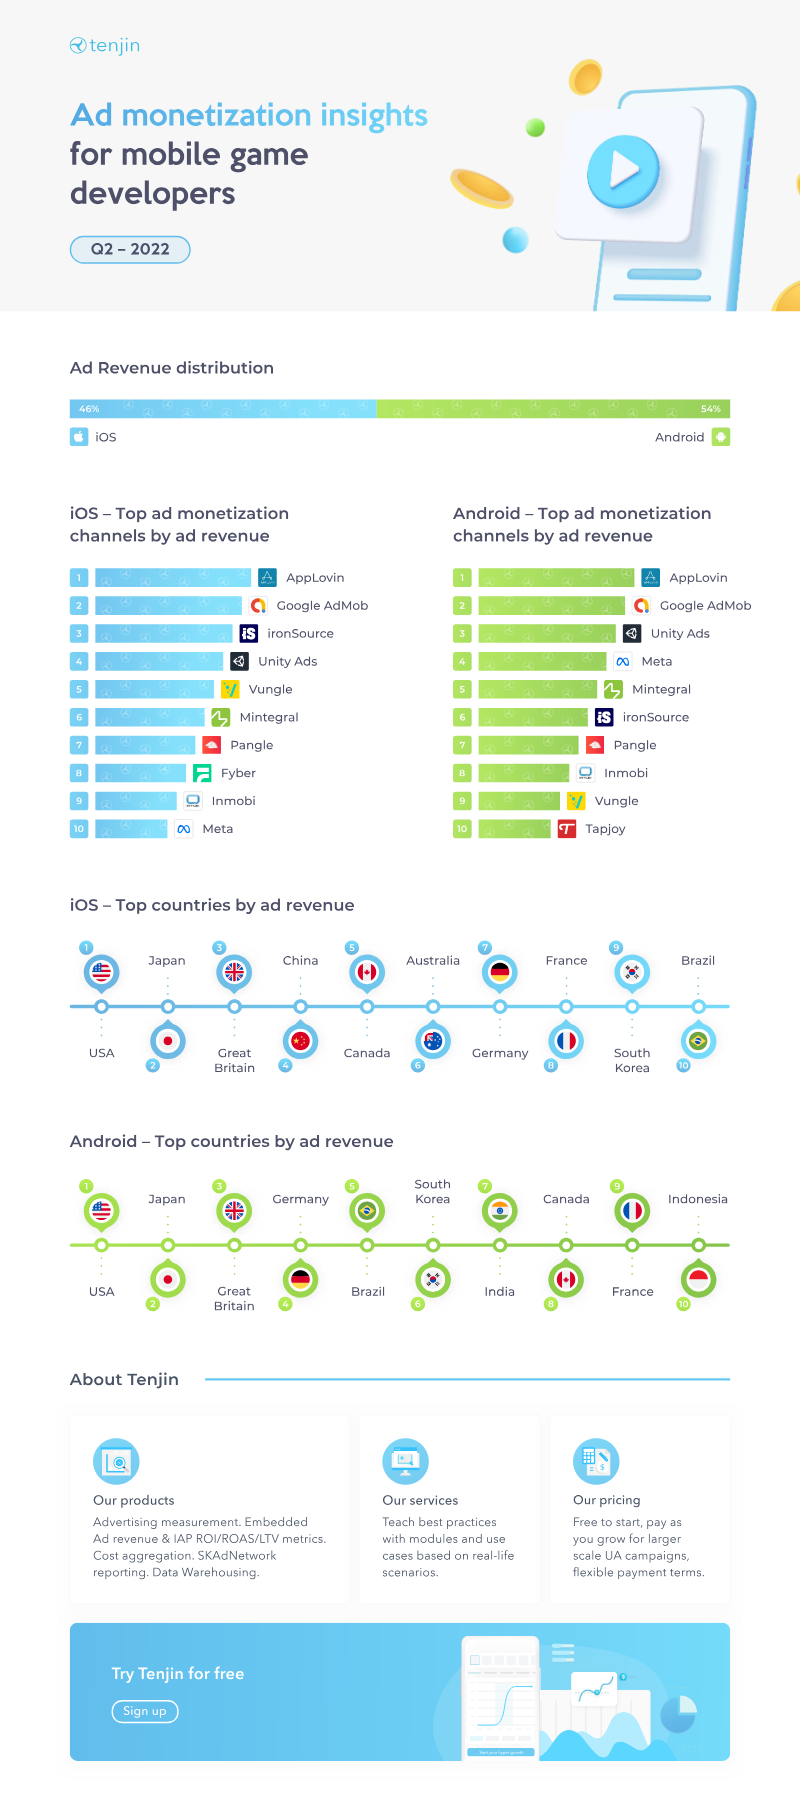
Tenjin · 2022
ReportAd Monetization Insights for Mobile Game Developers 2022
The 2022 ad monetization briefing delivers a data-driven overview of revenue-generation strategies for mobile game developers, emphasizing measurement, optimization, and regional performance trends. Core insights reveal that ad-based income accounts for a majority share of total monetization, with a highlighted 54% figure indicating the proportion of revenue derived from advertising across the surveyed markets. The analysis spotlights key territories—Germany, Japan, South Korea, Canada, and Indonesia—illustrating how each region contributes to overall earnings and how localized user acquisition (UA) campaigns influence cost structures and return on ad spend. A central theme is the importance of precise analytics to drive return on investment (ROI), return on ad spend (ROAS), and lifetime value (LTV) calculations. The briefing outlines a suite of measurement tools that aggregate ad revenue, in-app purchase (IAP) data, and cost metrics, integrating SKAdNetwork reporting for iOS environments and offering flexible data-warehousing solutions. These capabilities enable developers to assess campaign performance at scale, compare cost aggregation across organic and paid acquisition channels, and refine budgeting decisions based on real-time insights. Tenjin’s platform is positioned as a turnkey solution for developers seeking to embed advanced measurement modules without upfront cost, operating on a free-to-start, pay-as-you-grow pricing model. The service package includes advertising measurement, cost aggregation, and data-warehousing, designed to support both emerging studios and larger publishers in optimizing ad revenue streams. While specific methodological details such as sample size or data sources are not disclosed, the briefing draws on 2022 market data to inform best-practice recommendations for maximizing monetization efficiency across the highlighted global regions.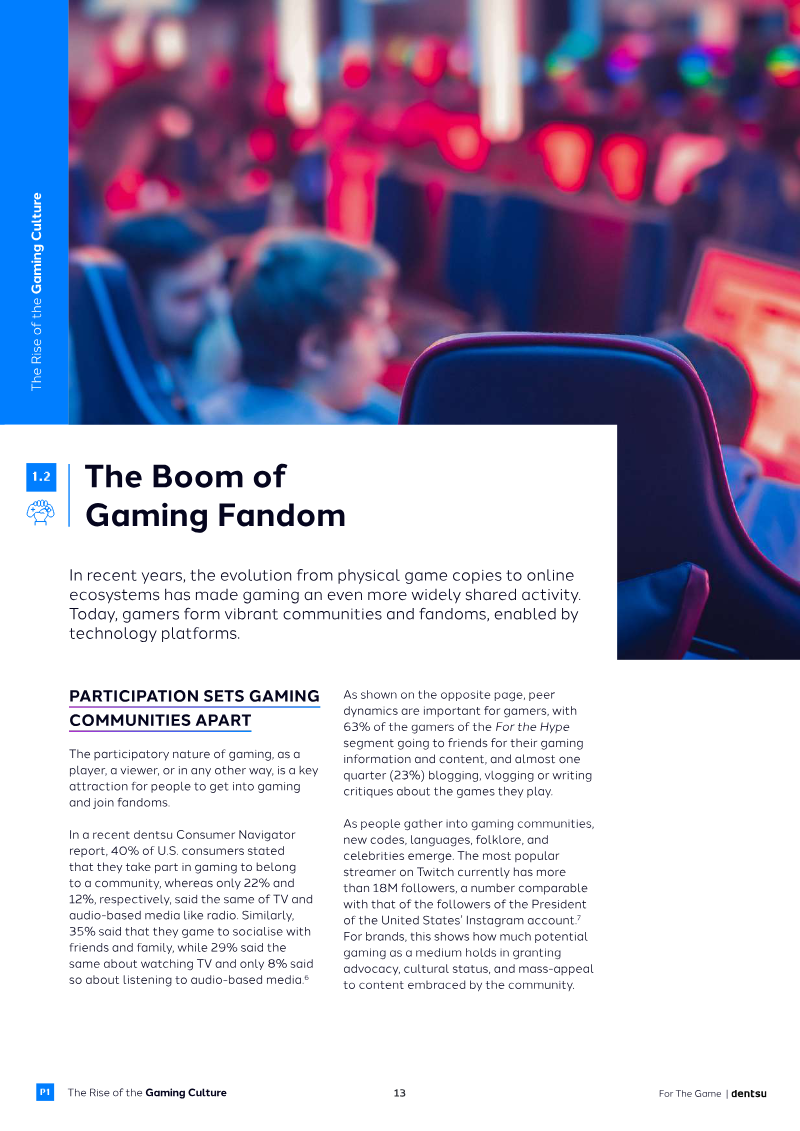

dentsu · 2022
ReportFor the Game
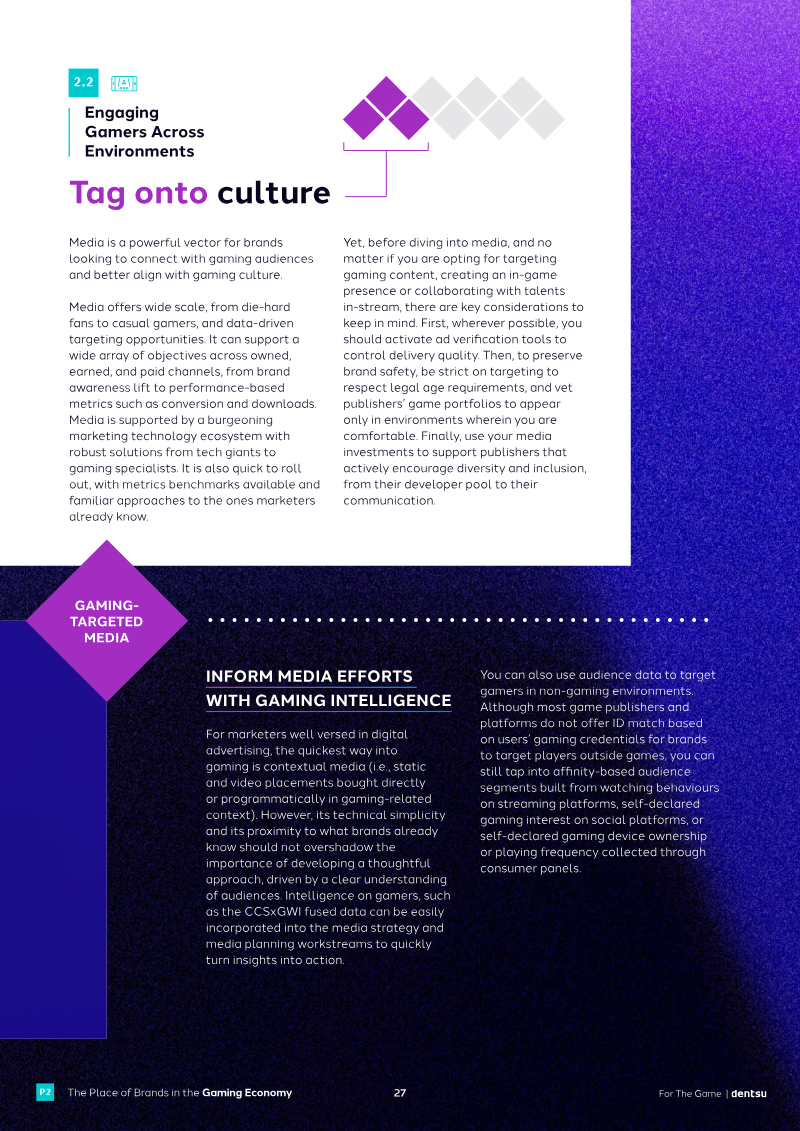
The global gaming industry is undergoing a transformative shift into a primary mass medium, projected to reach 3.5 billion players and $225 billion in revenue by 2025. This evolution is characterized by gaming’s role as a central pillar of culture and social connection, with over a third of players utilizing the medium specifically for socialization. Analysis across 21 global markets reveals that gamers are highly engaged "super-consumers" who spend nearly 60 hours a week across television and internet platforms, making them a critical demographic for brand attention. To effectively reach this audience, the industry must move beyond traditional demographic stereotypes and adopt a motivation-based segmentation. This approach identifies six distinct player types, allowing for more authentic engagement. However, a significant gap remains between the diverse player base and the industry’s internal demographics, which remain predominantly male and white. Prioritizing equity, inclusion, and accessibility is essential for future growth, as evidenced by the commercial success of titles that prioritize inclusive design and representation. Successful brand integration requires a departure from standard advertising in favor of intrinsic in-game experiences and value-driven partnerships. Strategies such as gamified commerce, immersive virtual events, and the utilization of original intellectual property yield higher attention and recall rates than traditional social media formats. By fostering mutually beneficial relationships and respecting established gaming codes, brands can leverage the medium not just for visibility, but as a sophisticated tool for long-term community building and commercial innovation.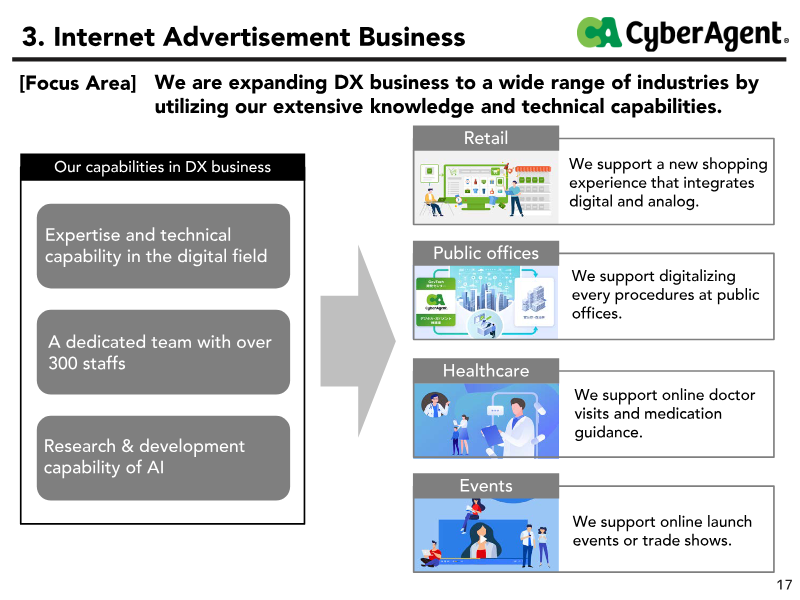
CyberAgent · 2021
PresentationFY2021 Presentation Material
CyberAgent achieved record-breaking financial performance in fiscal year 2021, characterized by consolidated sales of 666.4 billion yen and a more than threefold increase in operating profit to 104.3 billion yen. This surge was primarily catalyzed by the Game business, which experienced 68.6% year-over-year growth following the massive commercial success of Uma Musume Pretty Derby. While the Game segment provided the most significant profit contribution, the Internet Advertisement business maintained steady double-digit growth, and the Media segment narrowed its operating losses through the expansion of ABEMA and the WINTICKET betting platform. The strategic focus for the period centered on leveraging high-performing assets to fund long-term growth initiatives. WINTICKET emerged as a critical driver within the Media segment, capturing 25% of the Keirin online betting market and tripling its transaction volume. Simultaneously, the company utilized profits from its established advertising and gaming pillars to invest in ABEMA’s digital transformation and content offerings, including pay-per-view services. This diversification strategy aims to stabilize the inherent volatility of the gaming industry, which led to the omission of specific earnings forecasts for the upcoming fiscal year. Future growth is predicated on a robust pipeline of high-profile intellectual properties and strategic partnerships with industry leaders such as Nintendo, SEGA, and Bandai Namco. Upcoming releases, including titles based on the Final Fantasy VII and Jujutsu Kaisen franchises, are expected to sustain the momentum established in 2021. By aligning its corporate purpose with digital innovation and cross-media expansion, the organization seeks to transition from a gaming-heavy profit structure toward a more balanced ecosystem where media and advertising provide consistent, long-term value.

CyberAgent · 2021
Presentation3Q FY2021 Presentation Material: April to June 2021
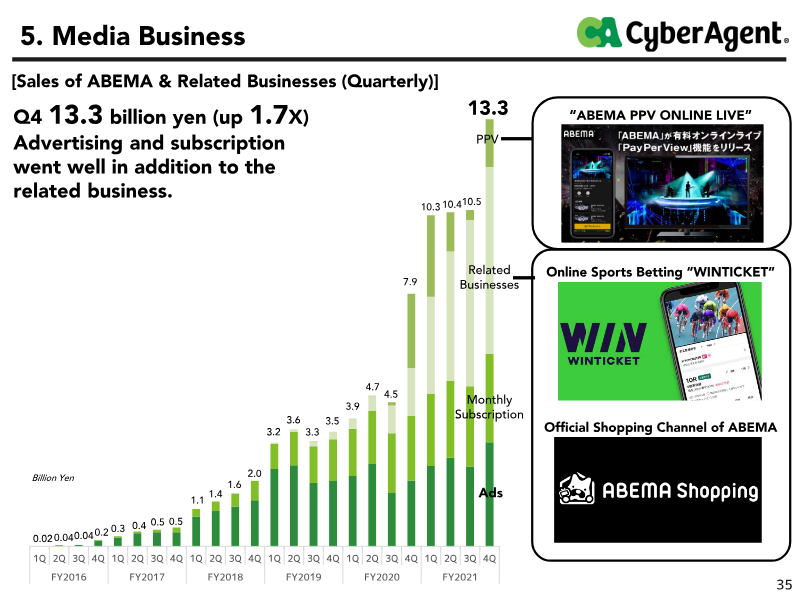
CyberAgent experienced exceptional financial growth during the third quarter of fiscal year 2021, covering the period from April to June. Consolidated sales reached 192.2 billion yen, representing a 70.3% year-over-year increase, while operating profit surged more than fivefold to 44.5 billion yen. This performance was primarily catalyzed by the Game business, specifically the massive commercial success of Uma Musume Pretty Derby. The title surpassed nine million downloads within five months of its launch, driving segment sales up by 151.7% and operating profit by over 480%. The success of this intellectual property has further expanded into a multi-media franchise encompassing anime, music, and live events, prompting an upward revision of full-year forecasts to 650 billion yen in sales and 100 billion yen in operating profit. The media segment, led by the streaming platform ABEMA, also demonstrated significant momentum with quarterly sales more than doubling to 10.5 billion yen. Weekly Active Users reached a peak of 14.9 million, supported by high-profile sports broadcasting and original content. A critical component of this segment's monetization strategy is the WINTICKET online betting service, which saw transaction volumes grow 5.5 times year-over-year to 39.3 billion yen through strategic integration with ABEMA’s programming. Beyond current hits, the strategic focus remains on technological innovation and pipeline development. The advertising business reported high adoption rates for AI-driven creative tools, while the gaming division is preparing for future growth with high-profile upcoming titles based on the Final Fantasy VII and Jujutsu Kaisen franchises. These results indicate a robust diversification strategy where high-performing gaming assets and integrated media services drive record-breaking financial outcomes across the Japanese market.
CyberAgent · 2021
Presentation2Q FY2021 Presentation Material: January to March 2021
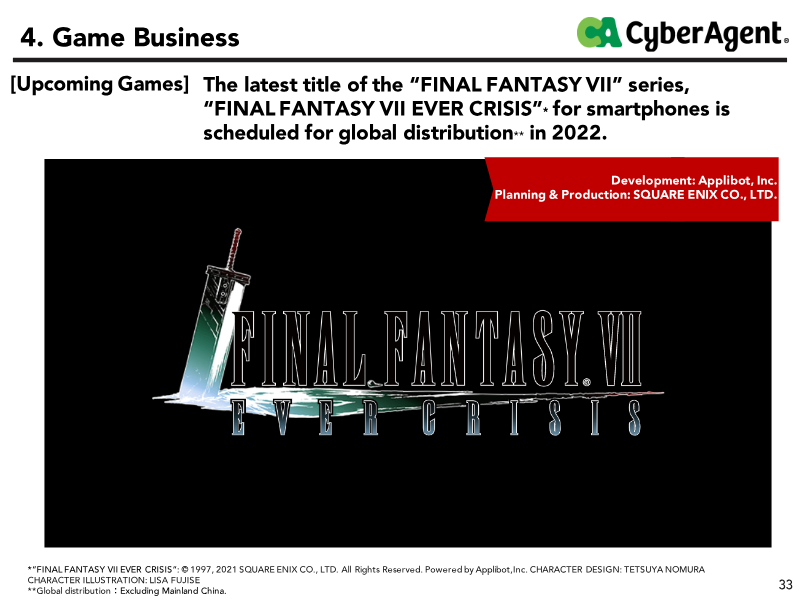
CyberAgent experienced exceptional financial growth during the second quarter of fiscal year 2021, characterized by a 26.6% year-over-year increase in consolidated sales to 163.4 billion yen and a doubling of operating profit to 25.8 billion yen. This performance was primarily catalyzed by the Game business, which achieved record-high quarterly sales of 63.9 billion yen. The massive success of Uma Musume Pretty Derby, which secured over five million downloads within its first 45 days, served as the primary engine for this expansion. Coupled with the strong performance of titles like NieR Re[in]carnation and a robust pipeline including Final Fantasy VII Ever Crisis, the company significantly upgraded its full-year forecasts, raising sales targets to 600 billion yen and nearly doubling its projected operating profit range. The media segment, centered on the ABEMA platform, demonstrated significant scale despite ongoing operating losses of 3.4 billion yen. Sales for the segment grew 1.4 times year-over-year, reaching 19.8 billion yen, bolstered by the rapid expansion of the online betting service WINTICKET. Transaction volumes for WINTICKET surged 9.1 times annually to 31.9 billion yen, highlighting a successful diversification of revenue streams beyond traditional advertising. Weekly active users remained stable at approximately 12 million, supported by a strategic mix of original dramas, variety content, and anime. To sustain this momentum, the organization is prioritizing digital transformation and cross-media strategies. The Internet Advertisement business reached record-high performance levels, while ABEMA is undergoing a comprehensive user interface redesign to better integrate linear and on-demand viewing. These initiatives, combined with AI-driven operational efficiencies, aim to transition the media segment toward long-term monetization while maintaining the high-growth trajectory established by the gaming and advertising divisions within the Japanese market.

European Parliament · 2021
Report