Skip to main content
Game Industry
Library
Library
Search
Ask AI
News
Connect your AI
Browse
The Catch Up
Topics
Collections
Writers
Help
Subscribe
Game Industry
Library
Library
Search
Ask AI
Saved
Library
161 reports matching your filters
All Types
Reports
Articles
Presentations
Whitepapers
Financial
Legal
Other
Search
Player Behavior
Market Analysis
Global
Monetization
PC
Mobile
Player Demographics
Steam
Game Design
Marketing
Retention
Game Development
Console
Europe
Streaming
North America
USA
Game Publishing
Clear
Filters
1
Player Behavior
Recently added
Newest first
Oldest first
Title A–Z
Title Z–A
Report
88 pages
Gaming and Esports in Vietnam: A New Arena for Brands
Vietnam has the world's highest adult gamer rate at 85%, with a demographic where 70% of the population is under 25 and one-third of citizens are engaged in esports.
Mobile gaming dominates the market, supported by high smartphone penetration and 4G coverage, with gamers typically spending 1–3 hours per session.
Influencer marketing is highly effective, as 51% of gamers trust key opinion leader (KOL) recommendations and 42% report purchasing products endorsed by them.
Market Analysis
Esports
Marketing
+3
Decision Lab
Feb 2026
Report
19 pages
Southeast Asia Gaming Consumer Economy
The Southeast Asian gaming population is projected to reach 367.8 million by 2025, with Indonesia, Malaysia, the Philippines, Singapore, Thailand, and Vietnam accounting for 85% of the total regional gamer base.
Mobile gaming is the dominant market force, generating 70% of in-game revenue and achieving a 13.7% CAGR in consumer spending between 2018 and 2021, reaching a total of US$5.57 billion.
Monetization is heavily reliant on free-to-play models with in-app purchases, which account for 86% of total revenue, though hybrid and subscription models are increasingly utilized.
Market Analysis
Player Demographics
Player Behavior
+2
Telekom Malaysia
Feb 2026
Report
9 pages
Mobile App User Trends: MENA Ramadan 2026
Overall mobile app engagement in the MENA region during Ramadan 2026 increased by 111% compared to the same period in 2025.
In-app purchase volume saw a significant surge, rising by 91% during the 30-day Ramadan period.
Social media interaction, measured by likes, shares, and comments, grew by 63% compared to the previous year.
Market Analysis
Player Behavior
Mobile
+2
InvestGame
Jan 2026
Report
8 pages
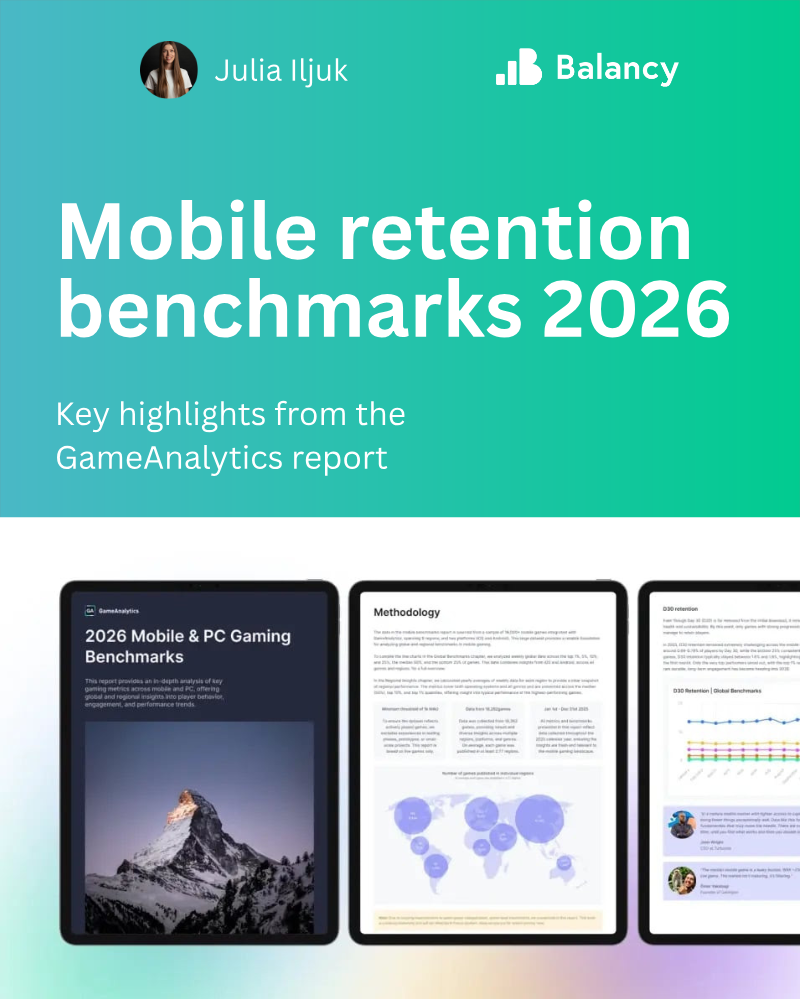
Mobile & PC Gaming Benchmarks 2026
Industry-wide retention benchmarks have shifted downward to a 35/15/5 standard for Day 1, Day 7, and Day 30, replacing the historical 40/20/10 model.
Median retention rates in 2026 are currently 22% for Day 1, 4% for Day 7, and 0.7% for Day 30, highlighting a significant struggle to maintain long-term player interest.
A widening performance gap exists between average titles and the top 10% of games, with top-tier titles maintaining a 40% Day 1 retention threshold compared to the 22% median.
Mobile
Retention
PC
+2
GameAnalytics
Jan 2026
Report
45 pages
Why Chance-Based Mechanics Keep Us Hooked
Monopoly GO! generates $100 million to $125 million in monthly revenue by utilizing a 'saw-tooth' gameplay loop that alternates between resource depletion and sudden, event-driven recovery.
Player engagement is driven by the dopamine release associated with the anticipation of rewards rather than the intrinsic value of the prizes themselves.
Developers manipulate game probabilities to prioritize emotional impact over mathematical fairness, such as limiting low-tier prize outcomes to as little as 13%.
Monetization
Player Behavior
Game Design
+1
Sensor Tower
Jan 2026
Report
66 pages
State of India Mobile App Market 2026 Report
India remains the world’s largest mobile app market by volume with 25 billion annual downloads, shifting focus from user acquisition to habit-driven engagement and monetization.
In-app purchase revenue is projected to reach $1.25 billion by 2026, driven increasingly by non-gaming sectors like Utilities, Media, and Generative AI.
Quick commerce and food delivery platforms have seen a 55% year-over-year increase in engagement as they transition toward retention-led strategies.
Market Analysis
Player Behavior
Mobile
+1
Sensor Tower
Jan 2026
Report
25 pages
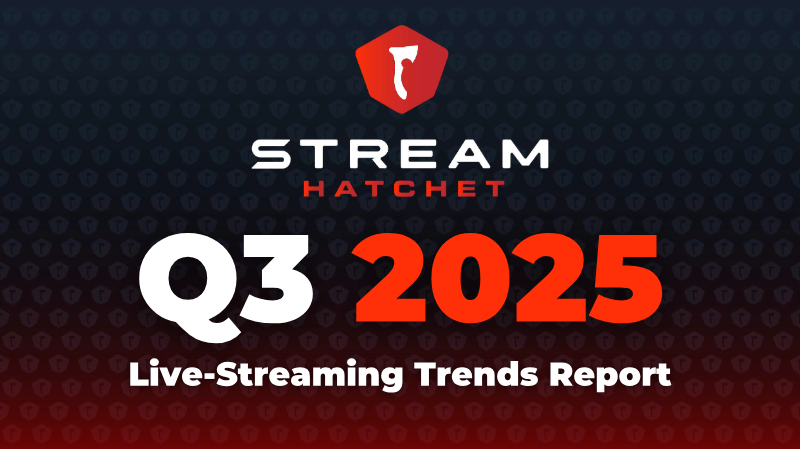
Live Streaming Basics: A Comprehensive Introduction
TikTok Live has emerged as a dominant market force with 9.1 billion hours watched, causing Twitch’s market share to drop below 50% for the first time.
Total global live-streaming viewership reached 9.6 billion hours in Q3 2025, marking a 13% year-over-year increase.
Non-gaming content is now the primary driver of viewership with 1.7 billion hours watched, while massive live events like 'La Velada del Año V' set new records with 9.2 million peak concurrent viewers.
Streaming
Market Analysis
Player Behavior
Stream Hatchet
Oct 2025
Report
133 pages
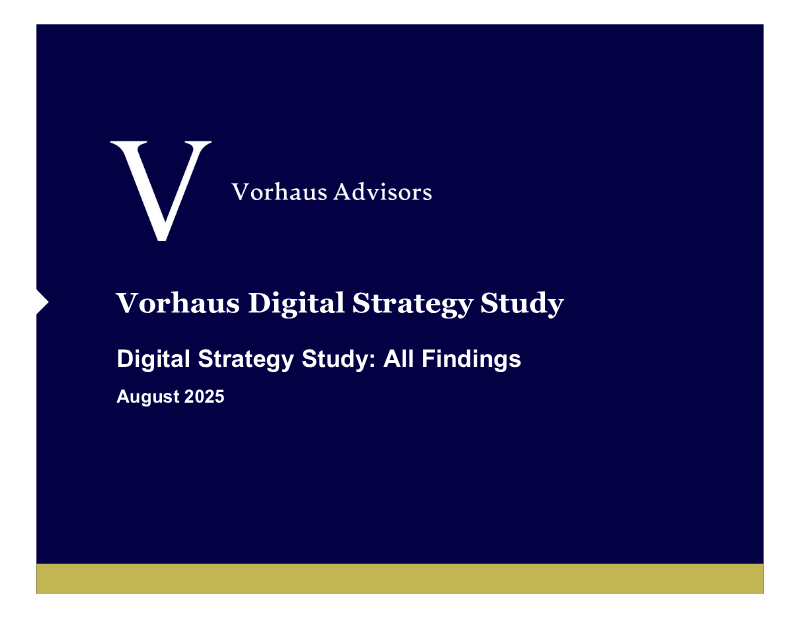
Vorhaus Digital Strategy Study: All Findings 2025
Digital-first entertainment has become the US standard, with smart TV penetration at 63% and connected devices officially surpassing traditional broadcast media.
Gaming is now a near-universal activity with 80% of the population participating, driven by daily mobile play and a significant rise in total annual in-game spending.
Consumers are adopting 'subscription cycling' to manage costs, despite the average household maintaining 3.5 video services and younger consumers (18–34) increasing annual digital media spending by $235.
Market Analysis
Player Behavior
Mobile
+1
Vorhaus Advisors
Aug 2025
Report
31 pages
Les Français et le jeu vidéo: 2025
The French video game market has reached 40.2 million players, representing 66% of the national population with an average player age of 40.
Social and multiplayer gaming are primary engagement drivers, with 86% of players using multiplayer modes and 60% reporting the formation of direct friendships through gaming.
Gender parity is a defining characteristic of the market, with women now comprising a 55% majority of players in the 16–30 age demographic.
Market Analysis
Player Demographics
France
+1
SELL – Syndicat des Éditeurs de Logiciels de Loisirs
Jul 2025
Report
8 pages
Tower Defense Games - Industry Snapshot
Top-tier Tower Defense games achieve a 3.83% conversion rate and an ARPDAU of $1.66, significantly outperforming Idlers, Platformers, and Board Games.
The genre sustains a highly committed player base with an Average Revenue Per Paying User (ARPPU) of $83 and an average daily playtime of 130 minutes.
China is the most lucrative market for the genre, reaching a conversion rate of 8.7%, while France leads in engagement with 210 minutes of daily playtime.
Market Analysis
Player Behavior
Tower Defense
+2
GameAnalytics
Jan 2025
Report
37 pages
UK Interactive Entertainment Japan Market Report 2025
Japan generates 9.1% of global game revenue from only 2.2% of the global player base, with an average per-player spend of $223 compared to $145 in the UK.
The PC and console segment, excluding mobile and Nintendo platforms, represents a $2.5–3.0 billion market opportunity for developers.
PC gaming revenue in Japan grew 16.2% year-over-year in 2024, significantly outpacing the 4.4% global growth rate, though this momentum faces headwinds from a weakening yen.
Market Analysis
Japan
Player Demographics
+1
UK Interactive Entertainment
Jan 2025
Report
33 pages
Power of Play: 2025 Global Video Games Report
Video games provide measurable professional benefits, with gamers outperforming non-gamers in robotic surgery, emergency response, and retail simulations due to improved cognition, decision-making speed, and attentional control.
Organizations including NASA, the U.S. Air Force, and elite sports teams have integrated game-based platforms into their training pipelines to reduce error rates and improve return on investment.
Mobile devices are the primary gaming platform globally, accounting for 60–96% of all play sessions.
Market Analysis
Player Demographics
Player Behavior
+1
Video Games Europe
Jan 2025
Report
94 pages
PC & Console Gaming Report 2025
Console revenue is projected to grow at a 13% CAGR through 2027, significantly outpacing single-digit growth for PC, with major catalysts including the release of GTA VI and the Nintendo Switch 2.
Market dominance is heavily concentrated in established franchises, as new releases captured only 9% of total playtime in 2024, with annual franchises accounting for 67% of new-release hours on consoles.
Title diversity is shrinking, evidenced by a 27% decline in the average number of titles played per user on Steam in the US, with drops as high as 34% in markets like Russia and Brazil.
Market Analysis
Player Demographics
Player Behavior
+1
Newzoo
Jan 2025
Report
6 pages
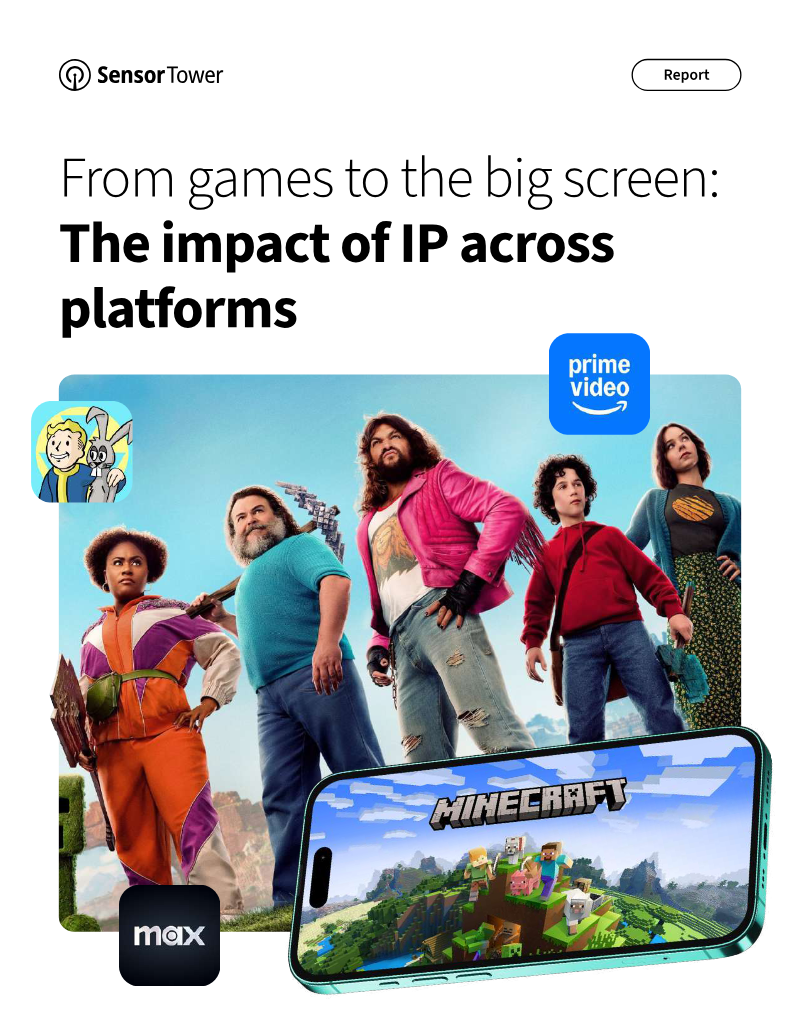
From Games to the Big Screen: The Impact of IP Across Platforms
The Fallout television series triggered a 410% surge in daily PC sales for Fallout 4 and sustained a 225% increase in daily active users for legacy titles for up to 20 weeks post-premiere.
The Minecraft film grossed over $900 million while driving a 44% spike in mobile in-app revenue and a 36% increase in console sales.
Transmedia adaptations create a symbiotic growth loop that simultaneously boosts gaming metrics and streaming platform performance, such as the 23% increase in Amazon Prime Video downloads following the Fallout series launch.
Market Analysis
Player Behavior
Marketing
+2
Sensor Tower
Jan 2025
Report
23 pages
2025 Mobile Gaming Benchmarks
75 percent of mobile games failed to achieve a 3 percent retention rate by day 28 in 2024, highlighting a widespread struggle to maintain long-term player loyalty.
Retention is the primary driver for both user acquisition ROI and sustainable monetization, making it the most critical metric for long-term viability.
Multiplayer titles command the longest average session durations of 8 to 9 minutes but struggle significantly with long-term user retention.
Market Analysis
Player Behavior
Retention
+2
GameAnalytics
Jan 2025
Report
22 pages
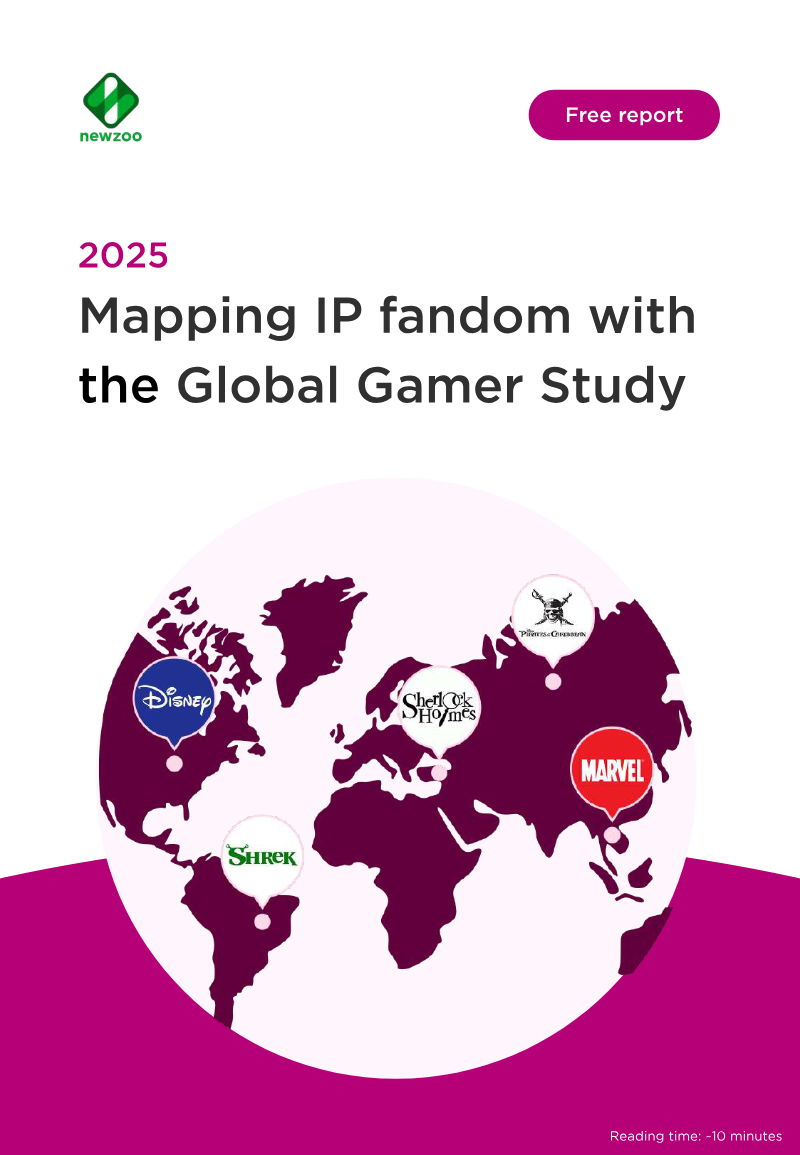
Mapping IP fandom with the Global Gamer Study
In 24 of 36 surveyed markets, gamers are more likely to play a title featuring an IP they favor, confirming that transmedia collaborations are a primary driver for acquisition and retention.
IP influence on player engagement varies significantly by region, peaking in South Asia (74%) and Latin America (64%) compared to more reserved engagement in Western Europe and Oceania (45%).
Global Favorites like Harry Potter and Disney maintain 90% recognition with high sentiment, whereas IPs like DC Comics show extreme regional variance, with 70% awareness in the U.S. versus only 21% in Japan.
Market Analysis
Player Behavior
Marketing
+1
Newzoo
Jan 2025
Report
38 pages
Is the Past the Future of Gaming?
Remakes and remasters have become a major industry pillar, with roughly 200 releases annually and projections indicating 30 high-profile titles for 2025.
Commercial performance for remakes frequently outperforms original releases, evidenced by the Resident Evil 4 remake achieving 10 million sales within two years.
Nostalgia is the primary consumer driver, with over 80% of 1,500 surveyed gamers citing the desire for emotional comfort as their main motivation for purchasing updated titles.
Market Analysis
Player Behavior
UK
MTM
Jan 2025
Report
21 pages
Newzoo's Generations Report: How Different Generations Engage with Games
Gen Z and Millennials spend significantly more time gaming weekly, averaging 7 hours 20 minutes and 6 hours 30 minutes respectively, compared to just over 2 hours for Baby Boomers.
Platform spending habits are polarized by generation, with Gen Z allocating 77% of their gaming budget to mobile while Baby Boomers direct 73% of their spend toward PC.
Engagement with game-related content is higher among younger cohorts, as 67–71% of Gen Z and Millennials both play and watch games, compared to 44–51% for older generations.
Player Demographics
Global
Market Analysis
+1
Newzoo
Jan 2025
Report
47 pages
How to Prepare Your Live Ops for the Holiday Season
Implement a series of short-term, 1-to-3-day events to generate immediate spikes in player engagement and session frequency.
Structure holiday content as a 'soft-sawtooth' difficulty curve that alternates between periods of challenge and respite to maintain player momentum.
Integrate holiday events directly into the core gameplay loop to ensure they feel like natural extensions of the existing experience rather than disruptive additions.
Live Ops
Monetization
Player Behavior
+2
Sensor Tower
Jan 2025
Report
25 pages
Mobile Casual Benchmarks Report 2025
Hybrid casual games are significantly more profitable than hypercasual models, with top subgenres like Merge 3, Luck Battle, and Life Simulator achieving ARPU figures between $11.08 and $14.83.
Pure hypercasual and simulation games suffer from poor long-term sustainability, characterized by low 30-day retention rates of approximately 3% and an ARPU of only $0.79.
Merge 3 games demonstrate high player engagement, leading all subgenres with an average session duration of 656 seconds.
Market Analysis
Player Behavior
Retention
+2
Appodeal
Jan 2025
Previous
1
2
3
…
9
Next