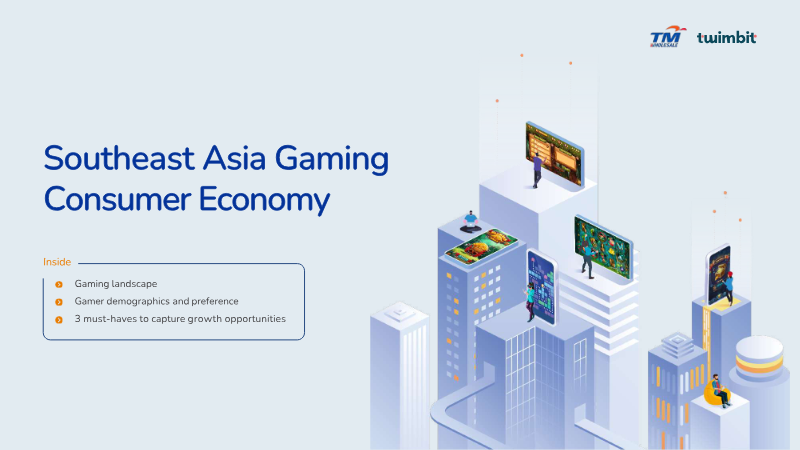
The Southeast Asia Gaming Consumer Economy report, produced jointly by Telekom Malaysia and twimbit in Q2 2022, examines the region’s rapidly expanding gaming market. Six key economies—Indonesia, Malaysia, the Philippines, Singapore, Thailand and Vietnam—account for 85 % of SEA’s gamer population, which is projected to reach 367.8 million by 2025, representing more than half of the region’s total population. Mobile gaming dominates, with 70 % of in‑game revenue and a 13.7 % CAGR in consumer spend from 2018 to 2021, totaling US$5.57 billion. Urbanisation and a youthful demographic drive high willingness to spend, with 64 % of gamers willing to pay; average annual spend varies from US$9 in Indonesia to US$189 in Singapore.
Genre preferences skew toward action, strategy and casual titles; 86 % of players engage in the top five genres. Gender parity is notable, especially on mobile where female gamers constitute 47 % of the market and are highly spend‑active. eSports viewership is nascent but growing, with SEA tournaments ranking among the world’s most‑watched events; mobile eSports is expected to lead future growth as 5G and cloud gaming mature. Monetisation remains dominated by free‑to‑play with in‑app purchases (86 % of revenue), supplemented by hybrid and subscription models.
Methodologically, the study synthesises industry interviews, published data, annual reports, and platform analytics. The report recommends that developers adopt edge computing for low‑latency play, deliver cross‑device flexibility, and build scalable cloud architectures to meet the region’s dynamic demand.

InvestGame · 2026

Deloitte · 2026
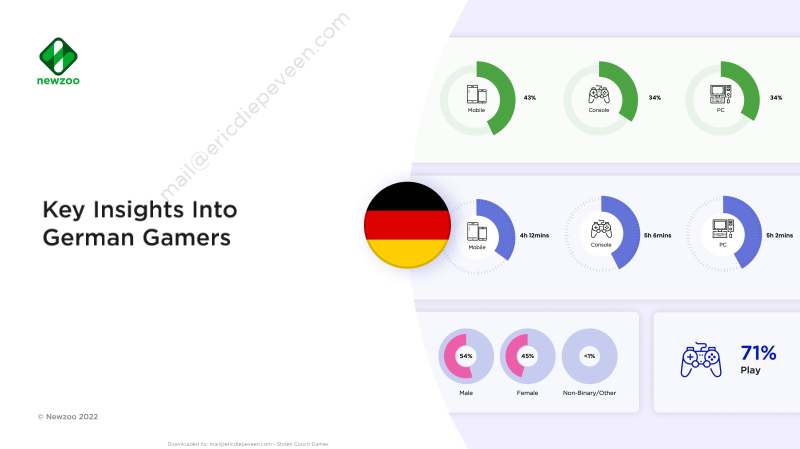
Newzoo · 2022

Entertainment Software Association · 2013

IIDEA – Italian Interactive Digital Entertainment Association
Niko Partners · 2026

Sensor Tower · 2026

Anzu · 2026
Newzoo · 2026

Decision Lab · 2026

InvestGame · 2026

SELL – Syndicat des Éditeurs de Logiciels de Loisirs · 2025