FinancialKonami Holdings Corporation
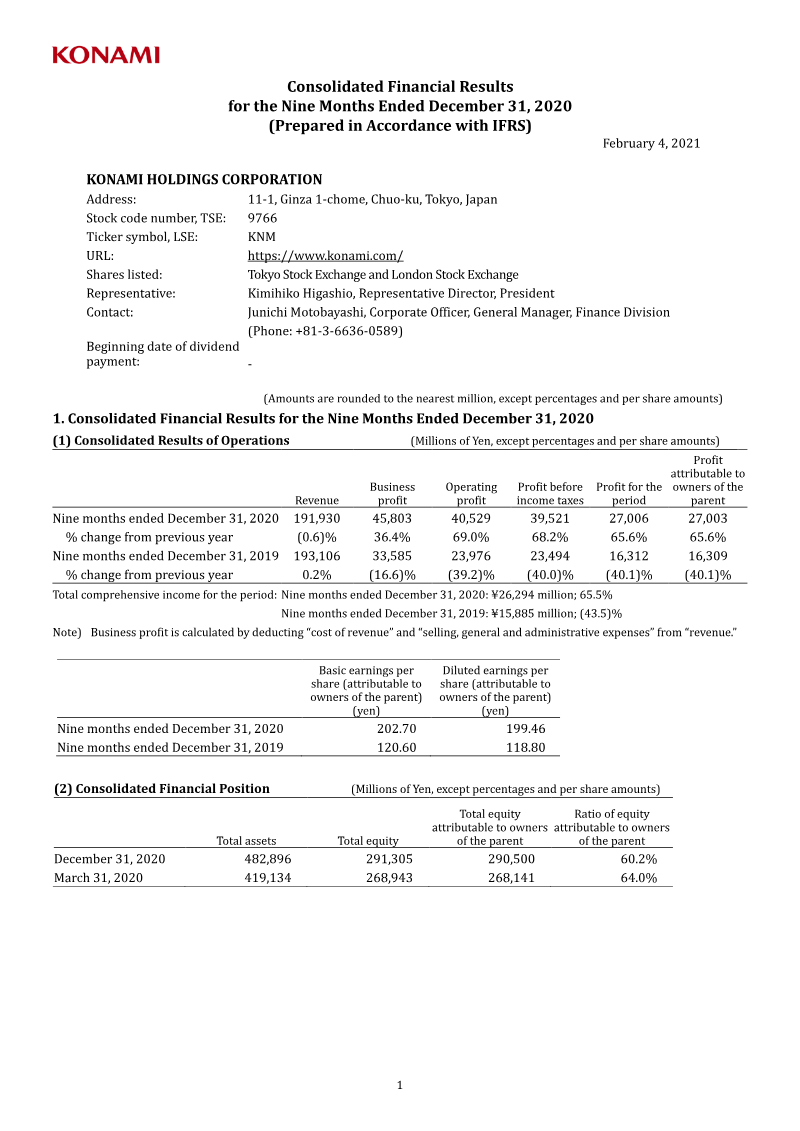
Consolidated Financial Results: Nine Months Ended December 31, 2020
21 pages~35 min full read
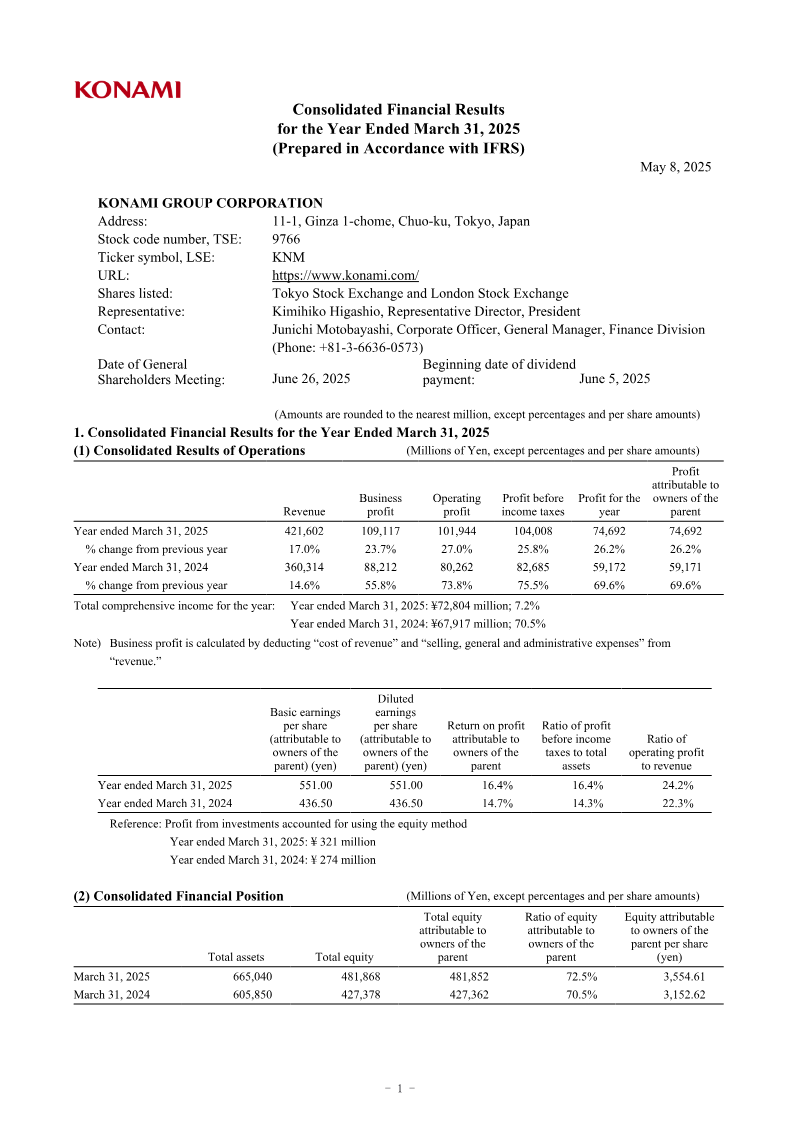
Konami achieved record-high business, operating, and pre-tax profits for the nine-month period ending December 31, 2020, despite a marginal 0.6% decline in total revenue to ¥191,930 million. This financial performance highlights a strategic pivot toward digital growth, as the Digital Entertainment segment surged by 33.1% to reach ¥144,136 million. This robust expansion effectively insulated the company from the severe operational disruptions caused by the global pandemic, which disproportionately impacted physical business segments.
The Amusement, Gaming & Systems, and Sports divisions faced substantial headwinds throughout this period. The Sports segment, in particular, experienced a 43.9% revenue decline to ¥25,925 million, resulting in a business loss of ¥4,027 million due to mandatory facility closures. In response, the company initiated a comprehensive restructuring of its cost base, which included closing underperforming locations and pivoting toward digital and outsourced fitness services to stabilize long-term operations.
Overall, the group’s profit rose significantly to ¥27,006 million, compared to ¥16,312 million in the prior year. While the company maintains a stable dividend policy of 45.00 yen per share, the ongoing economic volatility associated with the pandemic has precluded the issuance of a consolidated earnings forecast for the fiscal year ending March 31, 2021. The results underscore a successful transition toward digital-first revenue streams that effectively offset the contraction of traditional, location-based industry segments during a period of global instability.
Konami Holdings Corporation
Konami Holdings Corporation

Konami Holdings Corporation
Konami Holdings Corporation

Konami Holdings Corporation

Sony Group Corporation · 2026

Bandai Namco · 2026

InvestGame · 2025

Square Enix · 2025
Konami · 2025

Nintendo · 2024
Bandai Namco · 2022

Bandai Namco · 2021

GREE · 2017

Bandai Namco · 2017
GREE Inc. · 2016
Bandai Namco · 2014