
FinancialKonami Holdings Corporation
Consolidated Financial Results: Year Ended March 31, 2021
27 pages~44 min full read
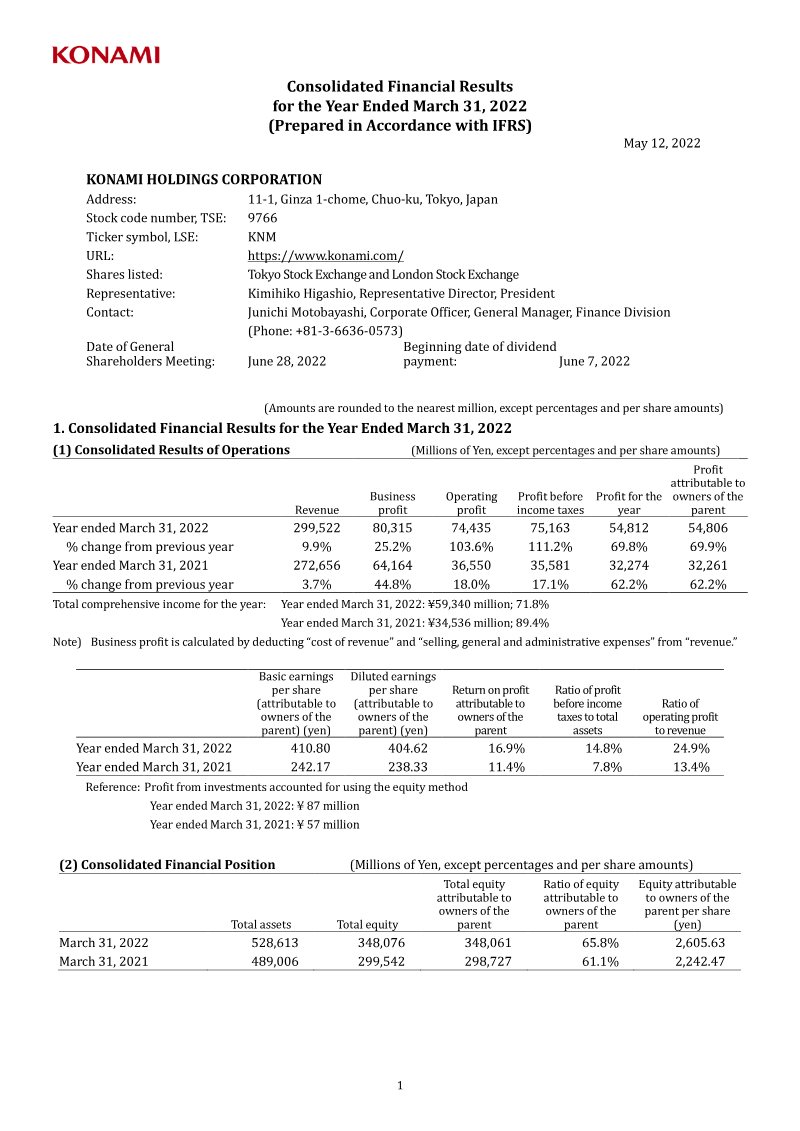
Konami Holdings Corporation achieved record-high business profitability for the fiscal year ending March 31, 2021, reporting a 44.8 percent increase to ¥64,164 million. Total revenue rose by 3.7 percent to ¥272,656 million, a performance underpinned by the robust expansion of the Digital Entertainment segment. This growth effectively offset significant operational headwinds in the Amusement, Gaming & Systems, and Sports divisions, which suffered from widespread facility closures and pandemic-related restrictions throughout the period.
The company’s financial position strengthened considerably, with total assets reaching ¥489,006 million and cash and cash equivalents climbing to ¥202,430 million. This liquidity was bolstered by improved operating cash flows and strategic bond issuance. In response to the uneven impact of the pandemic across its business segments, management implemented rigorous cost structure reforms, including the strategic closure of underperforming facilities and a pivot toward digital-first service models. Despite these gains, the volatility of the global market has led the organization to withhold consolidated earnings forecasts for the upcoming fiscal year.
Reflecting a commitment to shareholder value, the company maintained a consistent dividend policy, targeting a consolidated payout ratio exceeding 30 percent with an annual dividend of 73.00 yen per share. While the Digital Entertainment segment serves as the primary engine for current profitability, the broader corporate strategy remains focused on navigating ongoing economic uncertainty through disciplined cost management and the diversification of fitness and gaming services. The results underscore a period of transition where digital resilience proved essential in mitigating the systemic disruptions faced by the company’s physical entertainment and sports operations.
Konami Holdings Corporation
Konami Holdings Corporation
Konami Holdings Corporation
Konami Holdings Corporation

Konami Holdings Corporation
Kaga Electronics Co.
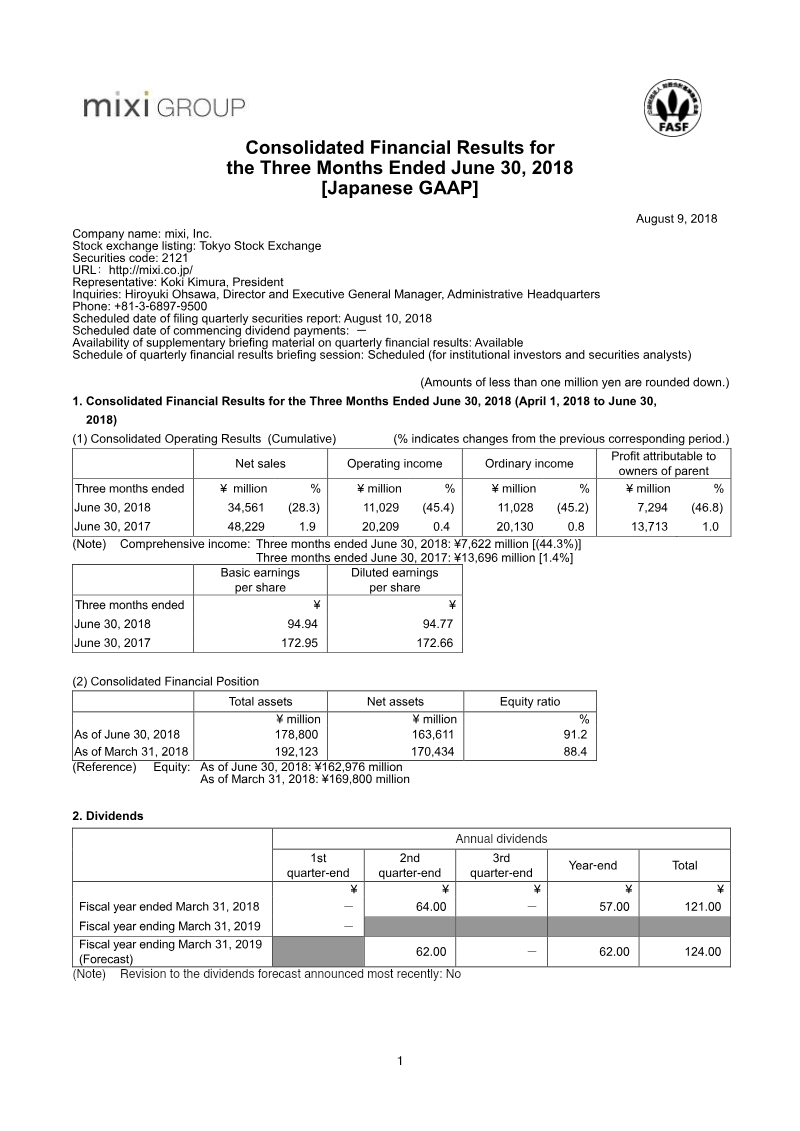
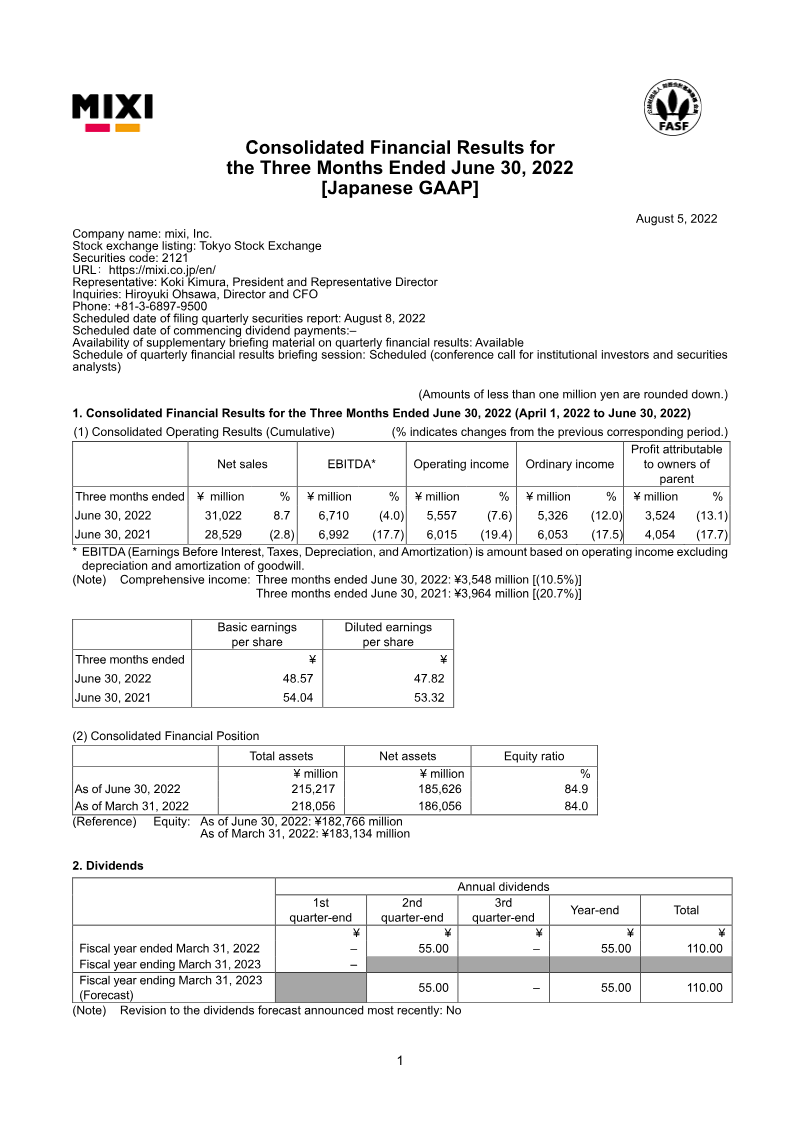
mixi
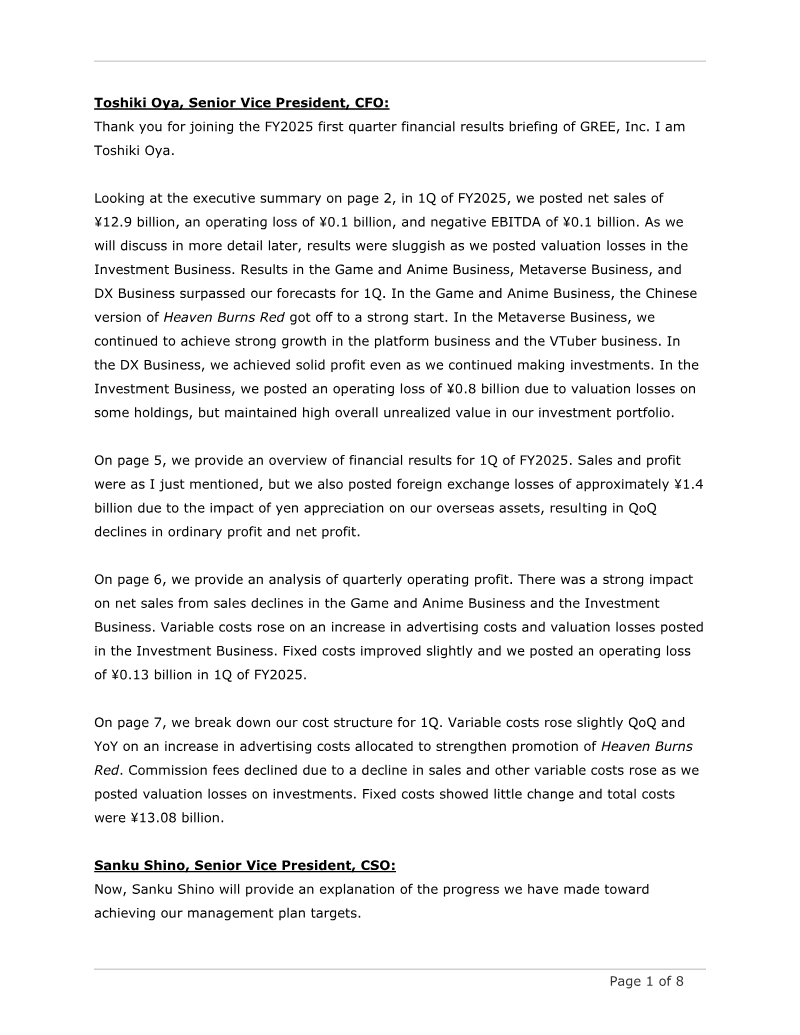
GREE
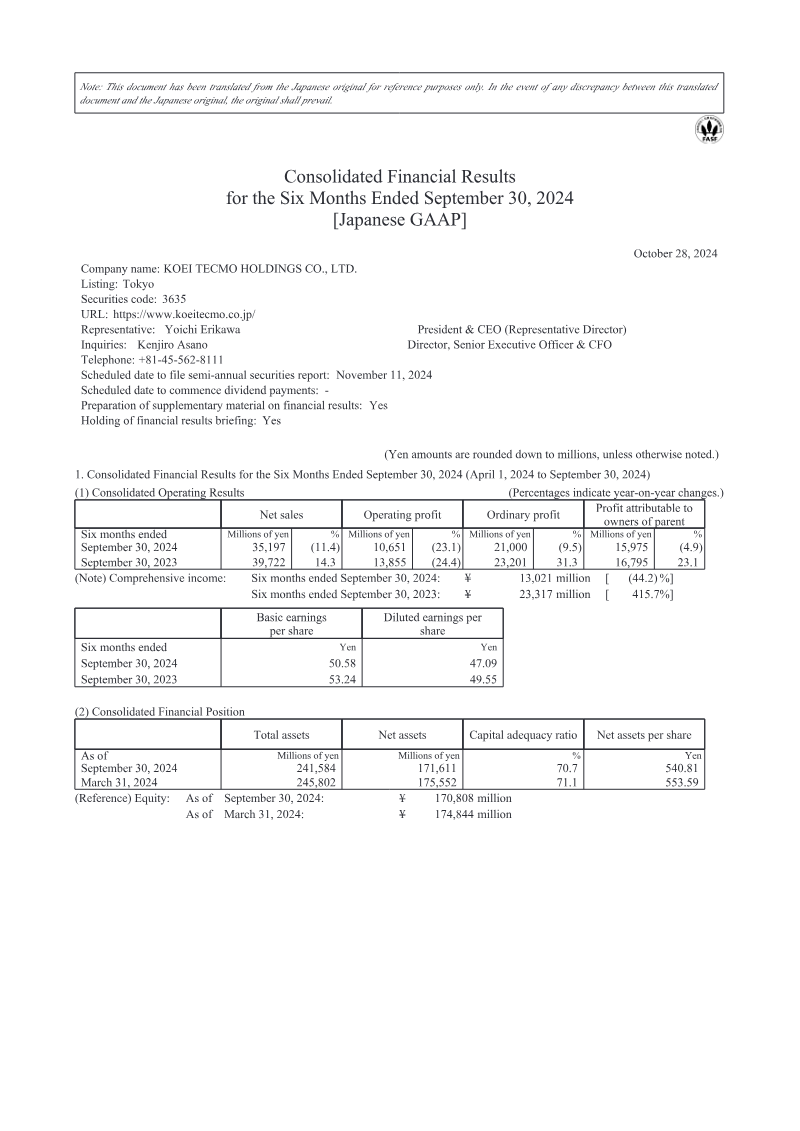
Koei Tecmo
mixi

Kadokawa Corporation
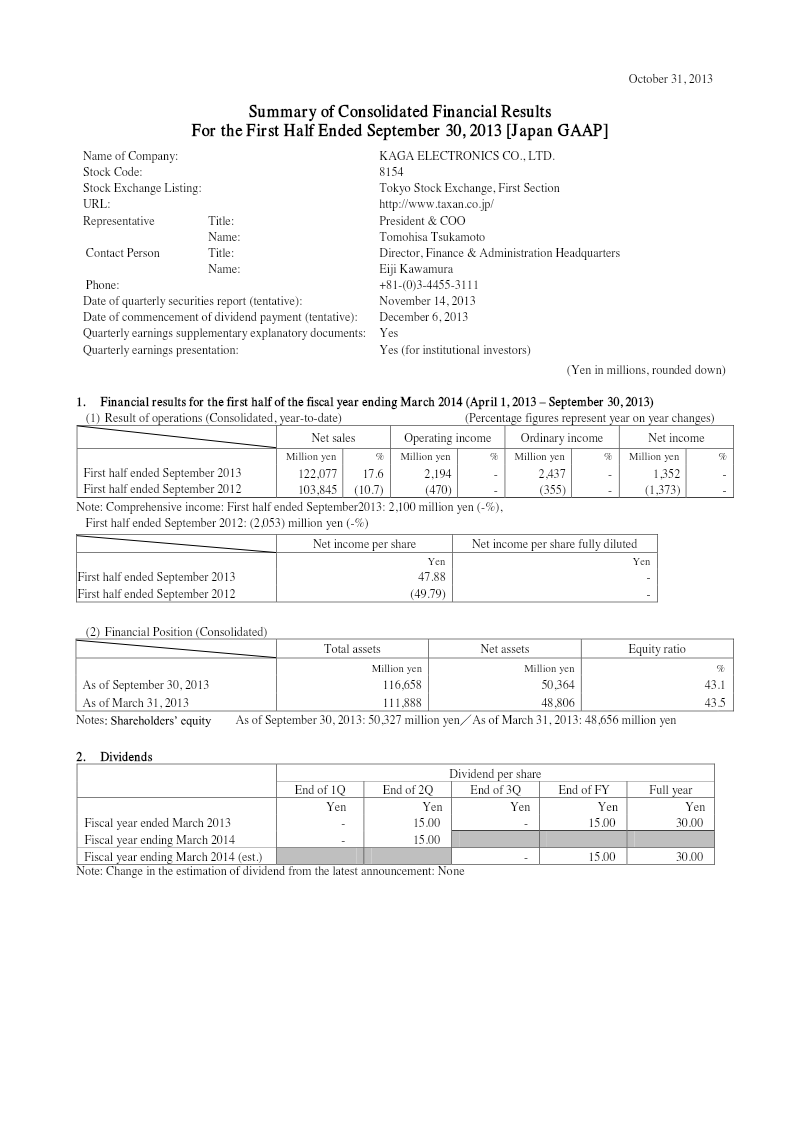
KAGA ELECTRONICS CO., LTD.
CyberAgent
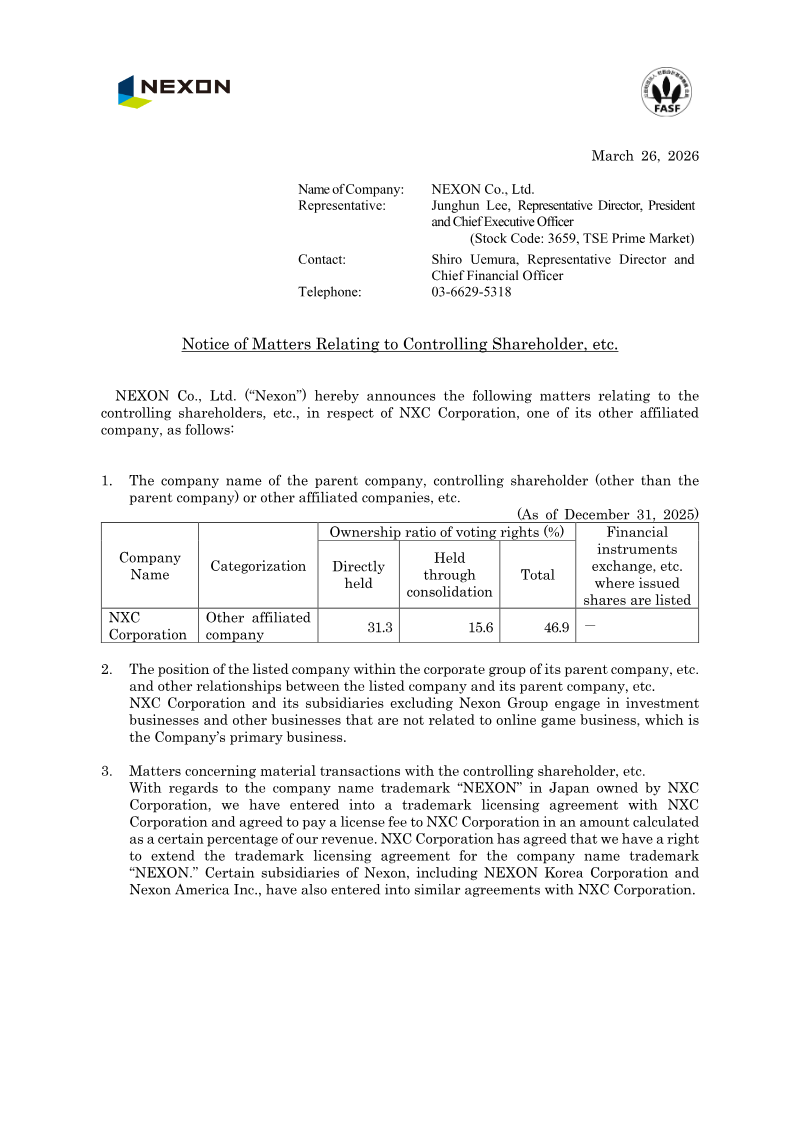
NEXON Co.

Capcom · 2026

Capcom Co. · 2026

Capcom · 2026