Updated Apr 30, 2026 by Konami Holdings Corporation
Financial
Published by Konami Holdings Corporation
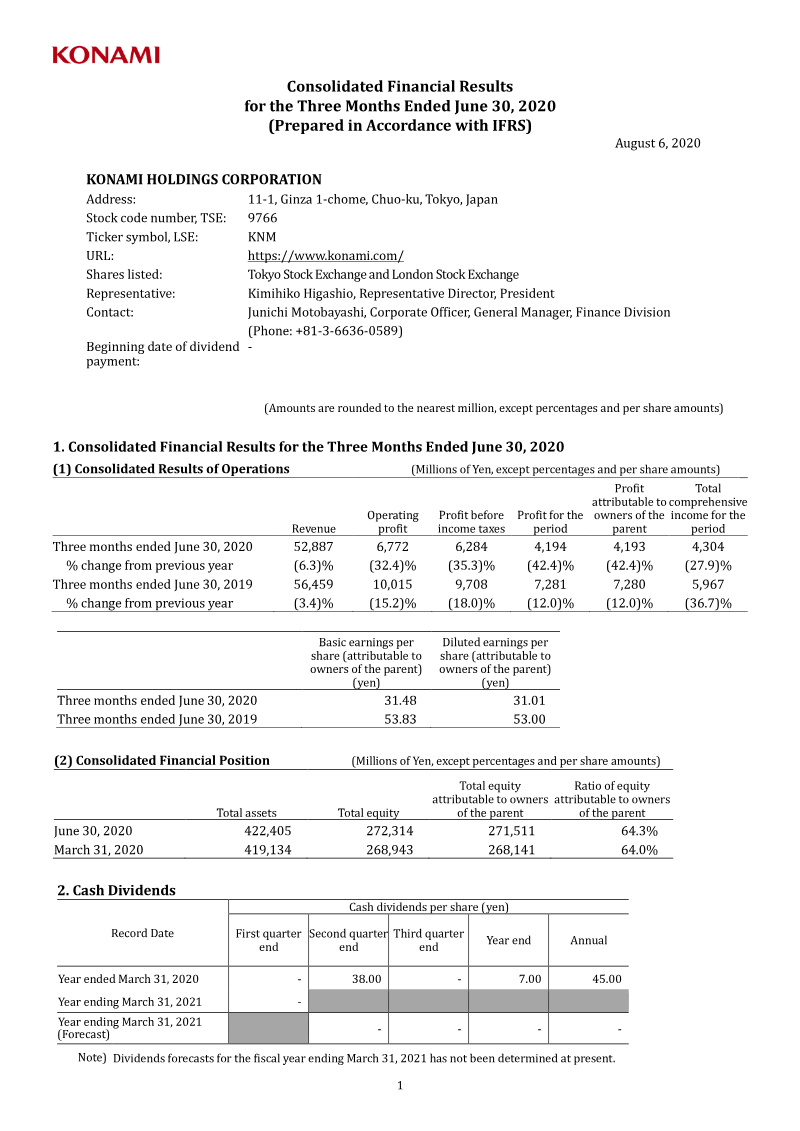
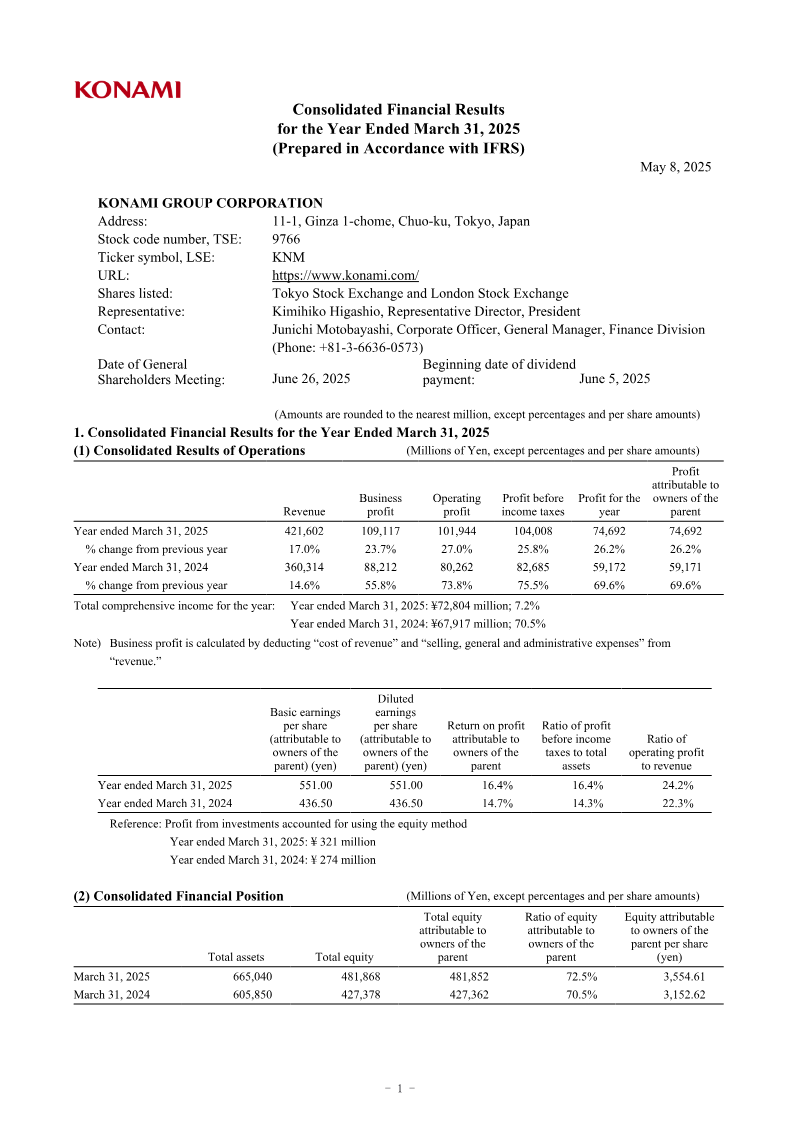
Konami Holdings Corporation achieved record-high financial results for the first quarter of the fiscal year ending March 31, 2022, signaling a robust recovery across its global operations. Consolidated revenue reached ¥68,326 million, representing a 29.2% increase compared to the same period in the previous year. Profitability saw a dramatic surge, with profit before income taxes climbing to ¥19,115 million from ¥6,284 million, while net profit rose to ¥13,658 million. This performance underscores a successful rebound from the prior year’s economic challenges, supported by a significant reduction in pandemic-related losses, which dropped from ¥5,723 million to ¥862 million. 
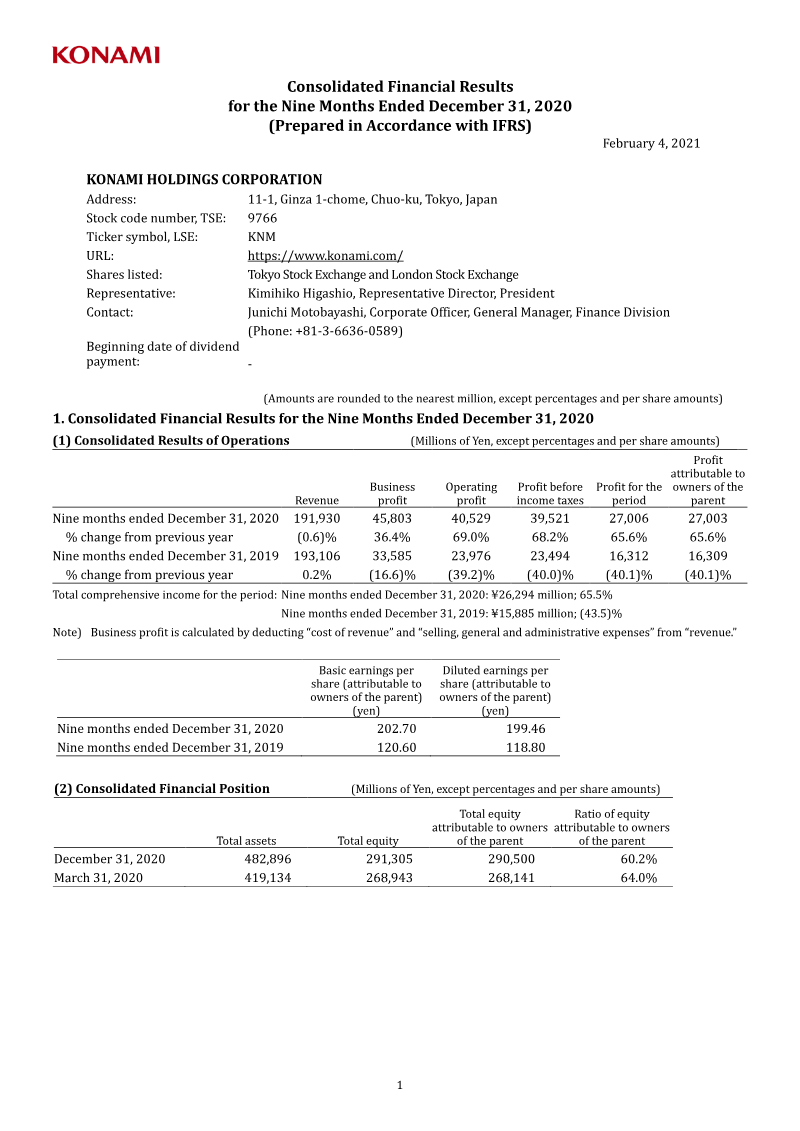
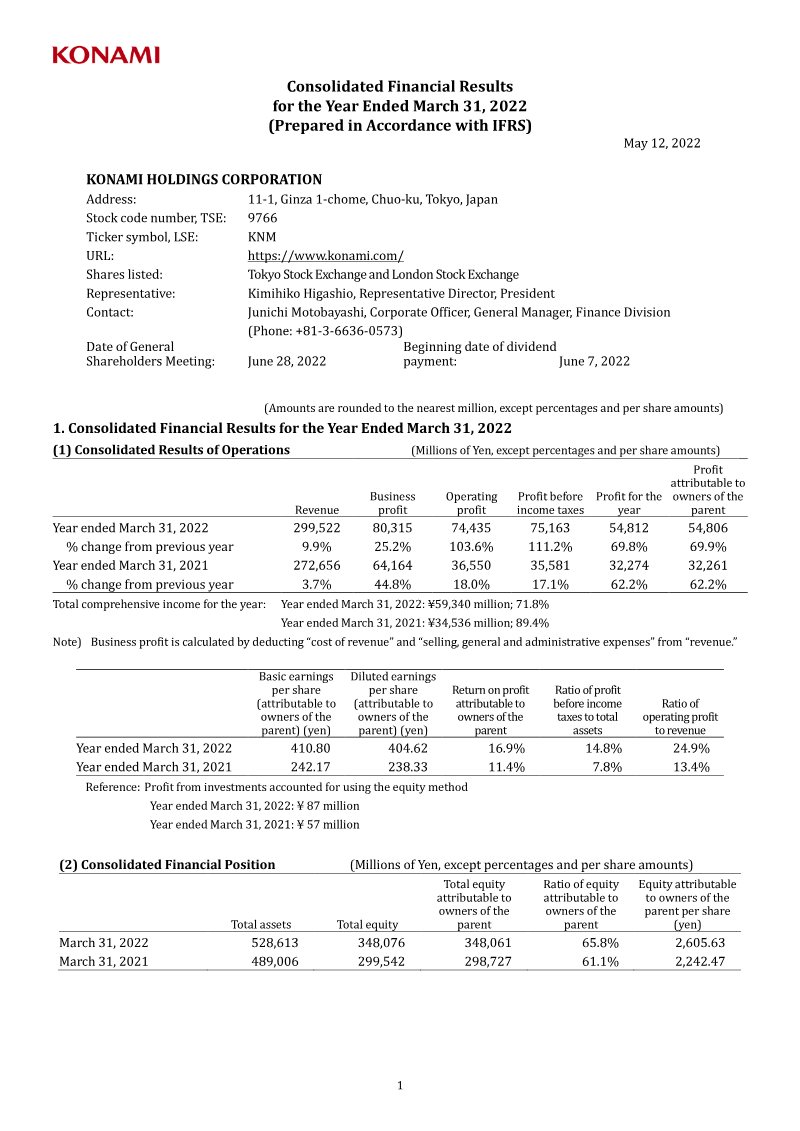
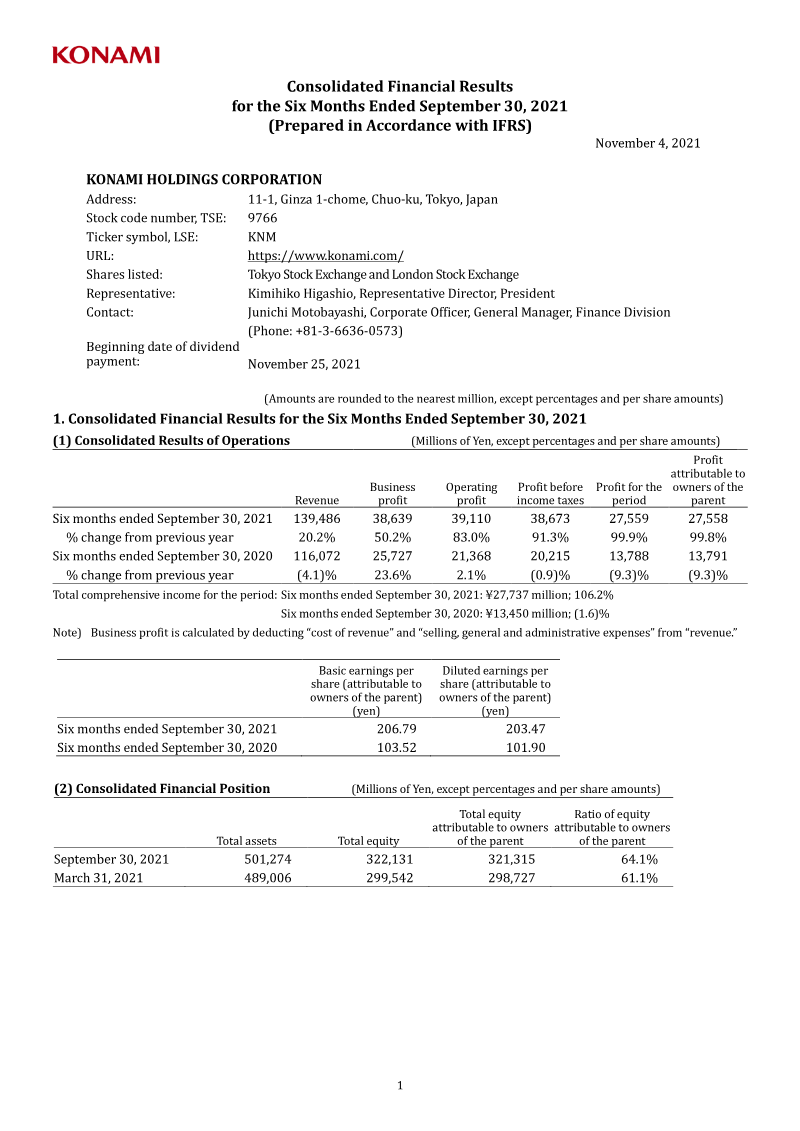
The growth was driven by strong performance in the Digital Entertainment segment alongside a broad-based recovery in the Amusement, Gaming & Systems, and Sports divisions. These segments collectively returned to profitability, benefiting from ongoing structural cost reforms and the expansion of digital entertainment offerings and sports facility operations. By diversifying its revenue streams and optimizing operational efficiency, the organization effectively mitigated the volatility that characterized the previous fiscal period. Despite these positive indicators, the company maintains a cautious outlook for the remainder of the fiscal year. Due to the persistent uncertainty surrounding the global trajectory of the COVID-19 pandemic, management has refrained from issuing a consolidated earnings forecast for the full fiscal year ending March 31, 2022. This conservative stance reflects a commitment to navigating potential market fluctuations while continuing to prioritize long-term stability and strategic growth across all business segments.
Consolidated Financial Results for the Three Months Ended June 30, 2021 August 5, 2021 (Prepared in Accordance with IFRS) Address: 11-1, Ginza 1-chome, Chuo-ku, Tokyo, Japan KONAMI HOLDINGS CORPORATION Stock code number, TSE: 9766 Ticker symbol, LSE: KNM URL: https://www.konami.com/ Shares listed: Tokyo Stock Exchange and London Stock Exchange Representative: ~~Kimihiko Higashio, ~~ Representative Director, President Contact: Junichi Motobayashi, Corporate Officer, General Manager, Finance Division Beginning date of dividend (Phone: +81-3-6636-0573) payment: - (Amounts are rounded to the nearest million, except percentages and per share amounts) 1. Consolidated Financial Results for the Three (Millions ~~of Yen, ~~ except percentages ~~and per ~~ share ~~amounts)~~ (1) Consolidated Results of Operations Months Ended June 30, 2021 ~~Profit ~~ Business Operating Profit before Profit for the ~~attributable ~~ to Revenue profit profit income taxes period owners of the Three months ended June 30, 2021 68,326 20,278 19,437 19,115 13,658 parent % change from previous year 29.2% 64.2% 187.0% 204.2% 225.7% 13,659 Three months ended June 30, 2020 52,887 12,351 6,772 6,284 4,194 225.7% % change from previous year (6.3)% 26.5% (32.4)% (35.3)% (42.4)% 4,193 Total comprehensive income for the period: Three ~~months ~~ ended June 30 ~~, ~~ 2021: ¥13,608 million; 216.2 ~~%~~ (42.4)% Note) Business profit is calculated by Three months ended June 30, 2020: ¥4,304 million; (27.9)% deducting “co
ge from previous year (6.3)% 26.5% (32.4)% (35.3)% (42.4)% 4,193 Total comprehensive income for the period: Three ~~months ~~ ended June 30 ~~, ~~ 2021: ¥13,608 million; 216.2 ~~%~~ (42.4)% Note) Business profit is calculated by Three months ended June 30, 2020: ¥4,304 million; (27.9)% deducting “cost of revenue” and “selling, general and administrative expenses” from “revenue.” Basic earnings per Diluted earnings per share (attributable to share (attributable to owners of the parent) owners of the parent) ~~Three months ended June 30, 2021~~ (yen) (yen) ~~Three months ended June 30, 2020~~ 102.54 100.86 31.48 31.01 (2) Consolidated Financial Position (Millions of Yen, except percentages and per share amounts) Total equity Ratio of equity ~~Total assets~~ Total equity attributable to owners attributable to owners June 30, 2021 ~~484,930~~ 306,421 of the parent of the parent March 31, 2021 ~~489,006~~ 299,542 305,607 63.0% 298,727 61.1%
2. Cash Dividends Cash ~~dividends ~~ per ~~share~~ (yen) Record Date First quarter Second ~~quarter ~~ Third quarter Year end Annual Year ended March 31, 2021 ~~end~~ - ~~end~~ ~~end~~ ~~Year ending March 31, 2022~~ - 22.50 - 50.50 73.00 ~~Year ending March 31, 2022~~ 36.50 - 36.50 73.00 (Forecast) Recently announced ~~change ~~ in ~~dividend ~~ forecasts for ~~the ~~ fiscal year ~~ending ~~ March ~~31, ~~ 2022 during Note) the three months ~~ended ~~ June 30, 202 ~~1~~ : No It is difficult to reasonably calculate the impact of the coronavirus outbreak on our projected consolidated results 3. Consolidated Earnings Forecast for the Year Ending March 31, 2022 at present. Projected consolidated results for the fiscal year ending March 31, 2022 has consequently not been determined. We will carefully assess the projections and announce it promptly when we can disclose it. Noted Items None (1) Changes in significant consolidated subsidiaries during the period (status changes of subsidiaries due to changes in the scope of consolidation): (2) 1. Changes in accounting policies required by IFRS: No Changes in accounting policies and accounting estimate 2. Other changes: No 3. Changes in accounting estimate: No (3) 1. Number of shares issued: (Treasury shares included) Number of shares issued (Share capital) As of June 30, 2021 143,500,000 shares 2. As of March 31, 2021 143,500,000 shares Number of treasury shares: As of June 30, 2021 10,287,143 shares 3.
changes: No 3. Changes in accounting estimate: No (3) 1. Number of shares issued: (Treasury shares included) Number of shares issued (Share capital) As of June 30, 2021 143,500,000 shares 2. As of March 31, 2021 143,500,000 shares Number of treasury shares: As of June 30, 2021 10,287,143 shares 3. As of March 31, 2021 10,286,773 shares Average number of shares outstanding: Three months ended June 30, 2021 133,213,056 shares Three months ended June 30, 2020 133,214,496 shares
Earnings release (Kessan Tanshin) regarding these consolidated financial results is not subject to auditing procedures. Cautionary statement with respect to Statements made in this forward-looking statements and other matters: including the above document with respect to our current plans, estimates, strategies and beliefs, statements forecasts, are forward-looking statements about our future performance. These to it and, are based on management's assumptions and beliefs in light of information currently available cause therefore, you should not place undue reliance on them. A number of important factors could actual results to be materially different from and worse than those discussed in forward-looking statements. Such factors include, but are not limited to: (i) changes in economic conditions affecting our operations; (ii) fluctuations in currency exchange rates, particularly with respect to the value of the Japanese yen, the U.S. dollar and the Euro; (iii) our ability to continue to win acceptance of our products, which are offered in highly competitive markets characterized by the continuous introduction of new products, rapid developments in technology and subjective and changing consumer preferences; (iv) the timing of the release of new game titles and products, especially game titles and products that are part of historically popular series; (v) our ability to successfully expand internationally with a focus on our Digital Entertainment, Amusement, and Gaming & Syst
nging consumer preferences; (iv) the timing of the release of new game titles and products, especially game titles and products that are part of historically popular series; (v) our ability to successfully expand internationally with a focus on our Digital Entertainment, Amusement, and Gaming & Systems businesses; (vi) our ability to successfully expand the scope of our business and broaden our customer base through our Sports business; (vii) regulatory developments and changes and our ability to respond and adapt to those changes; (viii) our expectations with regard to further acquisitions and the integration of any companies we may acquire; and (ix) the outcome of existing contingencies. Please refer to page from 9 to 11 for further information regarding our business forecasts. KONAMI HOLDINGS CORPORATION (the “Company”) disclosed the supplemental data for the consolidated financial statements via the Company's website on August 5, 2021.
Fiscal year 2026 ended with a 13 % rise in sales to ¥487.5 bn, yet operating income swung from a ¥48.1 bn profit in FY2025 to a ¥5.7 bn loss, driven by significant goodwill impairments on Rovio and Stakelogic and a widening deficit in the Gaming segment. Adjusted EBITDA fell to ¥16.6 bn, reflecting heavy upfront development costs and impairment charges, while net equity contracted by ¥48.7 bn as cash balances were depleted following the acquisitions of GAN and Stakelogic. Within Entertainment Contents, sales edged up to ¥326.6 bn from ¥321.5 bn, but operating income declined from ¥40.8 bn to ¥32.4 bn because new Full‑Game and F2P titles underperformed, despite steady growth in licensing revenue. Forecasts for FY2027 project sales of ¥357 bn and operating income of ¥42.5 bn, contingent on successful new IP launches, repeat sales, and a planned lift in licensing income. Margin erosion from title underperformance remains a key risk. Capital allocation for FY2026/3 was restructured to focus on ¥190 bn of cumulative investment over FY2025–FY2027, allocating ¥80 bn to development, ¥120 bn to strategic acquisitions, and planning ¥70 bn in share buybacks while pausing large‑scale M&A. Shareholder returns are expected to rise sharply, with FY2026/3 projected at ¥31.5 bn (≈¥11.7 bn in dividends) and FY2027/3 potentially reaching ¥16.2 bn under a 50 % total‑return ratio applied to projected net income. Pachislot sales showed modest growth, buoyed by new titles and strong first‑week performance of flagship IPs such as “Hokuto No Ken” and “Kabaneri of the Iron Fortress.” Pachinko sales declined as the temporary lift from Lucky Trigger 3.0 Plus faded and hall utilization softened. The group plans to introduce reel‑exchangeable cabinets, expected to account for roughly 20 % of pachislot revenue, and is positioning the gaming business for a J‑curve bottom in FY2027 through intensive lease sales and B2B platform upgrades. The release schedule for FY2026/3 emphasizes a concentrated push of multi‑platform titles, including the Nintendo Switch 2 launch in March 2026 and a slate of global releases across consoles, PC, and mobile from late 2025 to mid‑2026. Key animation properties such as *Detective Conan* and *Lupin the Third* are slated for April–June 2025, with several new IPs and Netflix exclusives planned for early 2026. Pachislot and pachinko product launches are detailed with projected unit sales ranging from 8,000 to 49,000 units across varying gambling‑specification tiers.
Sony Group’s FY2025 consolidated results demonstrate modest revenue growth and a mixed profitability profile across its core business units. Total sales increased 4 % to ¥12.48 trn, largely driven by higher operating income in the Imaging & Sensing Solutions (I&SS) and Music segments. Operating income rose 13 % to ¥1.45 trn, while net income attributable to shareholders fell 3 % to ¥1.03 trn because of a larger equity‑method loss in the Financial Services arm and higher impairment charges. Operating cash flow remained flat at ¥1.97 trn, and the spin‑off of Sony Financial Group was treated as a discontinued operation from Q1 FY25 onward. Within the Music division, sales climbed 15 % to ¥277.5 billion, propelled by growth in Recorded Music and Music Publishing streaming revenues (+9 % and +14 % respectively), live‑event income, and a strong contribution from the Demon Slayer franchise. Operating income in this segment surged 25 % to ¥89.7 billion, reaching a record high even after excluding one‑time items. Sony projects flat sales for FY2026, with operating income expected to decline 11 % to ¥47 billion as streaming gains are offset by the loss of Demon Slayer’s impact. The company consolidates its Pictures and Music results on a U.S. dollar basis, translating foreign‑currency sales and costs using weighted average exchange rates while accounting for hedging transactions. Foreign‑exchange fluctuations affect both sales and operating income, with I&SS hedging gains or losses incorporated into these calculations. These disclosures supplement, but do not replace, Sony’s IFRS‑compliant consolidated financial statements.
Bandai Namco Group reported record‑high net sales of ¥1,002.2 billion for the first nine months of FY2026, up 4.9 % from ¥955.6 billion in the same period of FY2025, driven primarily by robust performance in the Toys and Hobby segment. That segment achieved ¥503.6 billion in sales, a 9.5 % increase, and contributed ¥103.5 billion in profit, up 6.0 %. Digital sales rose modestly to ¥358.8 billion, while Visual and Music and Amusement segments saw slight declines in profitability due to shifts in title mix and product launches. Operating profit fell 12.2 % to ¥157.3 billion, largely attributed to a less favorable home‑console game lineup compared with the prior year. Full‑year forecasts were revised upward: net sales are now projected at ¥1,300.0 billion (a 4.0 % increase over the previous forecast), operating profit at ¥181.0 billion (up 9.7 %), and ordinary profit at ¥190.0 billion (up 10.5 %). The company maintains a shareholder‑return policy targeting a total return ratio of at least 50 %, with FY2026 dividends set at ¥73 billion (base ¥46 billion plus performance‑based ¥27 billion) and a treasury‑share purchase program of up to 6 million shares, worth up to ¥30 billion. Geographically the results reflect strong North American sales responsiveness and global licensing from flagship IPs such as Gundam, Dragon Ball, and One Piece. Methodologically, the figures derive from consolidated financial statements covering all operating segments, with segment‑level data presented for Toys and Hobby, Digital, Visual and Music, Amusement, Other, and Elimination/Corporate units. The presentation also outlines strategic initiatives for FY2027, emphasizing balanced title portfolios in Digital and continued expansion of experiential amusement facilities.
Square Enix’s recent performance review exposes a persistent decline in revenue growth and profitability over the past three years, with operating income falling 32 % and ROE dropping 61 %. The downturn is driven primarily by weak margins in both high‑definition (HD) and small‑dungeon (SD) game segments, excessive portfolio fragmentation, sub‑optimal product design and promotion, and escalating development costs. While the MMO licensing arm remains the sole growth driver (+11 %), overall gaming revenue has slipped, with HD and SD titles declining 4 % and 5 % respectively. Operating margins for these segments hover around 35–40 %, noticeably higher than the industry average of 28 % but still lagging behind competitors, indicating inefficiencies that are not being adequately addressed. The company’s medium‑term “Reboots” plan offers only high‑level directions without concrete key performance indicators or quantitative targets. Critical gaps include a lack of clear business‑portfolio strategy, insufficient disclosure on non‑core business rationales, and no defined mechanisms for monitoring progress or maximizing shareholder value. Capital allocation disclosures are similarly weak: cost‑of‑capital calculations, ROE and ROIC targets, and hurdle rates are absent, while share‑buyback authorization remains unused despite a sharp price decline. SG&A costs exceed peer norms by 5–6 ppt, driven largely by an oversized sales force, further eroding profit margins. Geographically, SD game revenue is almost entirely domestic; the Japanese market has contracted 2 % annually since 2020, and overseas growth remains only 3 %. The company’s global SD strategy is inert, with a 7 % overseas expansion rate falling short of projected growth and flagship titles such as *FFVII Ever Crisis* deriving 70 % of revenue from Japan. Non‑core Amusement and Publishing businesses are undervalued, with a significant conglomerate discount relative to peers and declining sales and margins. Limited cross‑synergy between game and publishing arms further hampers value creation. In summary, Square Enix faces a multifaceted challenge: declining core game performance, weak strategic direction and KPI setting, high SG&A costs, and an underperforming non‑core portfolio. Addressing these issues through tighter cost control, clearer performance metrics, aggressive overseas expansion, and potential portfolio optimization is essential to restore corporate value and achieve sustainable growth.