FinancialKonami Holdings Corporation
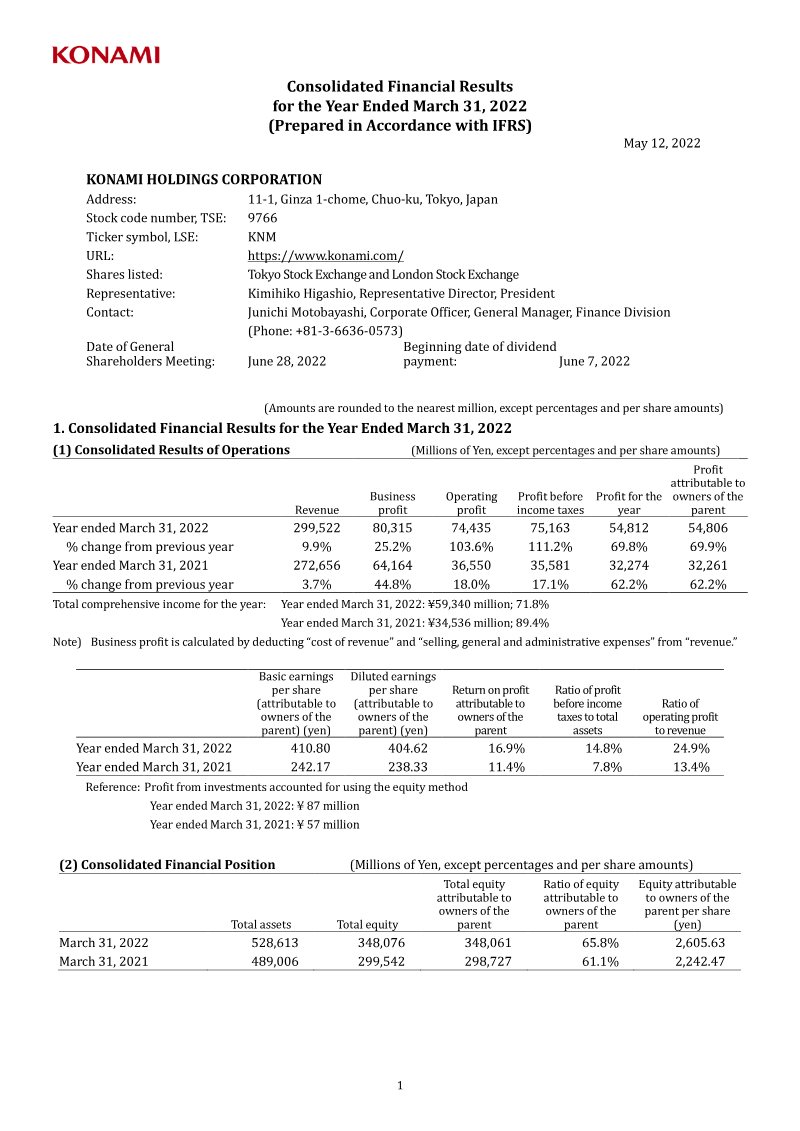
Consolidated Financial Results: Year Ended March 31, 2022
25 pages~38 min full read
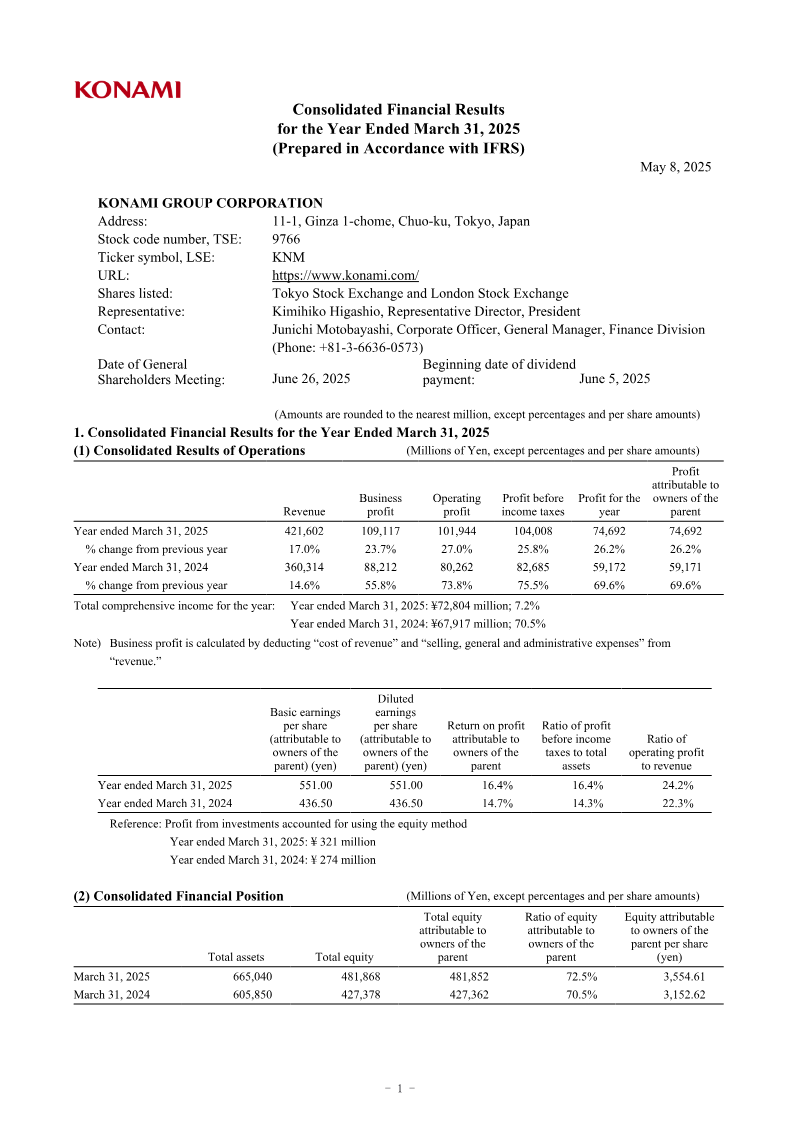
Konami Holdings Corporation achieved record-breaking financial performance for the fiscal year ending March 31, 2022, characterized by broad-based growth across all primary business segments. Total revenue reached ¥299,522 million, representing a 9.9% increase compared to the previous year. This expansion was accompanied by a significant rise in profitability, with profit attributable to owners of the parent surging by 69.9% and basic earnings per share climbing from ¥242.17 to ¥410.80. Operating profit for the period stood at ¥74,435 million, underscoring the effectiveness of the company’s diversified operational strategy.
The recovery of global markets from COVID-19 restrictions served as a primary catalyst for this success, particularly within the Gaming and Systems and Sports segments, which experienced notable rebounds. The Digital Entertainment division remained a cornerstone of the company’s financial health, consistently contributing to the overall upward trajectory. These results reflect a robust recovery and a strengthened financial position, evidenced by an equity ratio of 65.8% and cash and cash equivalents totaling ¥250,711 million by the close of the fiscal year.
Looking ahead, the organization intends to capitalize on its multifaceted portfolio to sustain long-term growth. By integrating digital entertainment, arcade services, and expanded casino hardware offerings, the company aims to maintain its competitive edge while prioritizing consistent shareholder returns. This strategic focus on diversification and operational efficiency positions the firm to navigate evolving market conditions while building upon the momentum established during this record-setting fiscal period.
Konami Holdings Corporation
Konami Holdings Corporation

Konami Holdings Corporation
Konami Holdings Corporation

Konami Holdings Corporation

Bandai Namco · 2021

Bandai Namco · 2017
Bandai Namco · 2015
Bandai Namco · 2014

Bandai Namco · 2012
Koei Tecmo
Capcom
Aream & Co · 2026
Konami · 2025
Konvoy · 2024
Nintendo · 2024
Bandai Namco · 2020