FinancialMIXI, Inc.
Consolidated Financial Results for the Fiscal Year Ended March 31, 2024
1 May 202423 pages~45 min full read
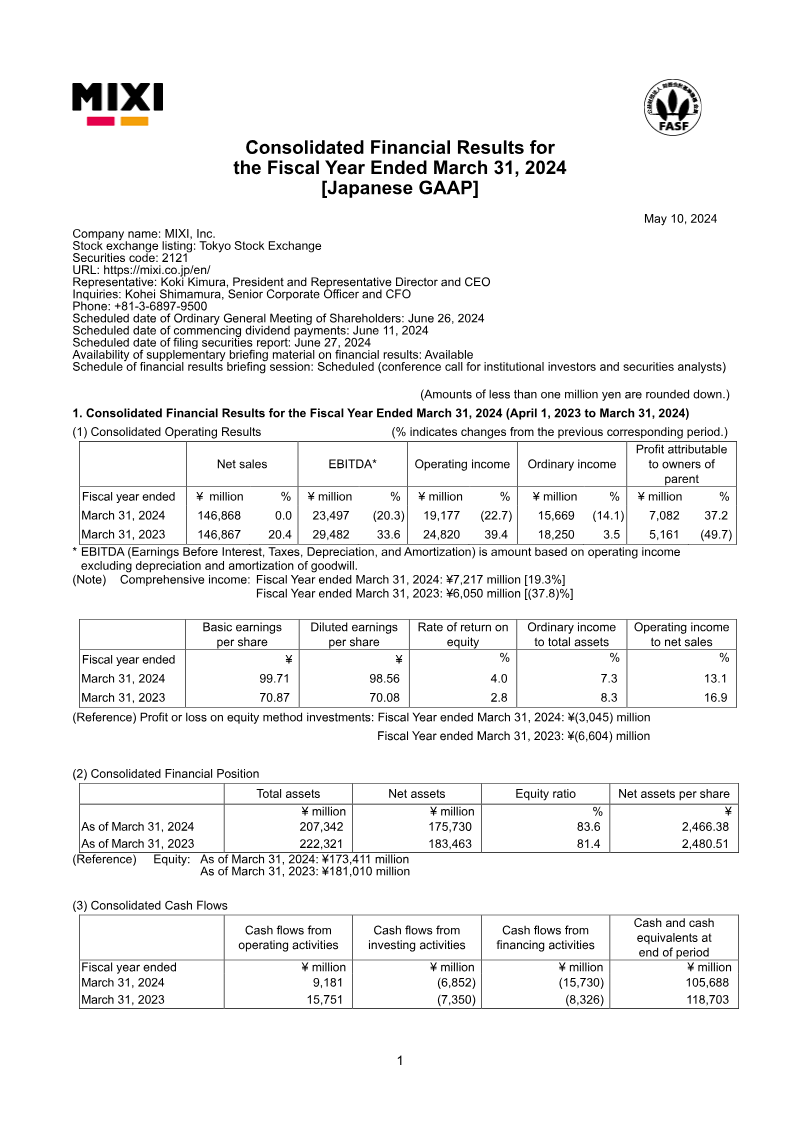
MIXI, Inc. reported stable net sales of ¥146.8 billion for the fiscal year ended March 31, 2024, though operating income declined 22.7% to ¥19.1 billion.
See it on page 20Net income attributable to owners of the parent grew 37.2% to ¥7.08 billion, with forecasts projecting a 69.4% surge to ¥12.0 billion for the fiscal year ending March 2025.
See it on page 2The Digital Entertainment segment, anchored by Monster Strike, remains the primary revenue driver despite experiencing a year-over-year contraction in profitability.
See it on page 20Financial results were impacted by impairment losses in the Sports Business and equity-method associates like CALL DOCTOR Co., Ltd., alongside a ¥2.677 million valuation loss on convertible bonds.
See it on page 15The company maintained a consistent annual dividend of ¥110 per share and basic earnings per share of ¥99.71.
See it on page 2To improve capital efficiency, MIXI cancelled 4.5 million treasury shares and initiated a new share repurchase program valued at up to ¥7.5 billion.
See it on page 23Cash and cash equivalents decreased to ¥105.7 billion, driven by ¥7.5 billion in treasury share purchases and significant income tax payments.
See it on page 11MIXI, Inc. maintained stable net sales of ¥146.8 billion for the fiscal year ended March 31, 2024, despite a 22.7% decline in operating income to ¥19.1 billion. While the Digital Entertainment segment, anchored by the enduring performance of Monster Strike, remains the primary revenue driver, its profitability experienced a year-over-year contraction. Conversely, net income attributable to owners of the parent grew by 37.2% to ¥7.08 billion, a result of reduced non-operating and extraordinary losses relative to the prior year. This financial trajectory is expected to accelerate, with forecasts projecting a 69.4% surge in net income to ¥12.0 billion for the fiscal year ending March 2025.
The fiscal period was characterized by strategic capital management and the navigation of impairment challenges. Cash and cash equivalents decreased to ¥105.7 billion, influenced by ¥7.5 billion in treasury share purchases and significant income tax payments. Financial results were further impacted by a ¥2.677 million valuation loss on convertible bonds and impairment losses within the Sports Business and equity-method associates like CALL DOCTOR Co., Ltd. These adjustments reflect a rigorous reassessment of business plans and asset valuations across the Lifestyle and Sports segments.
To enhance shareholder value and capital efficiency, the company executed the cancellation of 4.5 million treasury shares and initiated a subsequent repurchase program valued at up to ¥7.5 billion. Basic earnings per share rose to ¥99.71, supporting a consistent annual dividend of ¥110 per share. Despite the amortization of ¥1,338 million in goodwill, the organization maintains a robust balance sheet and a clear focus on stabilizing its core entertainment offerings while optimizing its diversified portfolio for long-term growth.