FinancialMIXI, Inc.
Consolidated Financial Results for the Fiscal Year Ended March 31, 2023
1 May 202325 pages~50 min full read
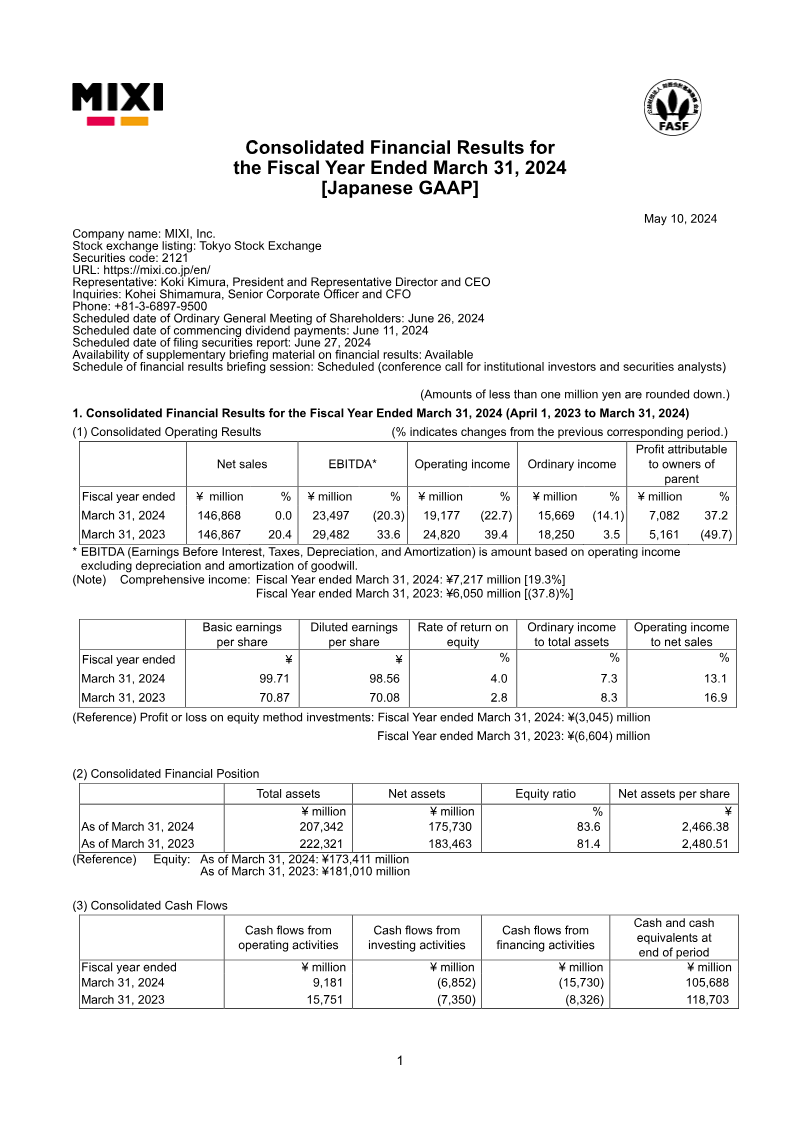
MIXI, Inc. reported a 20.4% increase in net sales to ¥146,867 million and a 39.4% rise in operating income to ¥24,820 million for the fiscal year ended March 31, 2023, driven primarily by the Digital Entertainment segment and Monster Strike.
Profit attributable to owners of the parent plummeted 49.7% to ¥5,161 million, largely due to a combined ¥15,830 million in losses from equity method investments, a bitbank, inc. impairment, and business withdrawals.
Net cash from operating activities improved significantly, rising from ¥2,647 million in the previous year to ¥15,751 million, while the company maintained a strong liquidity position with ¥118,703 million in cash and cash equivalents.
Management projects a decline in net sales and operating income for fiscal year 2024, though net profit is expected to recover by 45.3% as the impact of one-time losses from the previous year subsides.
The company reclassified its Investment Business into a primary reportable segment, integrating related gains and losses into net sales and cost of sales to reflect a shift toward a more diversified business model.
To support shareholder value, the company maintained a stable dividend of ¥55 per share and authorized a post-fiscal year share repurchase program valued at up to ¥7,500 million.
MIXI, Inc. achieved significant top-line growth during the fiscal year ended March 31, 2023, with net sales rising 20.4% to ¥146,867 million and operating income increasing 39.4% to ¥24,820 million. This performance was primarily driven by the Digital Entertainment segment and the continued strength of its flagship title, Monster Strike. Despite these gains, profit attributable to owners of the parent fell by 49.7% to ¥5,161 million. This decline resulted from substantial non-operating and extraordinary expenses, including a ¥6,604 million loss on equity method investments, a ¥4,818 million impairment loss related to bitbank, inc., and a ¥4,408 million loss stemming from business withdrawals.
The fiscal year was characterized by strategic structural shifts, most notably the reclassification of the Investment Business into a primary reportable segment. This change moved operational investment securities to current assets and integrated related gains and losses into net sales and cost of sales. While income before taxes decreased, net cash from operating activities saw a dramatic increase from ¥2,647 million to ¥15,751 million. The company maintained a robust liquidity position, ending the period with ¥118,703 million in cash and cash equivalents, supported by reduced spending on investing and financing activities compared to the previous year.
Looking forward, projections for fiscal year 2024 suggest a decline in net sales and operating income, though net profit is expected to recover by 45.3% as the impact of one-time losses diminishes. To enhance capital efficiency and shareholder value, a stable dividend of ¥55 per share was maintained, supplemented by a post-fiscal year authorization of a share repurchase program valued at up to ¥7,500 million. These actions reflect a transition toward a more diversified business model, balancing core digital entertainment assets with strategic investments and portfolio optimization.