Financialmixi
Consolidated Financial Results for the Fiscal Year Ended March 31, 2014
1 May 201448 pages~89 min full read
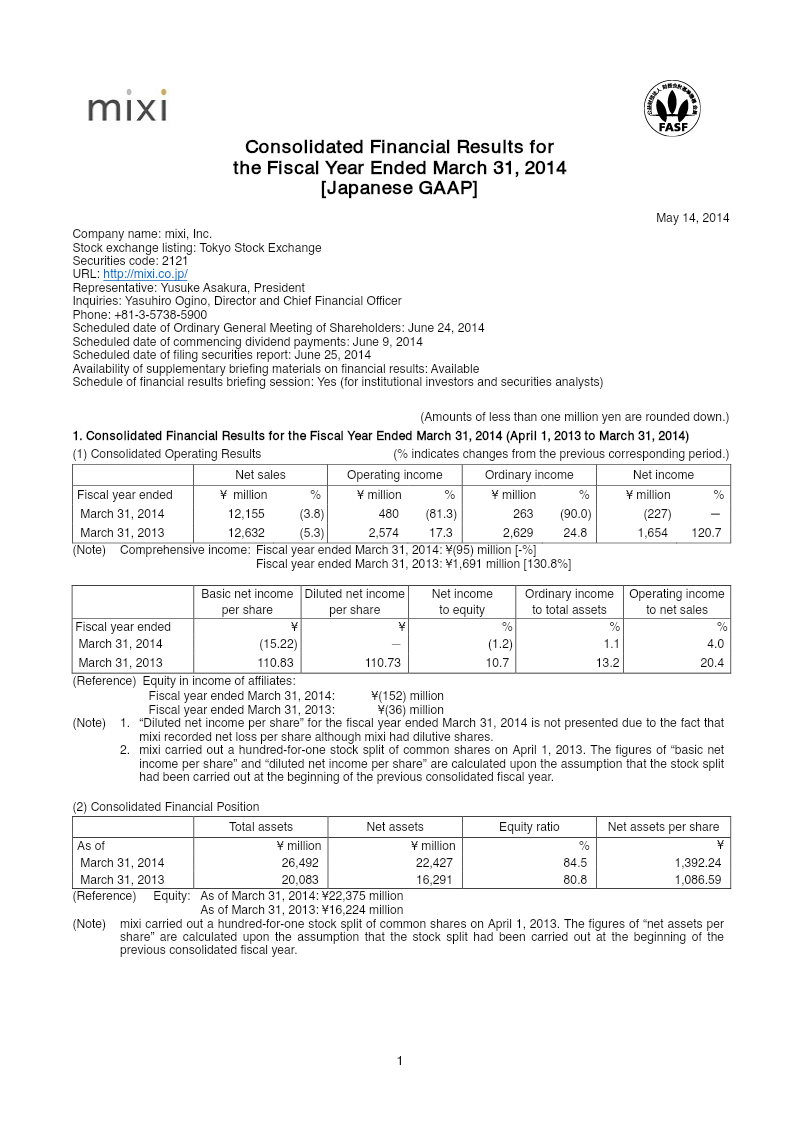
The company reported a net loss of ¥227 million for the fiscal year ending March 31, 2014, driven by impairment losses from liquidating Chinese subsidiaries and high tax rates, despite net sales of ¥12,155 million.
See it on page 39Management projects a significant turnaround for fiscal year 2015, forecasting net sales to triple to ¥40,000 million and net income to reach ¥6,000 million.
See it on page 2The mobile title 'Monster Strike' emerged as the primary growth driver within the Social Net Business segment, which generated ¥11,550 million in external sales.
See it on page 32Cash and cash equivalents nearly doubled to ¥16.8 billion following a hundred-for-one stock split and new share issuances that raised ¥6.5 billion.
See it on page 1The company expanded its portfolio through the ¥1.2 billion acquisition of Diverse, Inc. and Confianza & Co., Inc. while simultaneously disposing of ¥337 million in aging infrastructure assets.
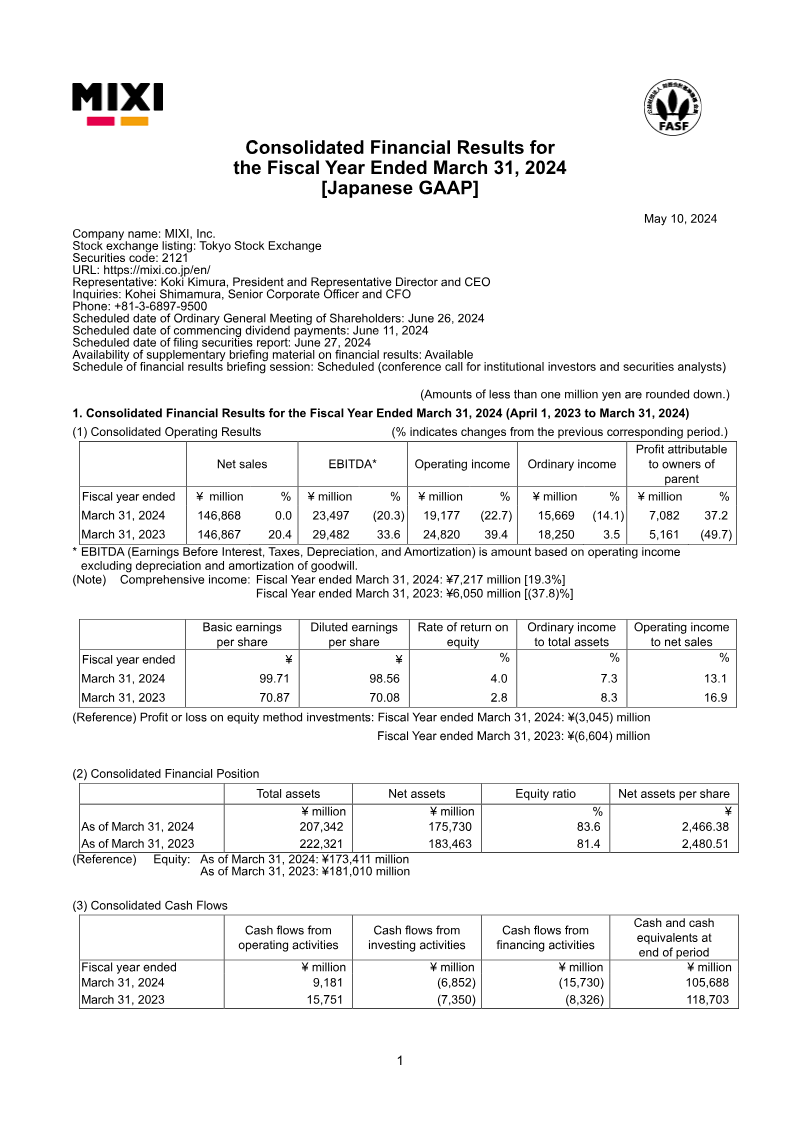
See it on page 27The firm maintains a strong financial position with total assets of ¥26,492 million and an equity ratio of 84.5%.
See it on page 37To improve share liquidity and broaden the investor base, the board approved a five-for-one stock split effective July 2014.
See it on page 35The fiscal year ended March 31, 2014, represented a period of significant structural transition and strategic reinvestment for the Japanese social networking and gaming firm. While net sales experienced a modest 3.8% decline to ¥12,155 million, the company recorded a net loss of ¥227 million, a sharp reversal from the previous year’s profit. This downturn was largely attributed to impairment losses from the liquidation of Chinese subsidiaries, the closure of local bases, and high effective tax rates resulting from goodwill amortization. Despite these losses, the company’s financial foundation remained robust, with total assets increasing to ¥26,492 million and an equity ratio of 84.5%.
The Social Net Business segment served as the primary revenue engine, contributing ¥11,550 million in external sales. This performance was bolstered by the growth of the mobile title Monster Strike, which signaled a shift in the company’s core growth drivers. To support this evolution, the group pursued aggressive portfolio expansion through the 100% acquisitions of Diverse, Inc. and Confianza & Co., Inc. for approximately ¥1.2 billion, alongside a strategic business transfer to enhance research and matchmaking services. These moves were complemented by internal restructuring, including the disposal of aging server infrastructure and software assets totaling ¥337 million.
Capital management was a central focus throughout the period, characterized by a hundred-for-one stock split and new share issuances that raised ¥6.5 billion. These actions nearly doubled cash and cash equivalents to ¥16.8 billion, providing the liquidity necessary for future scaling. Looking toward fiscal year 2015, the outlook is highly optimistic, with projections suggesting net sales will more than triple to ¥40,000 million and net income will reach ¥6,000 million. To further improve share liquidity and broaden the investor base in anticipation of this growth, the board approved an additional five-for-one stock split effective July 2014.