FinancialMIXI, Inc.
Consolidated Financial Results for the Fiscal Year Ended March 31, 2025
1 May 202530 pages~59 min full read
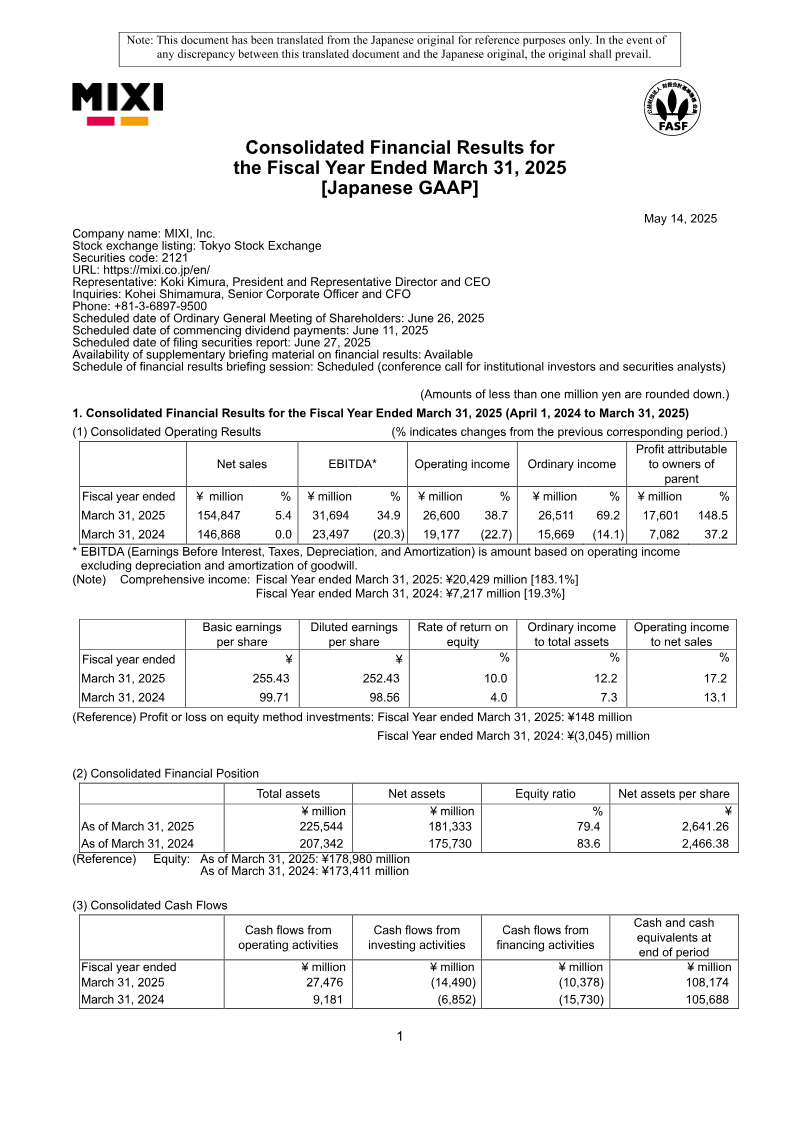
MIXI, Inc. reported a 148.5% surge in profit attributable to owners to ¥17.6 billion for the fiscal year ended March 31, 2025, alongside a 5.4% increase in net sales to ¥154.8 billion.
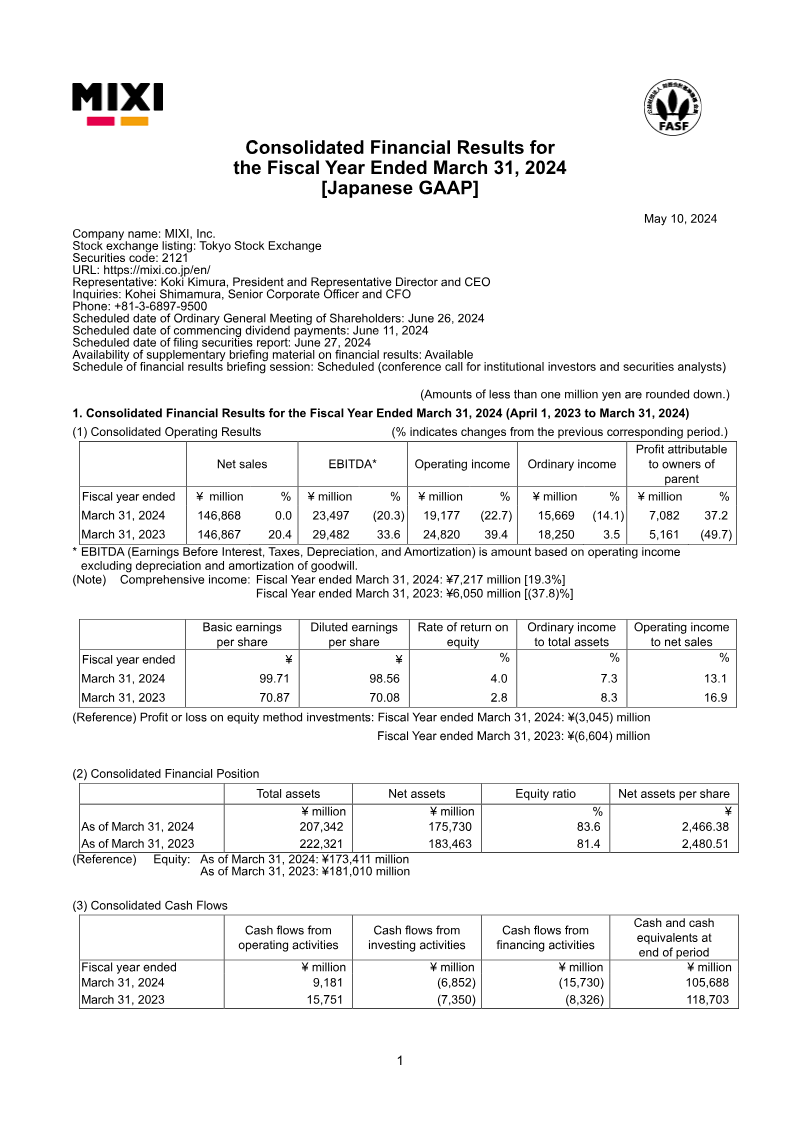
Profitability was driven by a ¥7 billion reduction in selling, general, and administrative expenses and growth in the Sports and Investment segments, which offset a revenue contraction in the flagship Digital Entertainment segment.
The company projects a cautious outlook for the fiscal year ending March 31, 2026, forecasting a 26.1% decline in profit despite maintaining stable net sales at ¥155 billion.
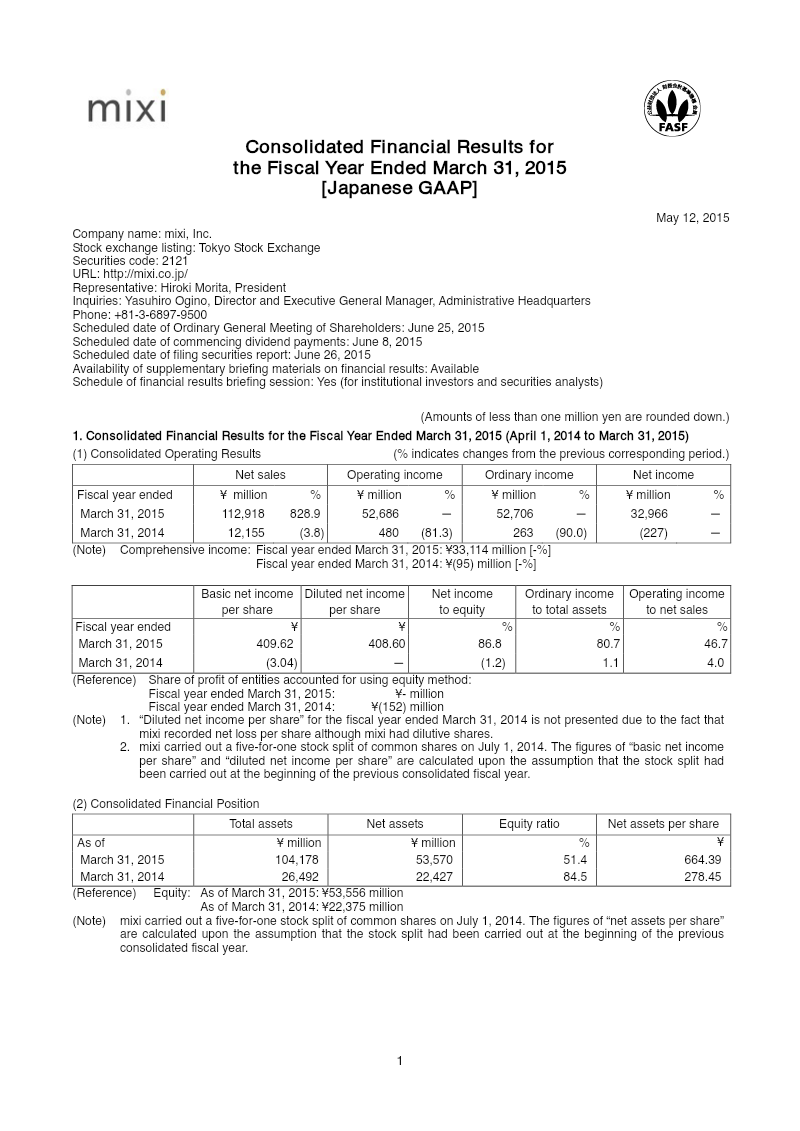
Basic earnings per share rose significantly from ¥99.71 to ¥255.43, and the company has committed to a ¥9.5 billion treasury share repurchase program and the cancellation of 2.4 million shares.
Net cash from operating activities nearly tripled to ¥27.5 billion, though the equity ratio declined marginally to 79.4% due to treasury share acquisitions and a ¥9 billion loan commitment for subsidiary Chariloto Co., Ltd.
Operations remain heavily concentrated in the Japanese market, which accounts for over 90% of total net sales.
Strategic expansion efforts included the acquisition of picon, Inc. and the establishment of MIXI Australia, though these were partially offset by a ¥1 billion loss from improper transactions at a subsidiary.
MIXI, Inc. achieved significant financial growth during the fiscal year ended March 31, 2025, characterized by a 5.4% increase in net sales to ¥154.8 billion and a 148.5% surge in profit attributable to owners, reaching ¥17.6 billion. While the core Digital Entertainment segment experienced a minor revenue contraction as engagement for the flagship title Monster Strike stabilized following its tenth anniversary, overall performance was bolstered by the Sports and Investment segments. Growth in these areas was primarily driven by increased betting service sales and strategic share divestments. This profitability was further supported by a ¥7 billion reduction in selling, general, and administrative expenses, specifically within advertising and settlement fees.
The financial position remains robust, with total assets expanding to ¥225.5 billion and net cash from operating activities nearly tripling to ¥27.5 billion. Despite this liquidity, the equity ratio saw a marginal decline to 79.4% due to treasury share acquisitions and new borrowings, including a ¥9 billion loan commitment for the subsidiary Chariloto Co., Ltd. The fiscal year was also marked by strategic organizational shifts, including the acquisition of picon, Inc. and the establishment of MIXI Australia, though these were tempered by a ¥1 billion loss resulting from improper transactions at a subsidiary.
Operations remain heavily concentrated in the Japanese market, which accounts for over 90% of net sales. Looking toward the fiscal year ending March 31, 2026, the outlook remains cautious with a projected 26.1% decline in profit despite stable sales forecasts of ¥155 billion. Future growth strategies prioritize expansion into AI technologies and the continued scaling of the Sports and Lifestyle segments. To maintain shareholder value, the company has committed to a ¥9.500 million treasury share repurchase program and the cancellation of 2.4 million shares, following a significant rise in basic earnings per share from ¥99.71 to ¥255.43.