
FinancialKadokawa Corporation
Earnings Results: 3rd Quarter Ended December 31, 2025
37 pages~51 min full read
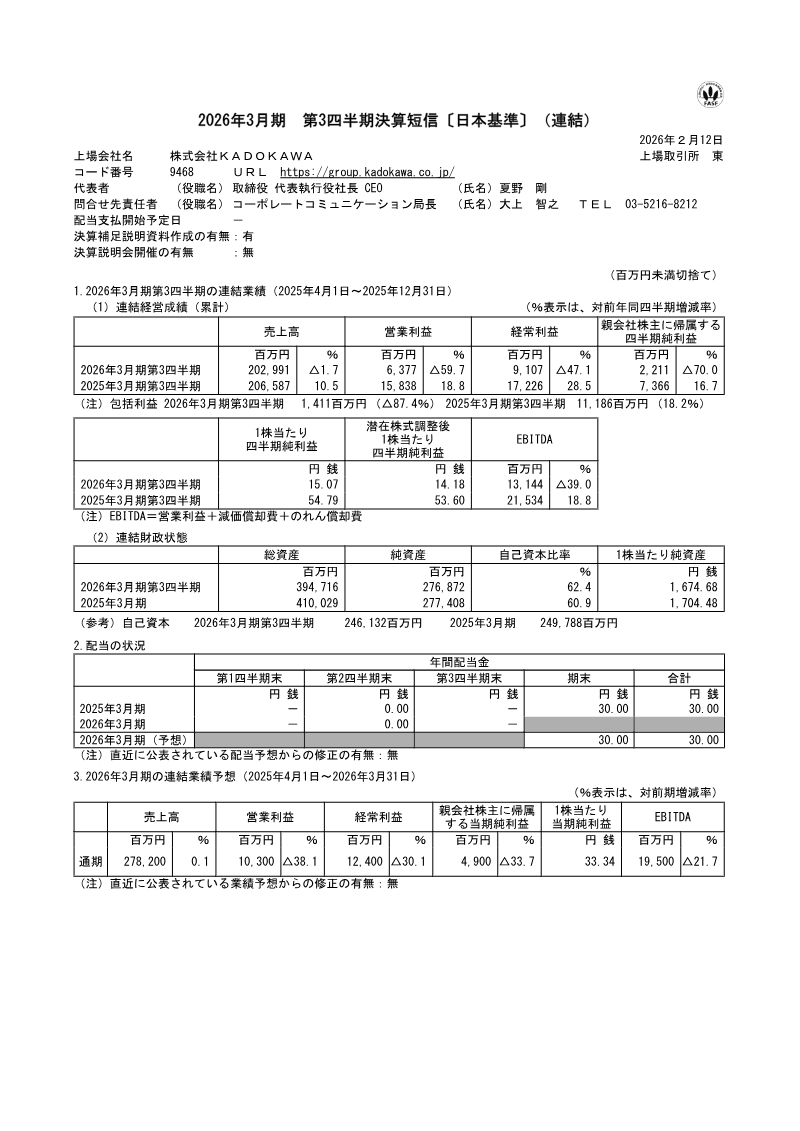
KADOKAWA’s financial performance for the nine-month period ending December 31, 2025, reflects a period of significant contraction, characterized by a 1.7% decline in net sales and a 59.7% collapse in operating profit. This downturn stems from difficult year-over-year comparisons against previous major title successes, rising operational costs, and the lingering impact of past cyberattacks. The Publication/IP Creation segment experienced the most acute pressure, with operating profit falling by 90.2% as the company increased investments in digital manufacturing, logistics, and human capital while facing a decrease in sales scale per individual title.
The company’s diversified business model provided some stability, as the Web Services and Education/EdTech segments emerged as key growth drivers. Specifically, the N High School Group reported a 10% increase in student enrollment, highlighting the resilience of the education division. Conversely, the Animation/Film and Gaming segments struggled, with international net sales declining by 16.6% due to a shift in the release slate toward new adaptations rather than established, high-performing franchises.
To address these systemic challenges, KADOKAWA is currently executing comprehensive business reforms, including organizational streamlining and aggressive cost-optimization strategies. Management remains focused on long-term recovery, prioritizing the secondary utilization of intellectual property and leveraging a robust pipeline of animation sequels and major titles to bolster performance in the final quarter and the upcoming fiscal year. By balancing immediate fiscal discipline with continued investment in core IP development, the company aims to stabilize its margins and restore profitability across its global operations.

Kadokawa Corporation · 2026
Kadokawa Corporation · 2026
Kadokawa Corporation · 2026
Kadokawa Corporation · 2026
Kadokawa Corporation
Kadokawa Corporation
Kadokawa Corporation
Kadokawa Corporation
Kadokawa Corporation
Kadokawa Corporation
Kadokawa Corporation
Kadokawa Corporation
Capcom · 2026

Capcom Co. · 2026

Capcom · 2026

Sony Group Corporation · 2026
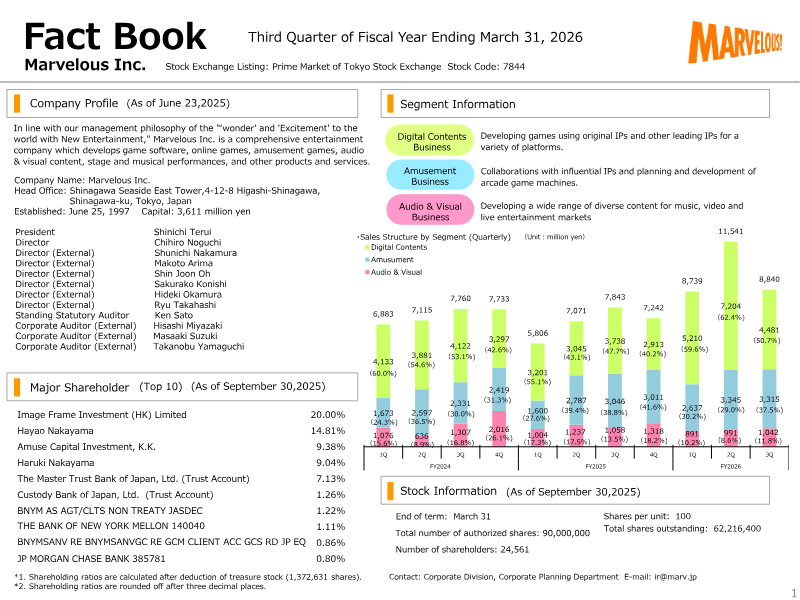
Marvelous · 2026
Square Enix · 2026
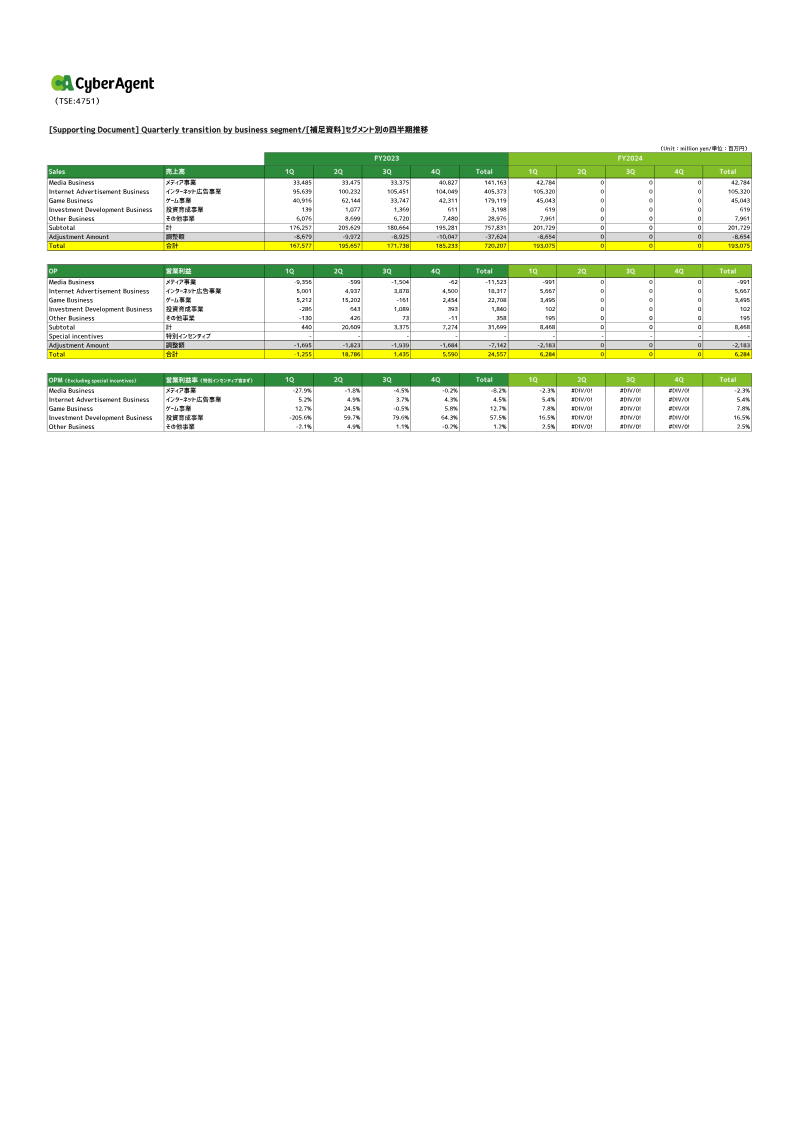
CyberAgent · 2026
Square Enix · 2026
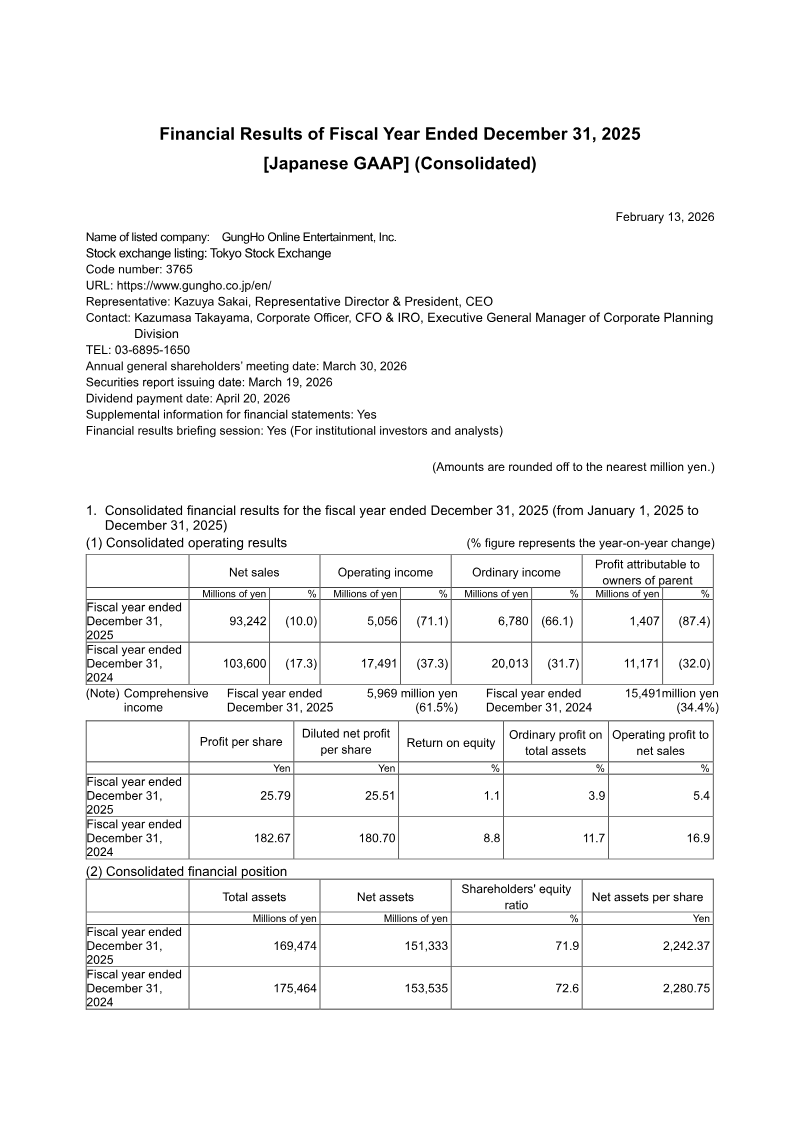
GungHo Online Entertainment · 2026
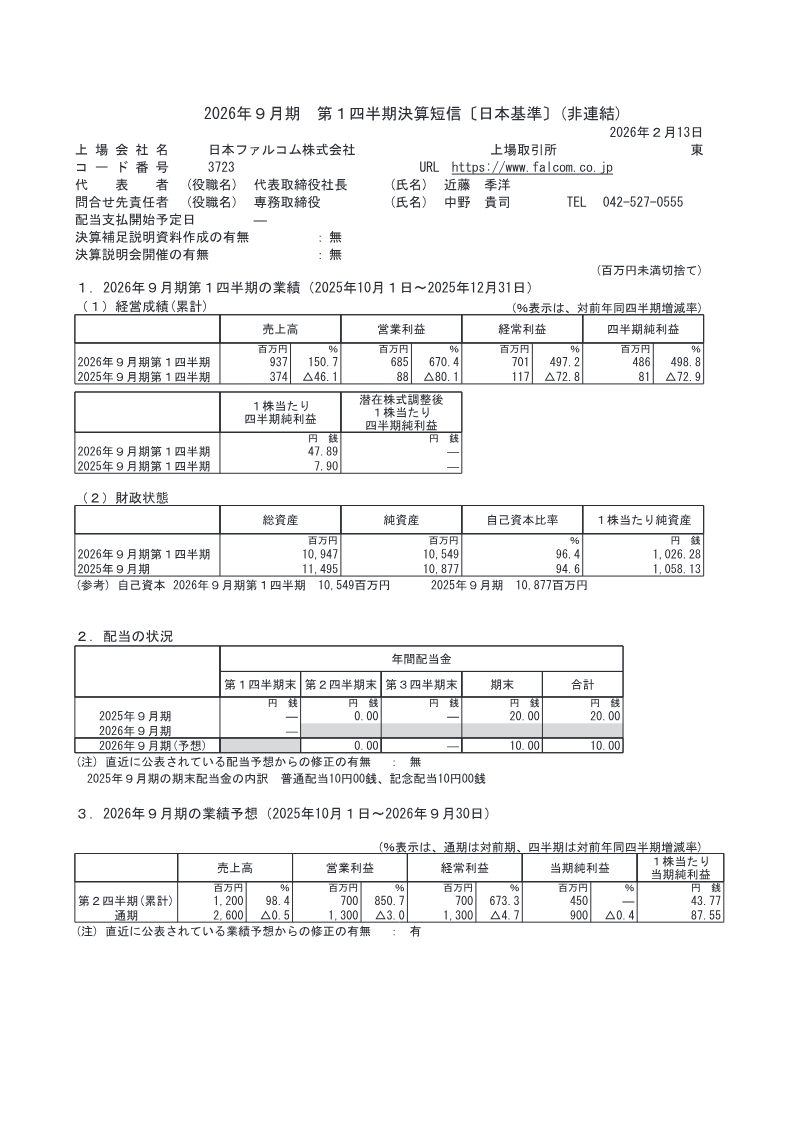
Nihon Falcom Corporation · 2026
Sega Sammy Holdings · 2026
Akatsuki · 2026