VideoTwo & a Half Gamers
📊 Creative Optimization Masterclass: Creative ROI & Scaling Across Networks
2 Oct 20258 min video
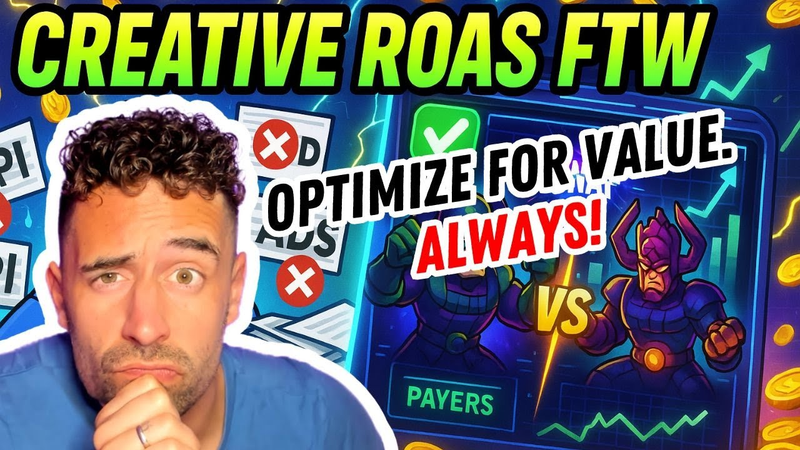
What if I told you that, right? But I mean, you're already looking at the creative level ROS, right? So, here's how the dashboard makes it super super easy and very clear. I select in here multiple different KPIs because you roll with those coins jack ups. We're the two and a half gamers, the midnight crew talking UAS and game design too. Mate, feel shaku bringing the insight. We're rocking those vibes till the early daylight. Master eyes on the prize tracking data through the cyber space skies. Felix stacks colors like a wizard in disguise. Jacks lift us to the high. Two and a half gamers talking smack. Slow hockey sick got your back. Ads are beautiful. They like the way. Click it fast. Don't delay. Uhhuh. Uhhuh. Uh-huh.
Hello, hello, hello. My name is Matthew Lancherich and welcome again. Today, uh, this is a solo episode and I'm going to talk about creative ROI and scaling across different networks. So, here's the truth. Not all installs are created equally. Some users install the game, they open once and vanish. Others stick pen and become your payers or whales. So today I will show you how Apps Slider creative optimization tool connects each and every creative not just installs but also retention and most importantly ROI as well. All the inapp events you can think of. Let's use Marvel Snap ads to see why some of the players bring only installs and some of the players actually bring revenue. So we have two ads. One ad brings,000 installs and one
ad brings 700 installs. But what what we are looking at here? So looking at the great conversion rate or CTR or just the install just uh spent. Well, there's more obviously. Is the CPI really important? H maybe, maybe not. Most of the dashboards would say, "Okay, so we have low lower CPI in here. The that should be the winner." But that's not the only thing that we we care about, is it? No, it's not. Uh because I want to always know what's the quality of the users on the creative level. So here we are uh looking at uh the level 18. We can have a level whatever else. We can have a level 13, level 18. obviously the number of purchases. What's the cost per action or the cost per purchase here and most importantly the the ROI because you know we're looking at the long-term ROAS numbers rather than just installs. What if I told you that, right? But I mean you're already looking at the creative
level ROS, right? So here's how the dashboard makes it super super easy and very clear. I select in here multiple different KPIs because you can you can use the different metrics. Obviously you can have the draws 14 or inapp events level three level five tutorial completion level level 15 whatever else that you can you can track uh also the the different partner metrics it doesn't matter and just hit apply and then you will have all of these inside your creative table. Yeah, amazing, right? So, the tool lets me slice it by any inapp events as I mentioned level 15 purchasers any like any other milestones. So, you can actually judge creatives by what matters to the business, not just clicks or installs or conversion rate or the CPIs. The most important part is the CPI needs to be all lower than the LTV. And that's
that's how we measure the creative success. Again, what's happening here? instead of the the chasing the cheap CPIs, you prioritize the creatives with high value players, which also bridges the the UA and the product teams. So imagine telling your designers, you know, uh this can creative and it's getting installs, but actually Galactus right here is actually getting pairs. So let's make more of these. Suddenly your creative strategy aligns with the lifetime value, not the vanity metrics like installs. Not the not that bad, right? But there's another question. How many hours do you waste every week pulling the creative reports for the team? Be honest. What if instead of just exporting all of these spreadsheets, you can actually spend time brainstorming and brainstorming the next winning creative? Well, look, you have all of I already started sharing this at the very beginning. Slayer helps you scale across also different networks and make UA creative collaboration very smooth. So, you don't really need to ask a lot of
different questions. is you just share the dashboards with your creative team. So let's say right now for Marvel Snap we run only mostly Facebook, Tik Tok and Google but next quarter I want to scale on Apploving or Mo or whatever else. Normally that means new workflows and sometimes new headaches but with apps it's quite seamless. So the dashboard pulls all the the new networks as soon as you integrate them in the integration section and matches them with the creative well the existing creatives in one unified view. So no matter the ch channel your creatives are tracking consistently which is future proof. Look here we have the Facebook ads. If we click on here go here Facebook and Tik Tok at the moment. Here this one also it's running on Facebook and Tik Tok. So when I add up loving mo or everything else then it's going to be another UI channel which says up. So quite quite interesting. So now the collaboration
the UI managers and motion designers all of them live in a different universes but with this creative gallery view you can see the same thing with the actual thumbnails right here performance metrics and you can even play the ad right here in the dashboard. So in a team meeting instead of debating and you can say you know here's the top top ad which is the galacus and look at the first 5 seconds that's what's working. Let's do let's do more of that. So no more endless requests for like hey can you send me the performance by theme by hook and whatever else. The data is actually live and it's always ready in here. So let's recap. uh scaling to new networks, zero extra hustle. Teams finally speak the same language with creatives and metrics side by side. You can you can see it all in dashboard. So uh more time for brainstorming sessions. Also instas are nice. The retention and tell the real story is all that matters.
Apps Slier links the creatives uh links creatives directly to inapp events so you know which ad deliver delivers the the best quality players and which ads deliver the best rows. You don't always optimize for volume. You always optimize for value aka rowas. So for Marvel Snap, this means the UA and creative teams can sit down, see the same insights and plan the next campaign together. If you're ready to ditch the reporting hell and spend more time building ads, hit the link in the in the show notes, book the demo with Absler. Don't forget, subscribe for more UA insights because this in this business, collaboration is an optional. It's your competitive edge. Thank you very much for listening. See you next time. Bye-bye. Heat. Heat. [Music]
[Music] [Applause] [Music]
Auto-generated captions from YouTube — names and numbers may be misheard.
The primary objective of modern user acquisition (UA) is to shift focus from vanity metrics, such as install volume and click-through rates, toward creative-level return on investment (ROI) and lifetime value (LTV). The core thesis is that high-volume installs are often misleading; true success is defined by identifying which specific creatives drive high-quality users, such as payers or those who reach specific milestones like level 15 or tutorial completion. By aligning creative strategy with long-term return on ad spend (ROAS), developers can optimize for business value rather than mere traffic volume.
Key findings emphasize that cost-per-install (CPI) is an insufficient metric for determining campaign success. Instead, UA managers should utilize unified dashboards that map creative assets directly to in-app events and revenue data. This approach allows teams to distinguish between ads that generate high install counts and those that actually convert into profitable players. Furthermore, the integration of multi-network data—such as Facebook, TikTok, Google, AppLovin, and Moloco—into a single, consistent view eliminates the need for manual spreadsheet consolidation and ensures that performance data remains accurate across different platforms.
Methodologically, the approach relies on granular, creative-level tracking that bridges the gap between UA managers and motion designers. By providing a centralized creative gallery that displays thumbnails, playback capabilities, and live performance metrics, teams can move away from subjective debates and toward data-driven decision-making. This workflow reduces the time spent on reporting, allowing teams to focus on brainstorming and iterating on successful creative hooks. Ultimately, the ability to scale seamlessly across networks while maintaining a clear view of ROAS serves as a critical competitive advantage in the mobile gaming industry, ensuring that marketing spend is directed toward high-value users rather than wasted on low-retention traffic.

Two & a Half Gamers · 2026

Two & a Half Gamers · 2026

Two & a Half Gamers · 2026

Two & a Half Gamers · 2026
Two & a Half Gamers · 2026

Two & a Half Gamers · 2026
Two & a Half Gamers · 2026

Two & a Half Gamers · 2026

Two & a Half Gamers · 2026
Two & a Half Gamers · 2026

Two & a Half Gamers · 2026

Two & a Half Gamers · 2026
Two & a Half Gamers · 2026
Naavik · 2026

Two & a Half Gamers · 2026

Two & a Half Gamers · 2026
Two & a Half Gamers · 2026
Two & a Half Gamers · 2026
Deconstructor of Fun · 2026
Deconstructor of Fun · 2026
Two & a Half Gamers · 2026

Two & a Half Gamers · 2026

Two & a Half Gamers · 2025
Two & a Half Gamers · 2025
Comments