FinancialGungHo Online Entertainment
Partial Correction of Financial Results for Fiscal Year Ended December 31, 2025: Japan
4 pages~6 min full read
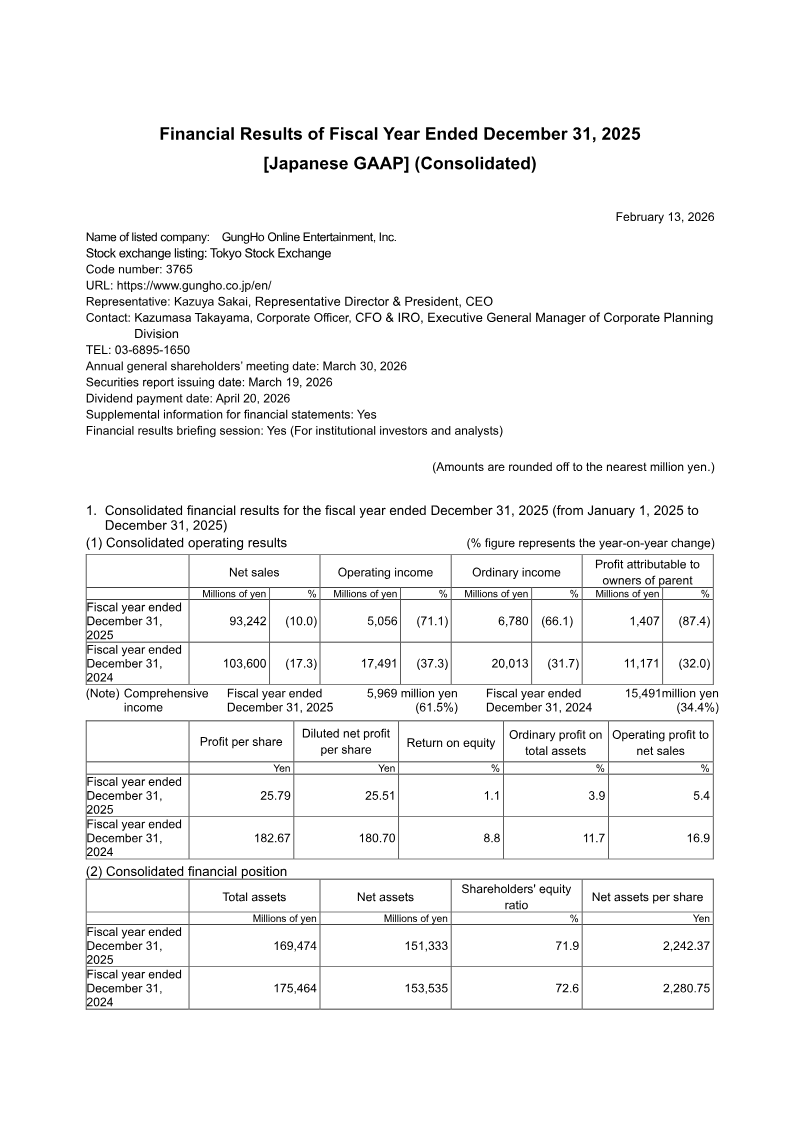
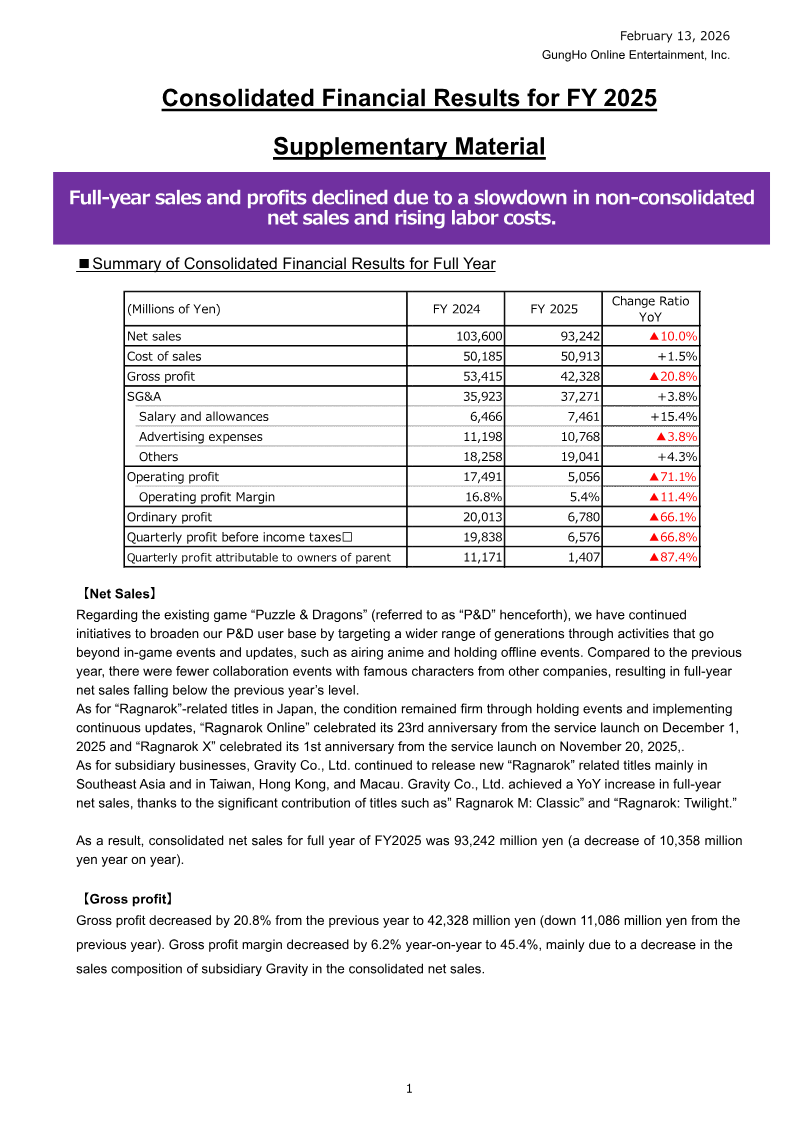
GungHo Online Entertainment, Inc. issued a formal correction to its consolidated financial results for the fiscal year ending December 31, 2025, originally disclosed on February 13, 2026. The primary purpose of this update is to rectify errors identified within the Consolidated Statement of Cash Flows. The company attributed these discrepancies to the application of incorrect foreign exchange rates and other related calculation inaccuracies.
The revisions specifically impact the cash flows from operating activities for the 2025 fiscal year. Previously reported figures indicated that the company generated 149 million yen from operating activities; however, the corrected data reveals that the company actually used 355 million yen for these activities. This shift is largely driven by an adjustment to income taxes paid, which increased from 4,804 million yen to 6,607 million yen, alongside various adjustments to trade receivables, consumption taxes, and other current liabilities.
Despite these changes to the operating cash flow components, the final balance of cash and cash equivalents at the end of the year remains unchanged at 31,021 million yen. The corrections also include a revision to the effect of exchange rate changes on cash and cash equivalents, which was adjusted from 203 million yen to 707 million yen. These updates ensure the accuracy of the company’s financial reporting under Japanese GAAP for the 2025 period.
GungHo Online Entertainment · 2026
GungHo Online Entertainment · 2026
GungHo Online Entertainment · 2026
GungHo Online Entertainment · 2026

GungHo Online Entertainment · 2026

GungHo Online Entertainment · 2026
GungHo Online Entertainment · 2026
GungHo Online Entertainment · 2024
GungHo Online Entertainment
GungHo Online Entertainment
GungHo Online Entertainment
GungHo Online Entertainment
Capcom · 2026

Capcom Co. · 2026

Capcom · 2026

Sony Group Corporation · 2026
Marvelous · 2026

Square Enix · 2026
CyberAgent · 2026
Square Enix · 2026
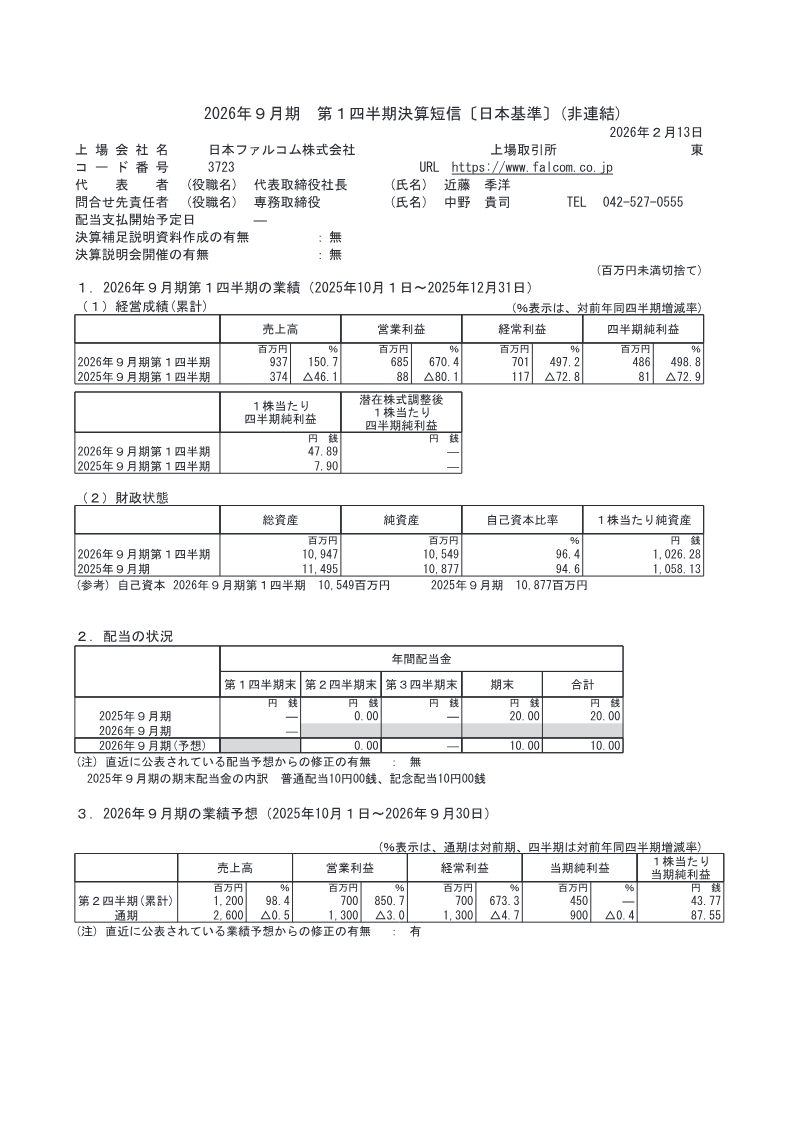
Nihon Falcom Corporation · 2026
Sega Sammy Holdings · 2026
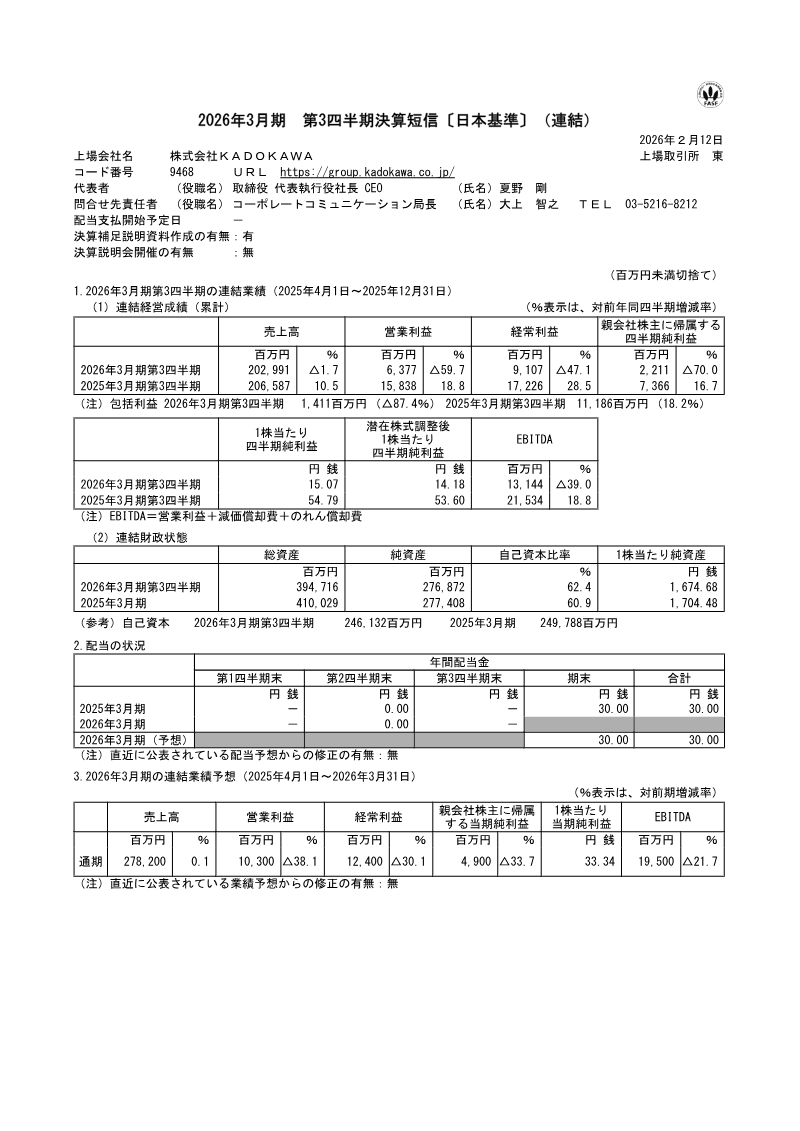
Kadokawa Corporation · 2026
Akatsuki · 2026