Related Documents


Report
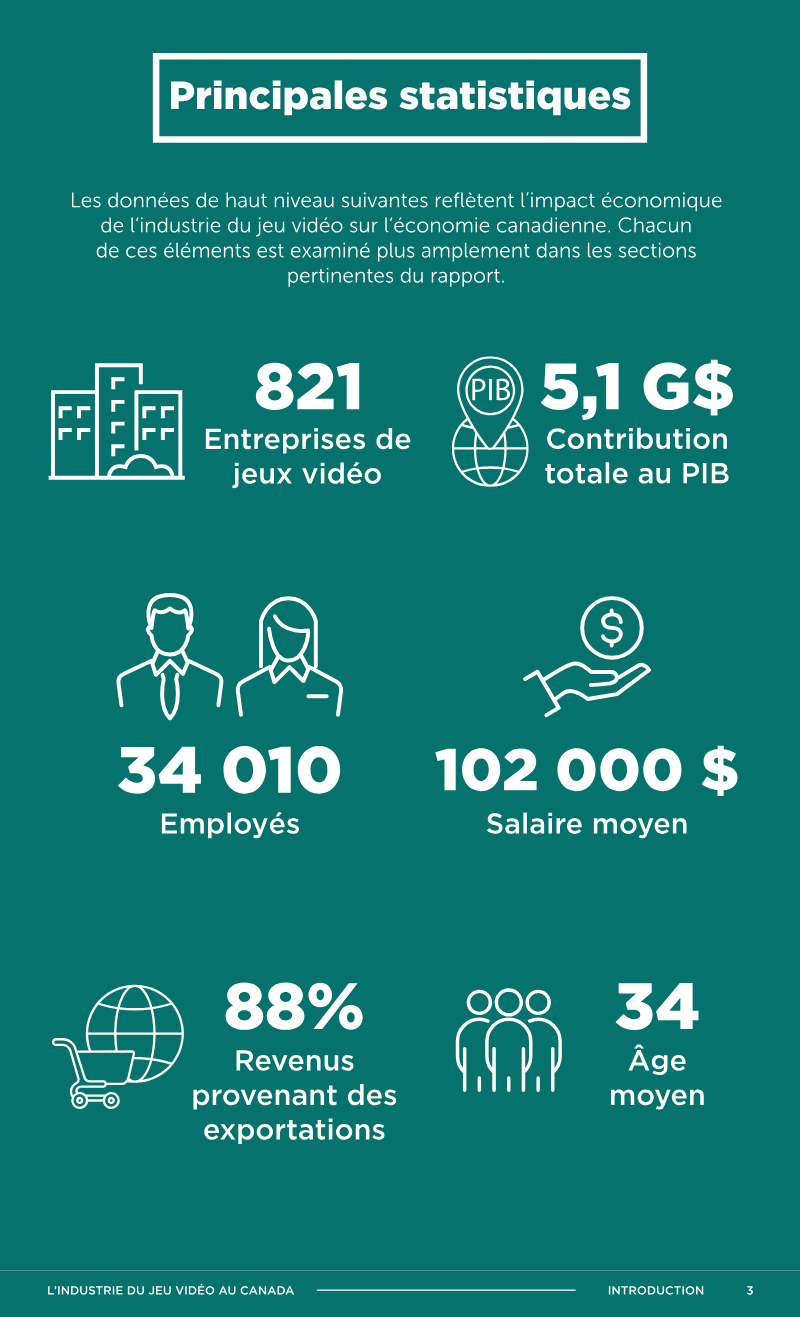
L'Industrie du Jeu Vidéo au Canada
The 2024 Canadian video‑game sector is presented as a mature, high‑value industry that contributes $5.1 billion to national GDP and sustains 34 010 full‑time‑equivalent positions, with an average compensation of $102 000. The analysis underscores a pronounced geographic concentration, as 83 % of the 821 operating studios are located in Ontario, British Columbia and Québec, reflecting the continued clustering of talent and infrastructure in these provinces. Compared with 2021, the total number of firms declined by 9 %, a contraction driven largely by the disappearance of micro‑enterprises, while larger studios either remained stable or expanded. Ownership patterns have shifted markedly, with foreign‑owned companies now accounting for 88 % of total employment, indicating deepening international integration and reliance on external capital. Industry spending reached $4.8 billion in 2024, an 11 % increase over the 2021 level, and labour costs now represent 72 % of total expenditures, up from roughly 66 % three years earlier. This rising labour share highlights the sector’s intensifying dependence on skilled human capital. The study classifies studios into eight size categories—from solo developers to firms with more than 200 employees—using survey‑derived averages to estimate spending, revenue and wage structures across each segment. By scaling these averages to the number of firms in each tier, the analysis provides a nuanced picture of economic activity across the full spectrum of the industry. Overall, the findings portray a Canadian video‑game ecosystem that is consolidating around a few large, often foreign‑owned players, expanding its overall financial outlays, and increasingly reliant on a highly paid workforce, all within a geographically limited core that dominates national output.
ESAC – Entertainment Software Association of CanadaJan 2024

Report
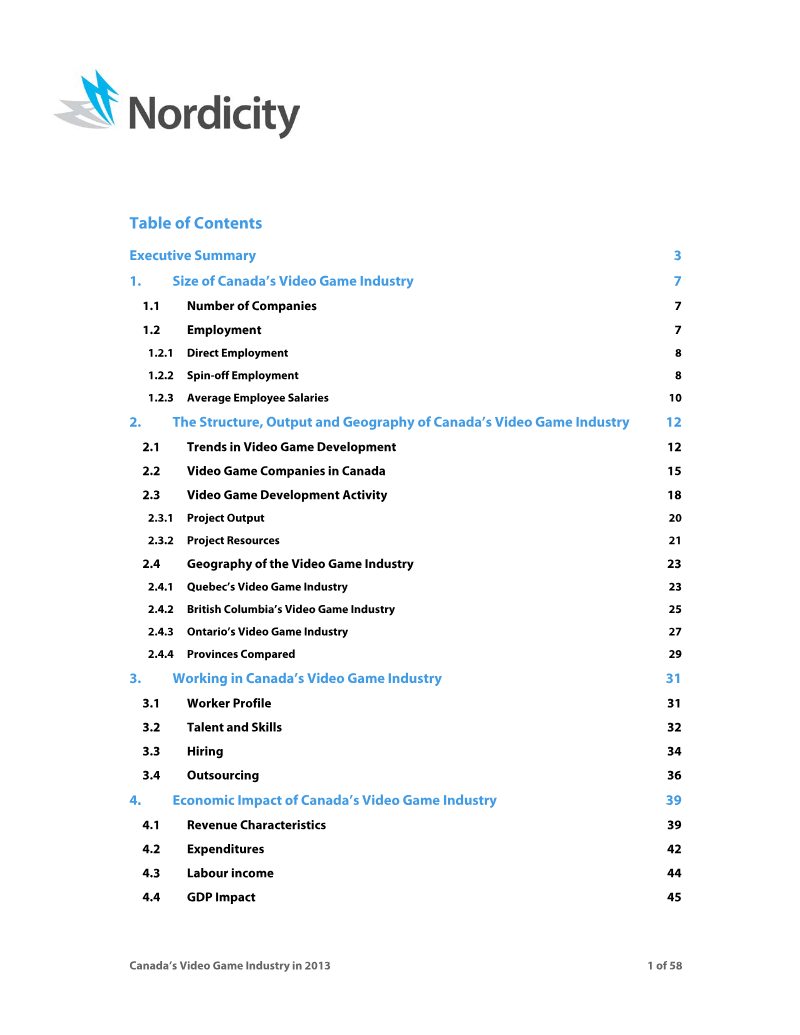
Canada's Video Game Industry in 2013: Final Report
**Canada’s Video Game Industry in 2013 – Final Report (Summary)** --- ### 1. Industry Perception of Tax Credits - **Overall valuation:** Canadian video‑game tax credits received an **average rating of 4.4 / 5**, indicating that firms consider them a highly valuable policy tool. - **Key benefits identified:** - **Project opportunities:** Highest impact score (**4.0 / 5**). - **Employee retention, revenue growth, and industry visibility** also scored strongly, reflecting that tax incentives help companies keep talent, expand sales, and raise the sector’s profile. - **Cost‑effectiveness:** Respondents reported that the **administrative burden is low relative to the financial value** they obtain from the credits. - **Growth outlook:** The survey revealed a **very optimistic near‑term outlook**: **40 % of firms expect revenue growth of more than 25 %** in the coming year, underscoring confidence that the tax environment is a catalyst for expansion. --- ### 2. Economic‑Impact Analysis | **Component** | **Methodology** | **Key Findings** | |---------------|----------------|------------------| | **Direct impacts** | • Calculated from reported industry revenues and wages.<br>• Applied an **operating‑surplus‑to‑labour‑income ratio of 15.17 %** (derived from the broader software‑publishing sector) to estimate profits and value‑added. | • Direct employment, labour income, and GDP contributions were quantified based on actual firm‑level data. | | **Indirect impacts** | • Integrated the survey data with **Statistics Canada Input‑Output (I‑O) tables**.<br>• Modeled supply‑chain spillovers, capturing purchases from other Canadian industries and adjusting for **import leakages** (goods/services sourced abroad). | • Showed how video‑game firms stimulate activity in supporting sectors (e.g., hardware, professional services, marketing). | | **Induced impacts** | • Used a **custom multiplier** built on Canada’s **marginal propensity to consume (MPC)** and **marginal propensity to import (MPI)**.<br>• Estimated household re‑spending of earnings generated in the direct and indirect stages. | • Quantified the additional employment, income, and GDP generated when workers and suppliers spend their wages locally. | **Overall economic contribution (direct + indirect + induced):** - The combined effect demonstrates that the video‑game sector’s footprint extends well beyond the firms themselves, creating **significant ancillary jobs and income** throughout the Canadian economy. - The methodology ensures that **import leakages are subtracted**, providing a realistic picture of net domestic impact. --- ### 3. Implications 1. **Policy Validation** – The high satisfaction scores and strong growth expectations confirm that the tax‑credit regime is achieving its intended objectives: fostering project development, retaining talent, and boosting sector visibility. 2. **Economic Multiplier Effect** – The I‑O‑based analysis shows that every dollar of direct video‑game revenue generates additional economic activity across multiple industries, reinforcing the argument for continued or expanded fiscal support. 3. **Strategic Recommendations** (derived from the findings): - **Maintain or enhance tax‑credit levels** to sustain the momentum in project creation and revenue growth. - **Streamline administrative processes** further to keep the cost‑benefit ratio favorable.
ESAC – Entertainment Software Association of CanadaJul 2013

Report
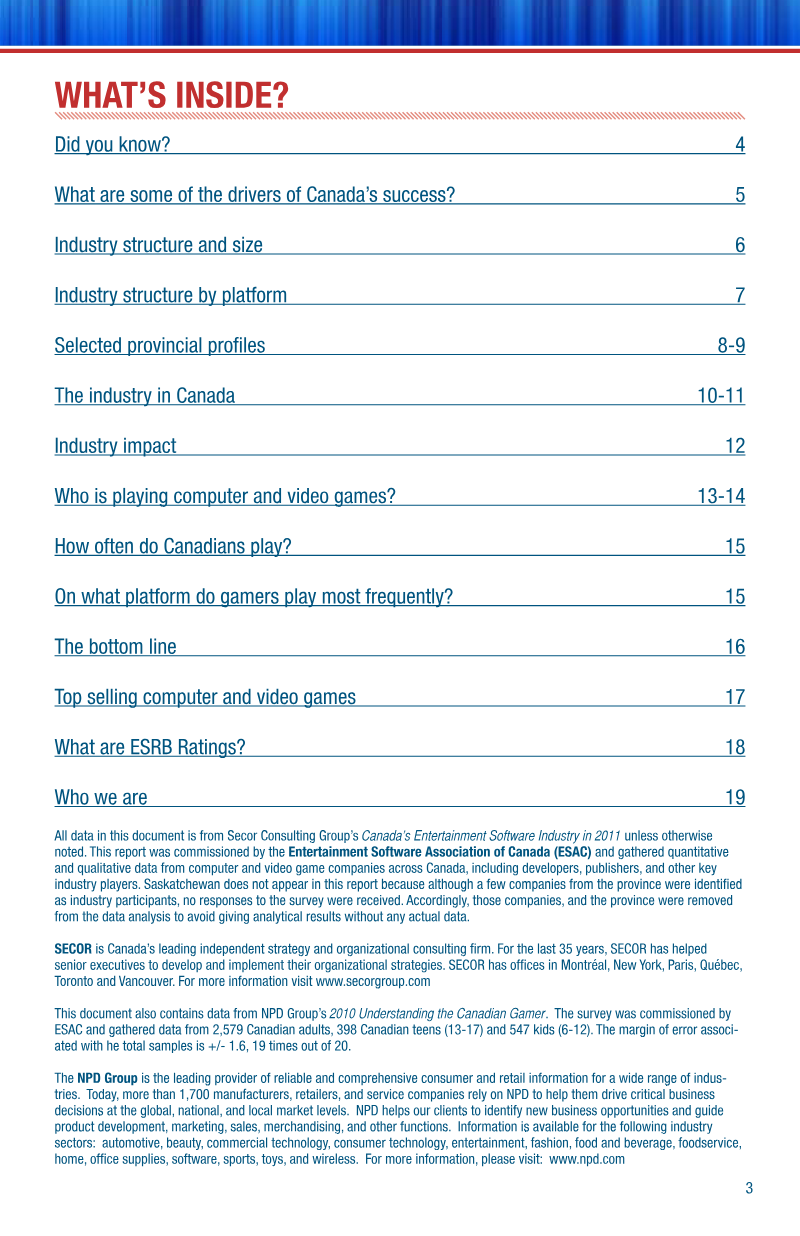
Essential Facts: About the Canadian Computer and Video Game Industry
The 2011 overview of Canada’s entertainment software sector presents a comprehensive portrait of an industry that employs roughly 16,000 people across nearly 350 firms and generates an estimated $1.7 billion in direct economic impact. Growth has accelerated, with an 11 % increase in size over the previous two years and a projected 17 % expansion in the next two‑year horizon, underscoring the sector’s rising significance within the national economy. Industry composition is diverse: 59 % of employment resides in large firms (over 150 staff), while small and medium enterprises account for the remainder, averaging 16 employees each. Traditional console development remains dominant, absorbing 68 % of the workforce, though resources for social (2 %), casual (2 %) and mobile (7 %) gaming are expanding rapidly. Development costs vary by platform, with traditional console projects averaging C$10.1 million and mobile titles around C$0.17 million, reflecting differing risk and time‑to‑market profiles. Provincial analysis highlights Quebec as the primary hub, hosting 86 companies, 8,236 employees and $733 million in spending, and achieving a 13 % annual growth rate. Ontario follows with 96 firms, 2,600 staff and $238 million in revenue, posting 20 % historical growth and 21 % expected expansion. British Columbia, with 83 companies and 3,882 employees, records flat recent growth but anticipates a 10 % rebound, while Saskatchewan is excluded due to lack of survey responses. Consumer insights from a 2,579‑adult, 398‑teen and 547‑child NPD sample reveal that
ESAC – Entertainment Software Association of CanadaJan 2011


Report
Essential Facts 2014: Canada
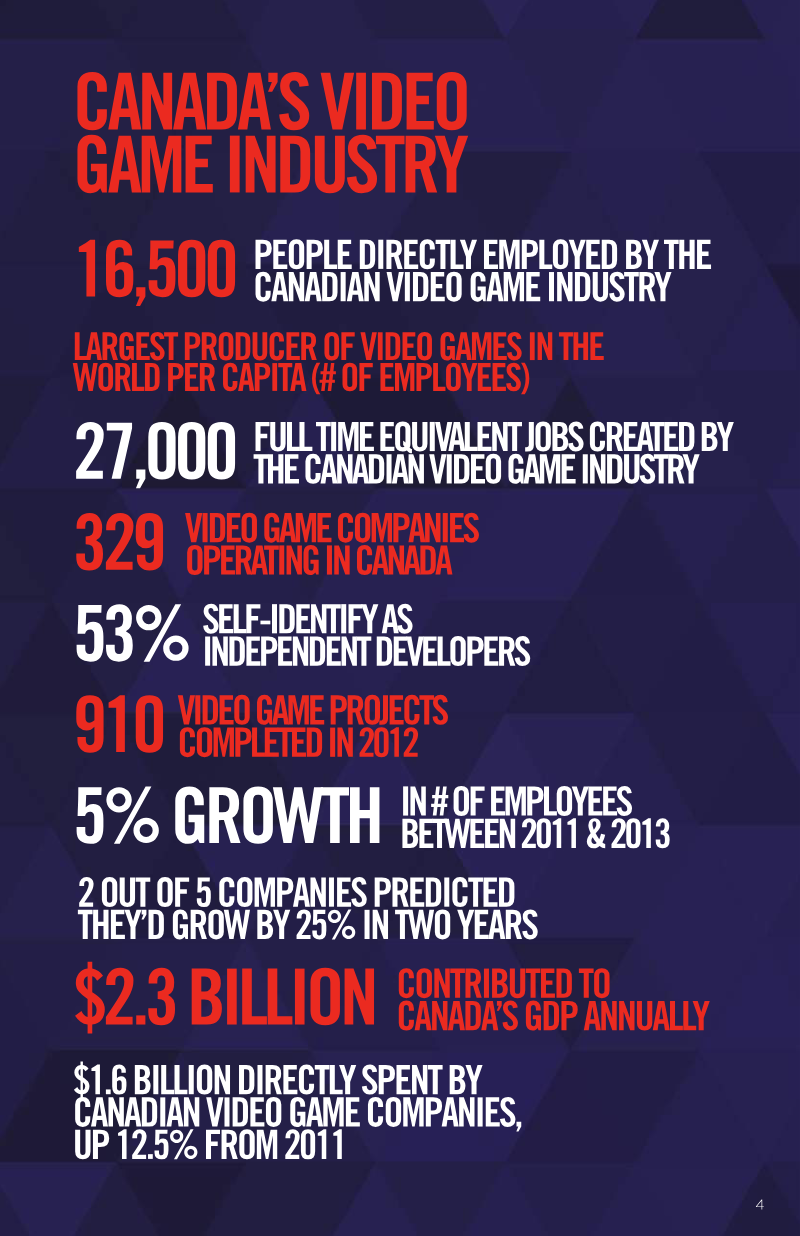
The 2014 overview of Canada’s video‑game sector presents a comprehensive picture of an industry that ranks among the world’s largest by per‑capita employment and is a cornerstone of the nation’s digital economy. Drawing on custom research commissioned by the Entertainment Software Association of Canada (ESAC)—including NPD surveys of 3,359 adults and 526 teens in 2014, a 2012 survey of 2,969 adults, 527 teens and 687 children, and quantitative data from 90 Canadian companies—the analysis covers national trends, regional breakdowns, workforce characteristics, public perception and consumer behaviour. Employment figures reveal 16,500 individuals directly working in game development, equivalent to 27,000 full‑time jobs, with a 5 % increase in staff between 2011 and 2013 and two‑fifths of firms forecasting a 25 % expansion within two years. The sector generated $2.3 billion in GDP contribution and $1.6 billion in direct spending, a 12.5 % rise from 2011. More than half of Canadian companies identify as independent developers, and 53 % of the 329 firms operate as such. Salaries average $72,500 annually, with a median employee age of 31,
ESAC – Entertainment Software Association of CanadaJan 2014