Key insights
6 slides
Key number
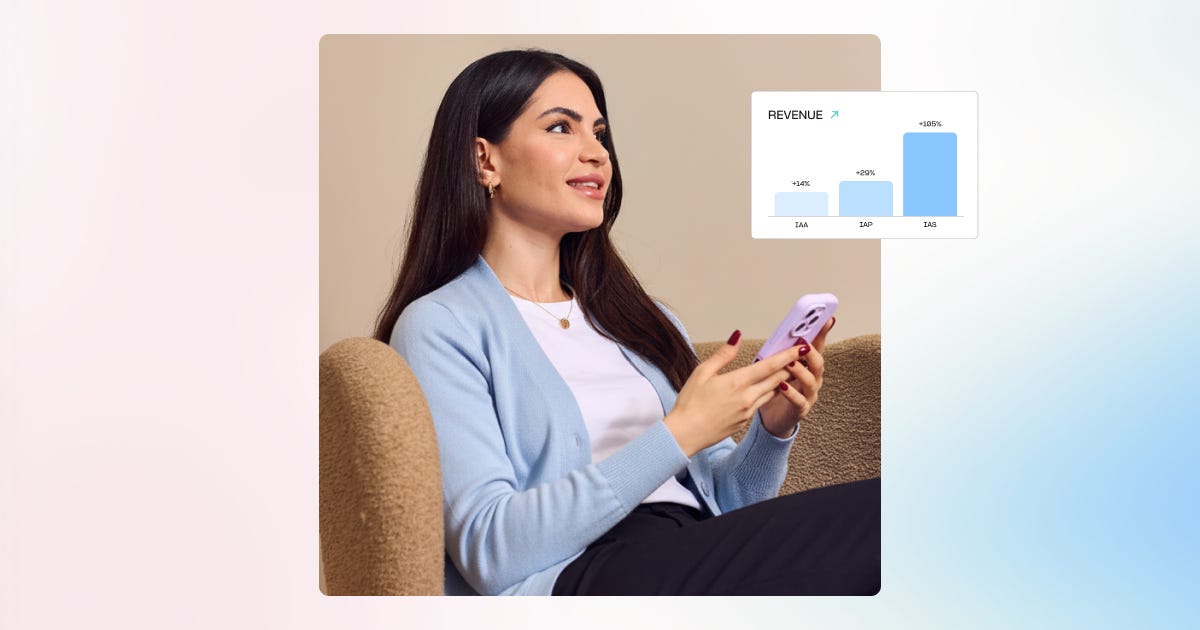
Subscription revenue grew 105% in Q1 2026.
Subscription revenue doubled year-over-year in Q1 2026. IAP and advertising grew 29% and 14% respectively.
What changed
Subscription share rose from 4% to 7% in blended games.
In games that blend all three models, subscription share climbed from 4% to 7%. Advertising fell from 63% to 56%.
Share shift. Subscription revenue grew from 4% to 7% of total revenue in blended games.
Key number
Casino titles lead D90 IAP ARPU at $2.43 globally.
Casino titles lead in D90 IAP ARPU at $2.43 globally. Non-gaming apps achieve a comparable $2.32 globally.
$2.43
Global D90 IAP ARPU for casino titles
- Global D90 IAP ARPU for non-gaming apps
- $2.32
- NA/Europe D90 IAP ARPU for casino titles
- $2.66
Traffic source
Paid installs drive 59% of all gaming IAP revenue.
Paid installs drive the majority of gaming revenue, accounting for 59% overall. Hypercasual games see 79% of payments from paid traffic.
Conversion rates
Non-gaming apps convert 9.84% of installs to first-time purchasers.
Non-gaming apps convert 9.84% of installs to first-time purchasers within 30 days. They outperform games across all categories.
9.84%
Install-to-first-time-purchaser conversion for non-gaming apps
- Install-to-first-time-payer conversion for casino games
- 4.95%
- First-purchase conversion in North America
- 11.14%
Revenue timing
Advertising delivers 57% of a game’s D60 revenue on Day 1.
Advertising dominates early days, delivering 57% of a game’s D60 revenue on Day 1.
57%
Share of D60 advertising revenue generated on Day 1
- Share of D60 advertising revenue generated by Day 7
- 89%
- Day 1 share for hypercasual games
- 63%
1 / 6
Ask AI about this report