AppsFlyer
Research5 documents
Documents
Article
State of Creative Optimization 2026
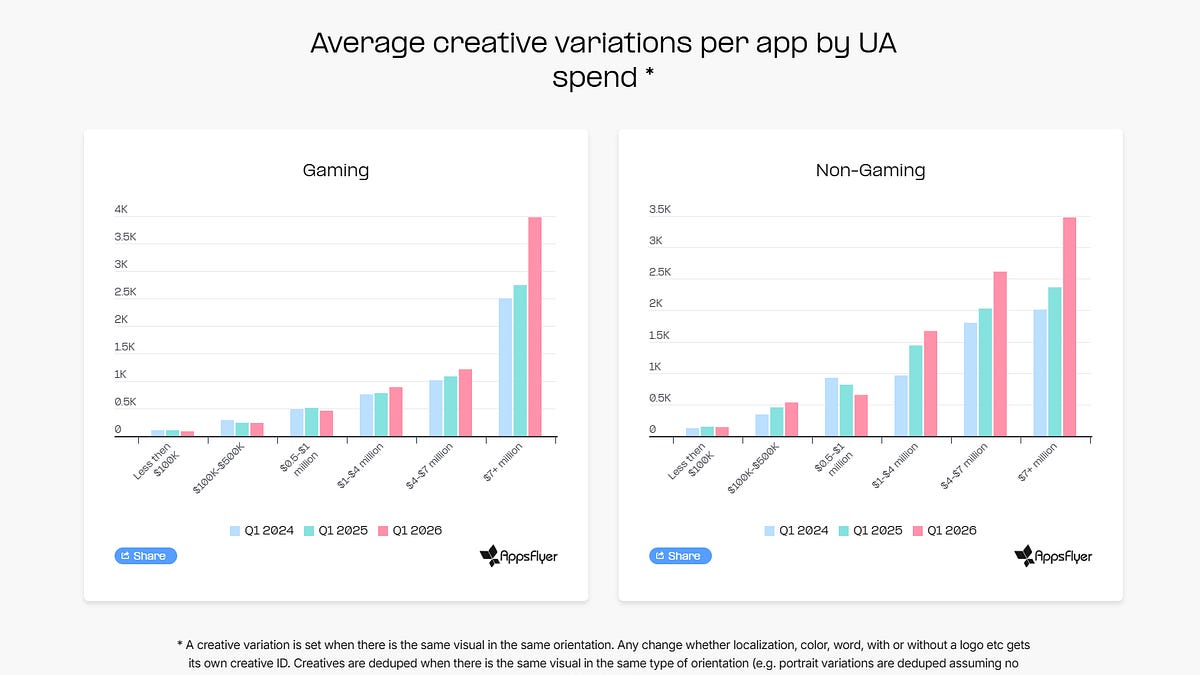
The 2026 landscape of creative optimization in mobile gaming is defined by a widening gap between high-spending "whale" advertisers and smaller market participants. While top-tier gaming apps—those spending over $7 million per quarter—increased their creative output by 45% year-over-year to an average of 3,977 variations, smaller advertisers saw their output remain flat or decline. This surge in volume is largely driven by AI-assisted micro-iterations, such as localization, resizing, and copy swaps, rather than a proportional increase in unique creative concepts.
Data indicates that the market is becoming increasingly winner-take-all. In gaming video, the top 2% of creatives now command 60.7% of total spend, up from 53.5% in the previous year. This concentration suggests that algorithmic ad networks are identifying and scaling winners with greater speed and efficiency, rendering "average" creative assets increasingly obsolete. Consequently, the primary challenge for marketers has shifted from simply increasing production volume to accelerating the speed at which they can test, identify, and scale high-performing concepts.
The analysis further highlights a critical divergence between video and static creative strategies. Attributes that drive performance in video, such as social proof in puzzle games, often fail to translate to static formats, which require distinct creative briefs and testing loops. Effective static strategies prioritize immediate, single-glance impact—focusing on urgency, adrenaline, or specific promotional offers—whereas video remains the primary vehicle for storytelling and gameplay demonstration. Ultimately, the industry is moving toward a model where success depends on robust infrastructure for automated testing and a clear separation between concept development and high-volume, AI-driven asset production.
- The top 2% of gaming video creatives now command 60.7% of total spend, up from 53.5% in early 2025, indicating that algorithms are increasingly concentrating budgets on fewer winners.
- Large gaming apps spending over $7M per quarter increased their creative variations by 45% year-over-year, reaching an average of 3,977 variations per app, while smaller advertisers saw flat or declining output.
- The surge in creative volume is driven primarily by AI-assisted localization, resizing, and copy swaps rather than new conceptual ideas, as 'variation' counts include every minor iteration like logo toggles or language changes.
- Video and static assets require distinct creative strategies because attributes that drive performance in video—such as social proof—often fail to convert in static formats, which favor immediate, single-glance messaging.
- Production volume is not the primary bottleneck for smaller advertisers; the constraint is a lack of testing budget, as high variation counts without sufficient spend prevent algorithms from learning and identifying winning assets.
+3
AppsFlyerSept 2026

Article
App Monetization in 2026
The report examines mobile app monetization across the App Store and Google Play from January 2025 to March 2026, drawing on $900 million in verified IAP purchases, $800 million in subscription revenue, and $7.2 billion in advertising income. In Q1 2026 subscription revenue doubled year‑over‑year, rising 105 %, while IAP and advertising grew 29 % and 14 % respectively, confirming subscription as the fastest‑growing stream over the past fifteen months. Games that blend all three models saw subscription share climb from 4 % to 7 %, at the expense of advertising, which fell from 63 % to 56 %. In non‑gaming apps, subscriptions dominate but represent a smaller share of total revenue compared to games.
Key performance benchmarks reveal that casino titles lead in D90 IAP ARPU ($2.43 globally, $2.66 in NA/Europe) and D90 IAP ARPPU ($11.40), while midcore games follow closely. Non‑gaming apps achieve comparable D90 IAP ARPU ($2.32 globally, $2.79 in NA/Europe) and sit between casino and midcore games on ARPPU ($10.85). Advertising monetization is strongest in casual games (D90 IAA ARPU $0.55) and weaker in hypercasual segments.
Revenue accumulation patterns show advertising dominates early days, delivering 57 % of a game’s D60 revenue on Day 1 and 89 % by Day 7, whereas IAP and subscription lag behind. Paid installs drive the majority of gaming revenue (59 % overall, 79 % in hypercasual), whereas non‑gaming apps rely more on organic traffic, especially outside North America.
Conversion metrics indicate that non‑gaming apps convert 9.84 % of installs to first‑time purchasers and 4.64 % to repeat purchasers within 30 days, outperforming games across all categories. Casino games convert 4.95 % to first‑time payers, with a repeat‑payer ratio of 1.65×; midcore and casual games show slightly higher ratios. Regional analysis highlights North America’s superior conversion rates (11.14 % first‑purchase) compared to LATAM (6.51 %).
- Subscription revenue is the fastest-growing monetization stream, increasing 105% year-over-year in Q1 2026 across App Store and Google Play, compared to 29% for IAP and 14% for advertising revenue.
- Non-gaming apps demonstrate strong monetization per paying user, with a global D90 IAP ARPPU of $10.85, placing them between casino games ($11.40) and midcore games ($9.80).
- In games that combine all three monetization models, subscription revenue grew from 4% of total revenue in January 2025 to 7% in early 2026, largely at the expense of advertising revenue, which dropped from 63% to 56%.
- Paid installs are a significant revenue driver for gaming apps, accounting for 59% of all IAP revenue, with hypercasual games seeing 79% of payments from paid traffic.
- Non-gaming apps monetize users differently based on strategy; some monetize immediately, while others use trial periods, leading to varied benchmarks.
+3
AppsFlyerJun 2026
Report49 pages
Target. Connect. Engage: Driving Profitable App Growth with Revenue-Boosting Strategies
The primary purpose of the analysis is to demonstrate how a strategic partnership between a mobile measurement partner (MMP) and TikTok’s advertising ecosystem can unlock profitable growth for app marketers. By integrating real‑time attribution, privacy‑preserving measurement, and value‑based optimization, brands can accurately credit campaigns, reduce fraud, and maximize return on ad spend (ROAS) across the entire customer journey.
Key findings show that cross‑platform visibility is essential for identifying high‑value users and optimizing acquisition budgets, especially amid tightening privacy regulations on iOS and Android. AppsFlyer’s comprehensive measurement suite, combined with TikTok’s SKAdNetwork tools and self‑reporting network, delivers precise audience targeting and cost‑effective user acquisition. Case studies from Burger King, Casas Bahia, and Carrefour illustrate tangible results: a 7× ROI for coupon activations, a 44 % lift in conversion rates with a 55 % ROI gain, and a 29 % increase in in‑app revenue with triple the return compared to other channels.
The document outlines best practices for app install and retargeting campaigns, recommending the use of App Event Optimization (AEO) and Value‑Based Optimization (VBO) to focus spend on high‑value actions. Automated Smart Performance Campaigns and real‑time ROAS measurement via AppsFlyer integrations further enhance efficiency and lifetime value.
Geographically, the insights apply globally across major mobile markets, with a focus on the U.S., Europe, and emerging regions where TikTok’s user base is rapidly expanding. The time frame covers current privacy‑driven advertising environments and anticipates ongoing downturns, positioning the partnership as a resilient growth strategy for 2024‑2026.
- Integrating AppsFlyer’s measurement suite with TikTok’s advertising ecosystem enables brands to maximize ROAS through real-time attribution and privacy-compliant user acquisition.
- Case studies demonstrate significant performance gains, including a 7x ROI for Burger King, a 44% conversion lift for Casas Bahia, and a 29% increase in in-app revenue for Carrefour.
- App marketers should prioritize App Event Optimization (AEO) and Value-Based Optimization (VBO) to focus advertising spend on high-value user actions.
- Automated Smart Performance Campaigns and real-time ROAS measurement are recommended strategies to maintain growth and efficiency through 2026 despite tightening privacy regulations.
- Cross-platform visibility is essential for identifying high-value users and optimizing acquisition budgets across both iOS and Android environments.
+2
AppsFlyerJan 2025

Report25 pages
The State of Mobile Gaming in India: 2023
India’s mobile‑gaming ecosystem is experiencing rapid expansion, with a projected market value of $8.6 billion by 2027 and more than 600 million active users. Growth is fueled by affordable smartphones, low data costs, and a pandemic‑accelerated surge in casual, hyper‑casual, and real‑money titles. Install rates spiked up to 90 % during lockdowns, while in‑app purchase revenue is expected to reach $284 billion by 2026. To sustain this momentum, brands must deploy comprehensive customer‑engagement platforms that provide real‑time analytics, segmentation, and personalized push campaigns to enhance retention and monetization.
Push notifications and in‑app messaging prove critical for user engagement. Data shows a 3.34 % click‑through rate and up to 91 % delivery success for push alerts, while in‑app campaigns achieve 15–44 % conversion rates and a 38 % average on one million impressions. Segmentation techniques such as RFM, affinity profiling, and predictive AI models (e.g., Sherpa) enable targeted, omnichannel flows that reduce churn and lower acquisition costs—new customers cost five times more than retaining existing ones. App Store Optimization tools like AppTweak further amplify visibility; for instance, RummyCircle’s keyword strategy increased visibility by 14.2 % and drove a 200,000‑download spike after A/B testing.
Despite the market’s growth, brands face declining installs, stickiness, and revenue. The solution lies in data‑driven engagement: hyper‑personalized messaging powered by AI unlocks deeper customer insights, improves retention, and provides a competitive advantage. Platforms such as MoEngage, already trusted by Fortune 500 and internet‑first brands worldwide, offer the scalability required for publishers to thrive in India’s dynamic mobile‑gaming landscape.
- India’s mobile gaming market is projected to reach a value of $8.6 billion by 2027, supported by a user base of over 600 million active players.
- In-app purchase revenue in the Indian mobile gaming sector is forecasted to reach $284 billion by 2026.
- Retention is critical for profitability, as acquiring new customers is five times more expensive than retaining existing ones.
- Data-driven engagement tools are highly effective, with in-app campaigns achieving conversion rates between 15% and 44% and push notifications maintaining a 3.34% click-through rate.
- Advanced segmentation techniques, including RFM analysis and predictive AI models like Sherpa, are necessary to reduce churn and lower acquisition costs.
+5
AppsFlyerJan 2023
Report15 pages
The African Mobile Apps Landscape (2021)
The African mobile app market experienced a period of rapid acceleration between Q1 2020 and Q1 2021, driven by a young, mobile-first population and the unique conditions of the COVID-19 pandemic. Analysis of 6,000 apps and 2 billion installs across South Africa, Nigeria, and Kenya reveals that overall app installs grew by 41% during this period. Nigeria led this growth with a 43% increase, while South Africa saw the most immediate surge in downloads following strict lockdown measures.
The gaming sector proved particularly resilient, with installs jumping 50% in Q2 2020 as consumers sought home entertainment. This trend extended to monetization, as in-app advertising revenue surged by 167% between Q2 2020 and Q1 2021. Furthermore, in-app purchasing revenue peaked in Q3 2020, accounting for one-third of the year's total revenue. While Android remains the dominant platform with a 54% increase in non-organic installs, iOS also showed growth despite a 21% rise in cost-per-install.
Several structural trends define the current landscape, including the rise of fintech apps addressing the needs of unbanked populations and the emergence of super apps that consolidate multiple services to overcome device storage limitations. Despite this progress, challenges remain regarding connectivity, as mobile internet adoption in Sub-Saharan Africa stands at 26%, well below the global average. To succeed, marketers are encouraged to move toward a multi-moment maturity model by integrating durable measurement foundations, focusing on high-value user acquisition, and utilizing remarketing strategies to drive long-term engagement.
- Between Q1 2020 and Q1 2021, mobile app installs across Nigeria, South Africa, and Kenya grew by 41%, with Nigeria leading the growth at 43%.
- The gaming sector saw a 50% jump in installs during Q2 2020, while in-app advertising revenue for gaming surged by 167% between Q2 2020 and Q1 2021.
- In-app purchasing revenue for gaming peaked in Q3 2020, contributing one-third of the total annual revenue.
- Android remains the dominant platform with a 54% increase in non-organic installs, while iOS growth persists despite a 21% rise in cost-per-install.
- Market growth is driven by fintech apps serving unbanked populations and the adoption of super apps designed to mitigate device storage limitations.
+2
AppsFlyerJan 2021