Related Documents

Financial
Fact Book 2021
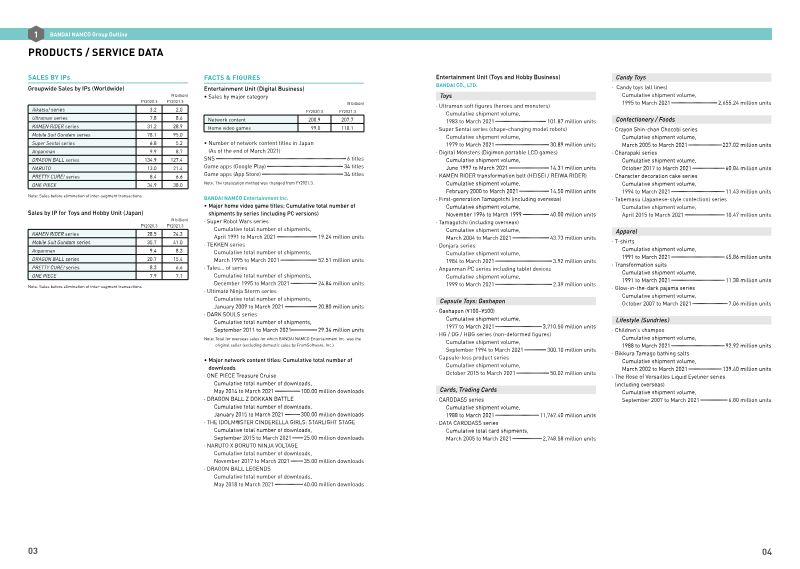
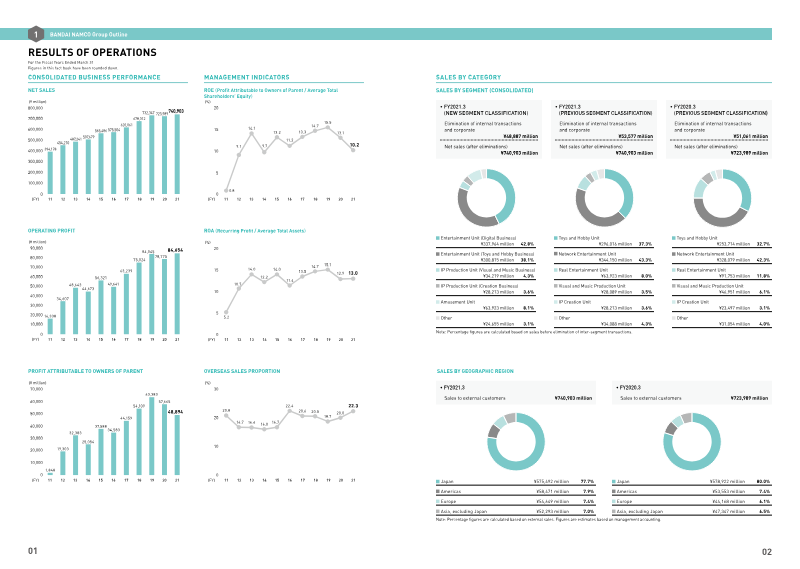
The 2021 Fact Book presents a comprehensive overview of Bandai Namco Holdings’ strategic direction, emphasizing its transformation into a globally integrated entertainment conglomerate and its commitment to corporate social responsibility. Central to the narrative is the thesis that sustained growth across toys, video games, animation and amusement can be achieved through diversified product portfolios, expansive international operations, and proactive sustainability initiatives. The company’s evolution is traced from a collection of independent toy, arcade‑machine and media firms to a unified group after the 2005‑2007 merger of Bandai and Namco. Key milestones include the launch of flagship lines such as Gundam models (over 500 million units shipped), Tamagotchi (exceeding 20 million units), and Zatchbell Battle (300 million units), as well as the development of major video‑game franchises—TEKKEN, DARK SOULS III and Tales—collectively surpassing 50 million sales. International expansion is evident through subsidiaries and regional headquarters in North America, Europe and Asia, reinforced by repeated listings on the Tokyo Stock Exchange and industry recognitions such as Cannes Best Actor and TSE awards. Environmental and social performance data for fiscal year 2021 highlight a suite of CSR actions, including CO₂ reduction targets, supply‑chain safety measures and work‑life‑balance programmes, all framed within the “NEXT STAGE” mid‑term plan aimed at deepening engagement with a mature fan base and broadening cross‑media offerings. The Fact Book thus underscores Bandai Namco’s dual focus on market leadership and sustainable corporate practices across a worldwide footprint and multiple entertainment segments.
Bandai NamcoSept 2021

Financial
Bandai Namco Group Integrated Report 2017
Bandai Namco’s 2017 integrated report presents a comprehensive account of the company’s financial, strategic, and governance performance, emphasizing the central role of its “IP‑axis” strategy in achieving record results. By leveraging core intellectual properties across games, toys, visual media, and music, the group generated ¥620.1 billion in net sales and ¥63.2 billion in operating profit, a 27.7 % year‑on‑year increase, while free‑cash flow rose 47.7 %. The Network Entertainment segment contributed 57.9 % of sales and 63.8 % of profit, with flagship franchises such as Mobile Suit Gundam (¥74 billion) and Dragon Ball (¥61 billion) underpinning cross‑media expansion and overseas growth in Asia, Europe, and the Americas. Strategic outlook is framed by the newly launched three‑year “NEXT STAGE” plan, which targets global IP expansion, regional autonomy, and continued innovation to meet mid‑term objectives a year ahead of schedule. Governance is reinforced through a ten‑member board—including three independent directors—and an audit‑supervisory board meeting Japanese Corporate Governance Code standards. A robust compliance and risk‑management framework, performance‑linked director compensation, and extensive investor‑relations activities underscore the company’s commitment to transparency and stakeholder trust. Corporate‑social‑responsibility initiatives achieved a 27 % reduction in CO₂ emissions since FY2012 and introduced universal‑design products and supplier audits. Financially, profit attributable to owners reached ¥44.2 billion, EPS rose to ¥201, and dividends of ¥15.4 billion were declared. Acquisitions such as
Bandai NamcoSept 2017

Financial
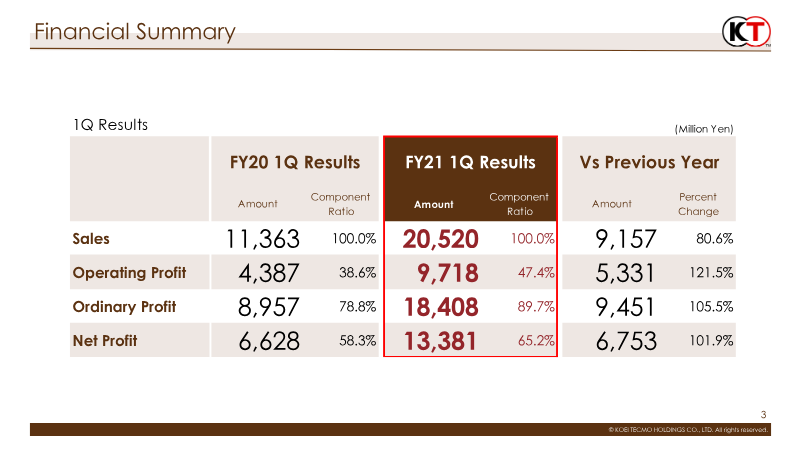
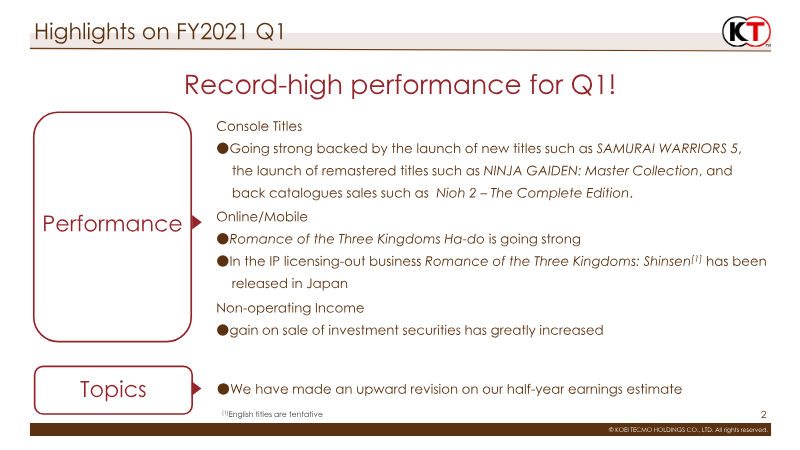
Financial Results for the First Quarter: Fiscal Year Ending March 2022
The financial overview for the first quarter of fiscal 2022 highlights a robust performance driven by new console releases and strong back‑catalogue sales. Total revenue rose 80.6 % from ¥11,363 million to ¥20,520 million, with operating profit more than doubling from ¥4,387 million to ¥9,718 million (121.5 % increase). Ordinary and net profits also surged by 105.5 % and 101.9 %, respectively, reflecting higher margins across the entertainment segment. Revenue composition shifted toward console titles, which accounted for 48.7 % of sales in the overseas market and 38.3 % domestically, supported by launches such as *Samurai Warriors 5* and remastered collections like *Ninja Gaiden: Master Collection*. Online/mobile sales grew 55.8 % in download volume, with the Romance of the Three Kingdoms series expanding into licensing‑out agreements. Non‑operating income benefited from gains on investment securities, prompting an upward revision of the half‑year earnings estimate. Geographically, Japan contributed 38.3 % of sales while overseas markets grew by 51.3 %, with North America and Europe showing mixed results—North America doubled its unit sales, whereas European units fell 26.3 %. Headcount increased by 2.5 % to 2,088 employees, and cost of goods sold rose 22.6 %, largely due to higher production for new titles. Methodologically, the report aggregates quarterly financial statements, sales data by platform and region, and download metrics from the company’s global service portfolio. The analysis underscores a strategic focus on IP licensing, back‑catalogue monetization, and digital distribution to sustain growth in the second half of fiscal 2022.
Koei Tecmo
Financial
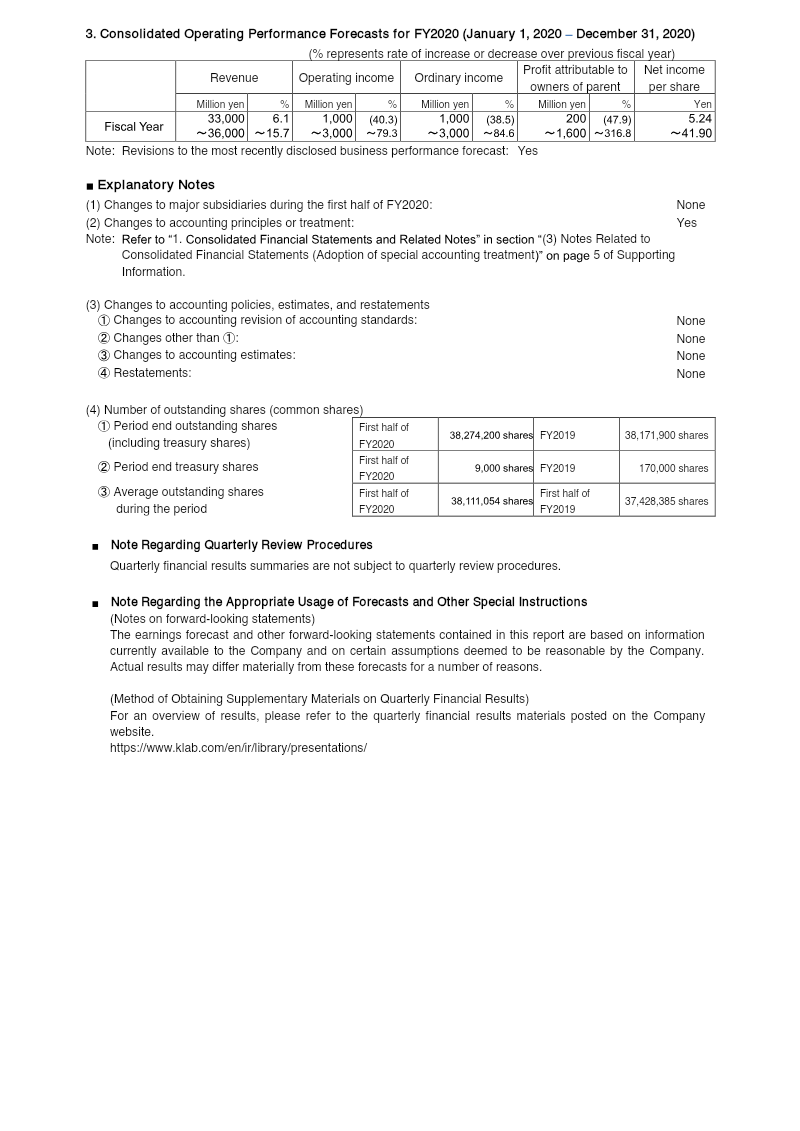
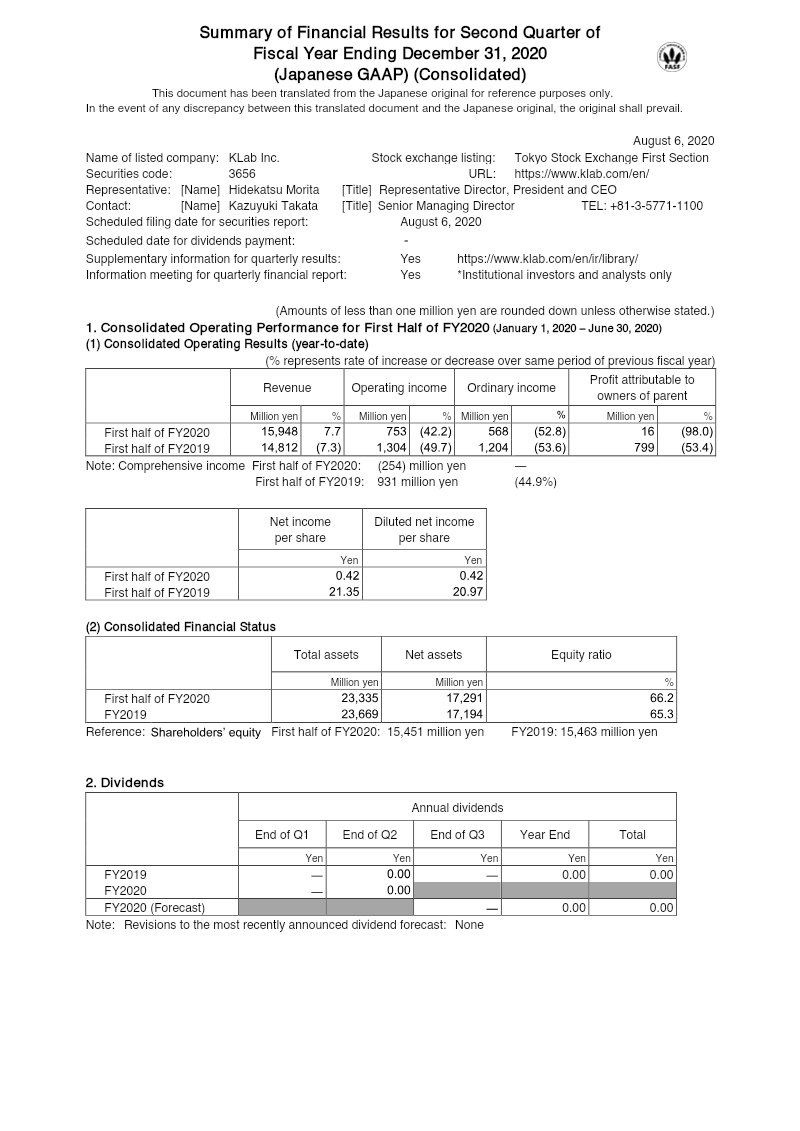
Consolidated Financial Results for the First Half of Fiscal Year 2020
KLab Inc. reported consolidated financial results for the first half of fiscal year 2020, covering the period from January 1 to June 30, 2020. The data reveals a divergence between top-line growth and bottom-line profitability. Revenue increased by 7.7% year-over-year to 15.9 billion yen, driven primarily by the core Game Business segment, which accounted for 15.8 billion yen of total turnover. Despite this growth, operating income fell by 42.2% to 753 million yen, and profit attributable to owners of the parent plummeted by 98% to just 16 million yen. The sharp decline in profitability is attributed to rising costs and significant non-operating and extraordinary items. The cost of sales rose from 10.9 billion yen to 12.8 billion yen, while ordinary income was pressured by 243 million yen in foreign exchange losses. Furthermore, the company recorded a substantial extraordinary impairment loss of 498.8 million yen related to goodwill in its Research and Consulting Business, after determining that the segment lacked its initially anticipated profitability. Geographically focused on the Japanese market but with international exposure, the company maintained a stable equity ratio of 66.2% with total assets valued at 23.3 billion yen. Looking ahead, the full-year forecast for 2020 suggests significant volatility, with revenue projected between 33 billion and 36 billion yen. While the company anticipates a potential recovery in net income, the wide forecast range reflects ongoing uncertainty in the operating environment. No dividends were paid during the period, consistent with previous fiscal cycles.
KLabAug 2020