Mobile Games
The mobile market by genre, from hypercasual and puzzle to midcore and idle.
403 documents
GameAnalytics · 2019
ReportMobile Benchmarks Report GameAnalytics
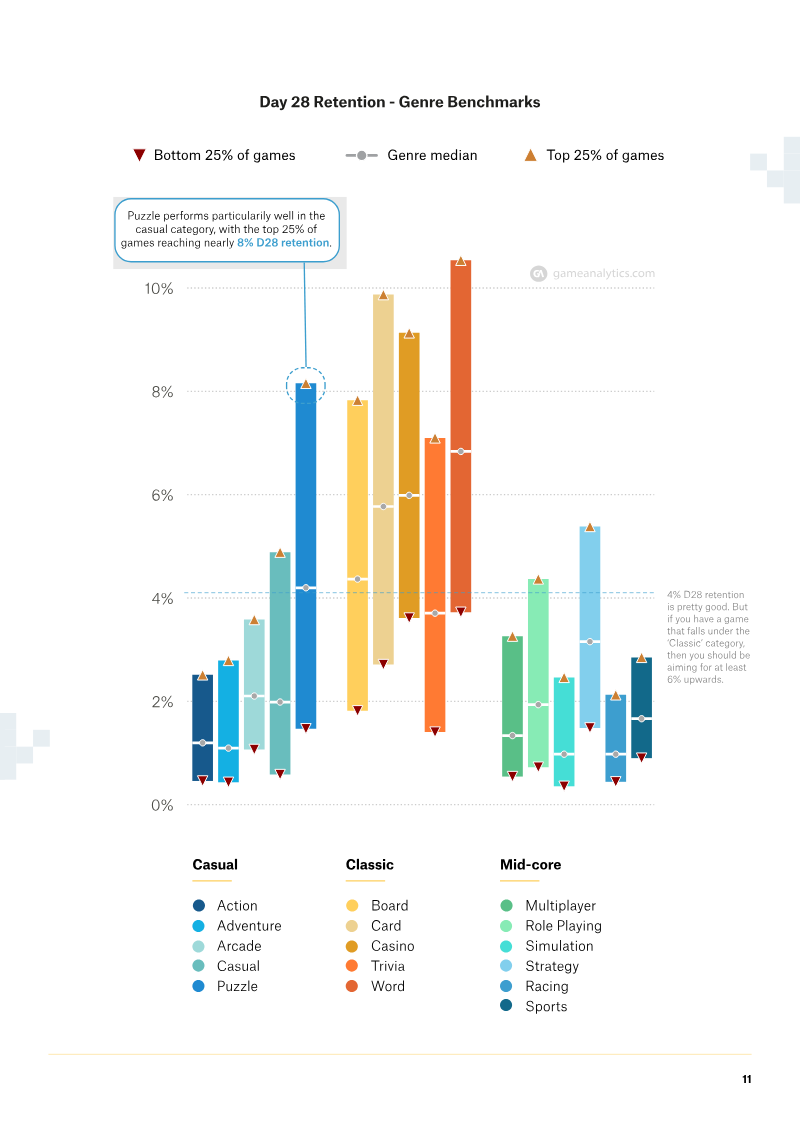
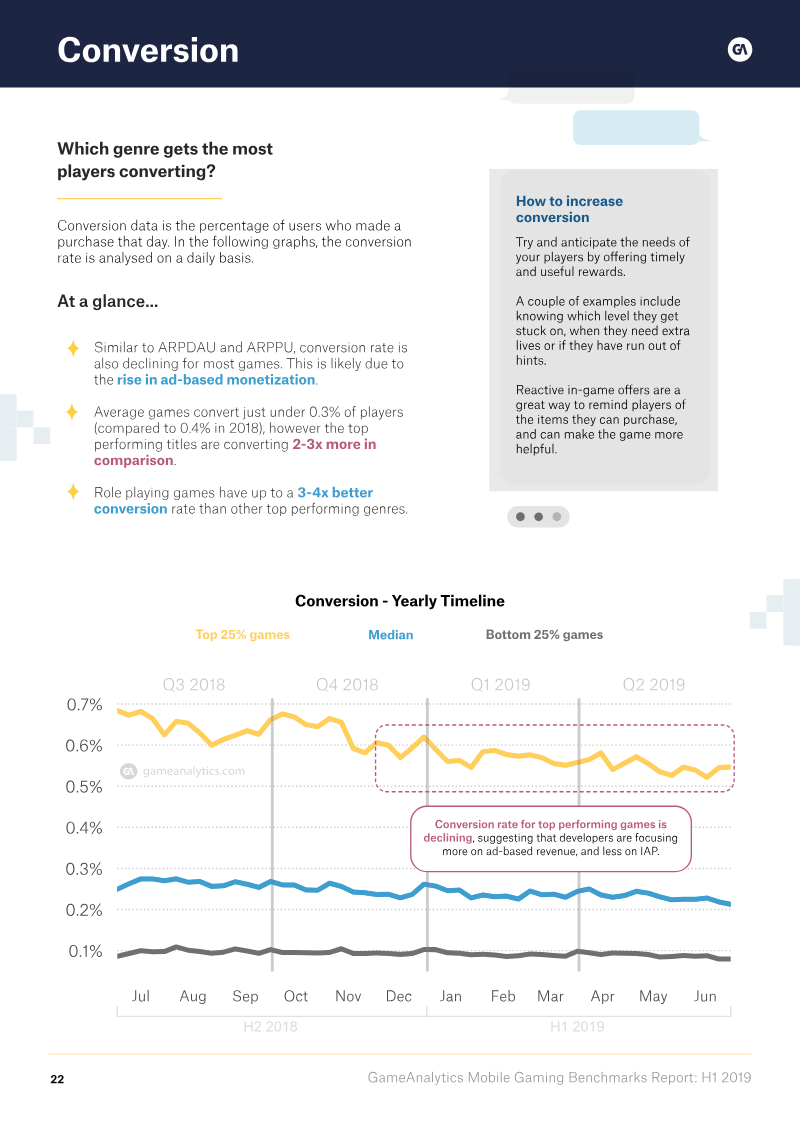
The mobile gaming landscape in the first half of 2019 reflects a significant structural shift as developers increasingly pivot from in-app purchases toward ad-based monetization models. Analysis of 100,000 titles and 1.2 billion monthly active users reveals a 15-20% year-over-year decline in Average Revenue Per Paying User (ARPPU) and Average Revenue Per Daily Active User (ARPDAU). While the median ARPDAU sits at $0.02, hyper-casual games maintain viability through advertising, supported by median eCPMs of approximately $5.00. Despite these shifts, Mid-core genres like Strategy and Role-Playing Games continue to dominate financial performance, yielding the highest conversion rates and revenue generation across the industry. Engagement metrics remain the primary indicator of long-term success, with top-performing titles aiming for a 35% Day 1 retention rate and a 4% Day 28 retention rate. Classic genres, specifically Card and Casino games, lead the market in player stickiness, boasting session lengths that can reach 22 minutes compared to the broader median of 4-5 minutes. Geographic trends further highlight the rising prominence of the Chinese market, where over 60% of the population engages in mobile gaming and median eCPMs have climbed to $3.90, nearly rivaling established Western markets like the United States. Industry leaders utilize these benchmarks to streamline publishing pipelines, often requiring a minimum 50% Day 1 retention rate to greenlight titles for further optimization. Success in this competitive environment relies on the integration of real-time data, remote configuration, and advanced player segmentation to manage game lifecycles. By monitoring key performance indicators and error logs through automated dashboards, publishers can identify high-potential titles early and refine gameplay mechanics to meet the rigorous standards of the current mobile ecosystem.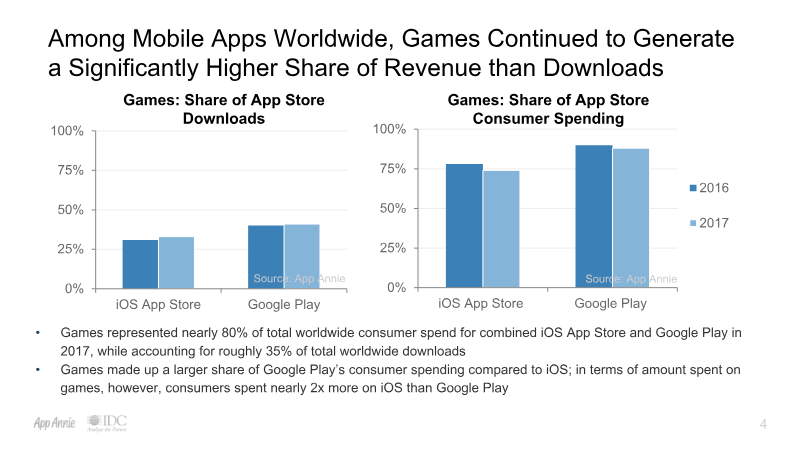


App Annie · 2018
ReportGaming Spotlight 2017 Review
The global gaming industry experienced a significant shift in 2017 as mobile gaming solidified its dominance over traditional platforms. Mobile consumer spending exceeded the combined total of home consoles, PC, Mac, and handheld consoles by more than one-third, representing a substantial increase from the single-digit margin recorded in 2016. While games accounted for less than 40% of total mobile app downloads, they generated nearly 80% of combined consumer spend on the iOS App Store and Google Play. This growth was primarily driven by the Asia-Pacific region, particularly China, Japan, and South Korea, which accounted for over 60% of all mobile game spending. A critical trend identified throughout the year was the rise of live player-versus-player (PvP) and cooperative gameplay. For the first time in mobile history, the top two grossing games on both major app stores featured live PvP elements, a shift influenced by PC gaming heritage and the rising popularity of esports. In the United States, survey data from 3,991 gamers revealed that those engaging in live PvP or co-op modes skewed younger and male, played more hours per week, and were significantly more likely to spend money on titles compared to those playing single-player or turn-based games. The handheld console market also reflected this shift toward multiplayer engagement, with four of the top five grossing titles supporting live PvP or co-op. Despite the continued strength of the Nintendo 3DS in 2017, the industry began transitioning toward hybrid and mobile platforms, evidenced by major franchises like Pokémon moving away from dedicated handhelds. Analysts concluded that the maturation of live multiplayer engagement, bolstered by the emergence of the battle royale genre, would remain the primary driver for industry growth and monetization moving into 2018.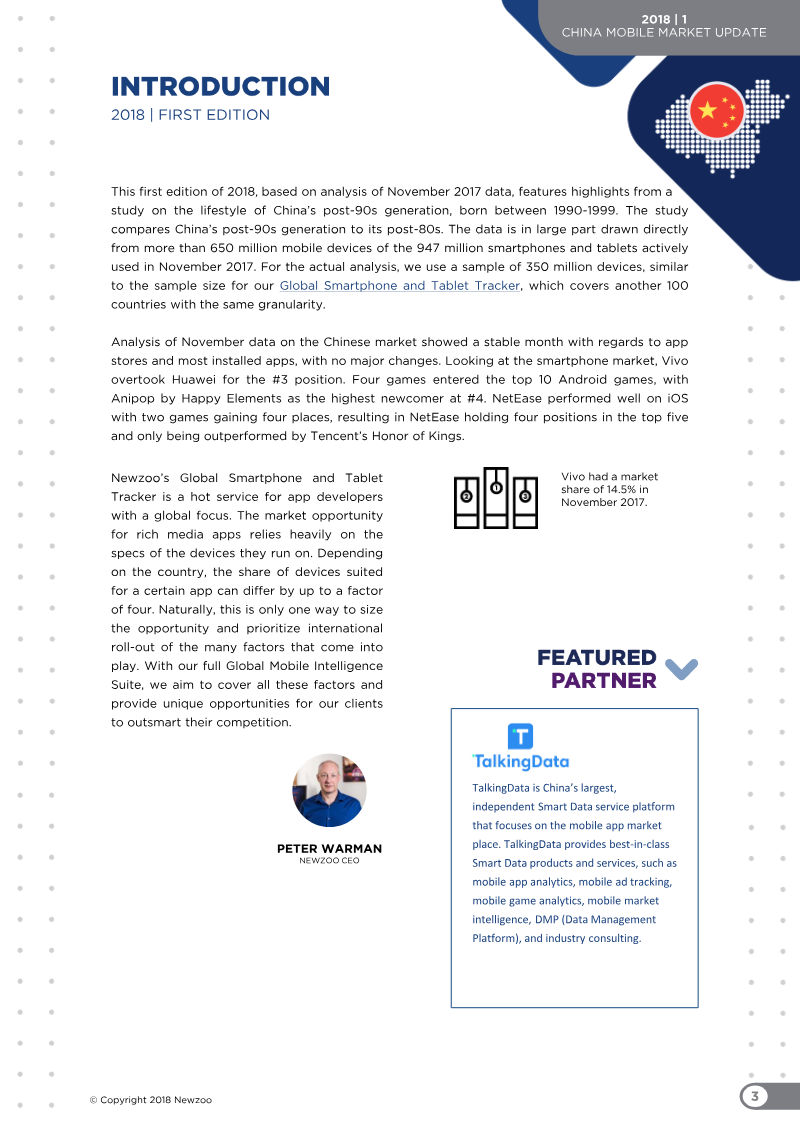

Newzoo · 2018
ReportChina Mobile Market Update: January 2018
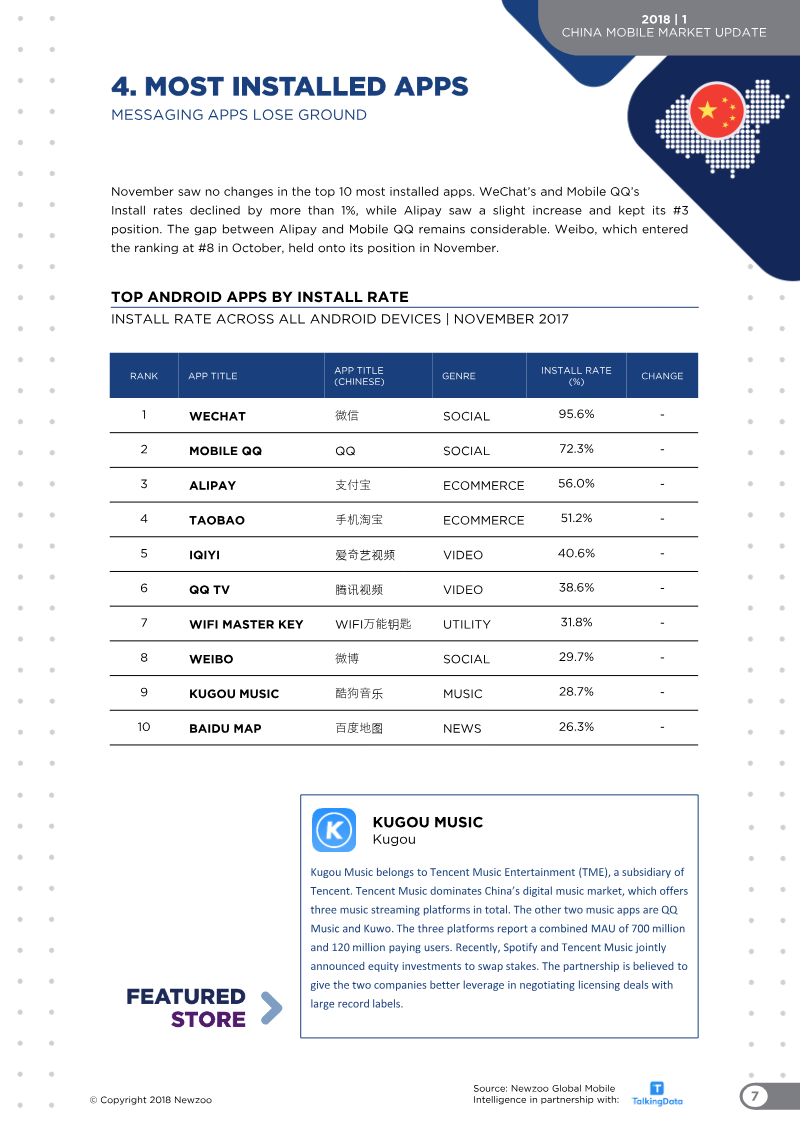
This market update provides a comprehensive analysis of the Chinese mobile landscape as of November 2017. The report examines trends across mobile hardware, app store performance, and consumer behavior, specifically focusing on the demographic characteristics of the post-90s generation. The findings are derived from a sample of 350 million active iOS and Android smartphones and tablets, drawn from a broader pool of over 650 million devices. In the hardware sector, the market experienced a notable shift as Vivo surpassed Huawei to become the third-largest device brand in China, capturing a 14.5% market share. Apple maintained its lead as the top brand with 25.7% of the market. Within the Android app store ecosystem, Tencent’s MyApp remained the dominant platform with 25.1% coverage, while 360 Mobile Assistant emerged as the fastest-growing store. The most installed apps remained largely static, with WeChat and Mobile QQ continuing to lead the social category, despite slight declines in their respective install rates. The gaming sector saw significant activity, particularly in the battle royale genre, where NetEase’s titles demonstrated strong performance. On the iOS platform, NetEase secured four of the top five grossing positions, trailing only Tencent’s Honor of Kings. The report also highlights a case study on the post-90s generation, noting a strong preference for domestic smartphone brands and low-to-mid-range price points. Data indicates that while both post-80s and post-90s cohorts exhibit high levels of late-night mobile activity, the post-80s generation maintains higher overall engagement throughout the standard workday. These insights underscore the competitive nature of the Chinese mobile market, characterized by rapid shifts in brand loyalty and the continued dominance of established domestic tech giants.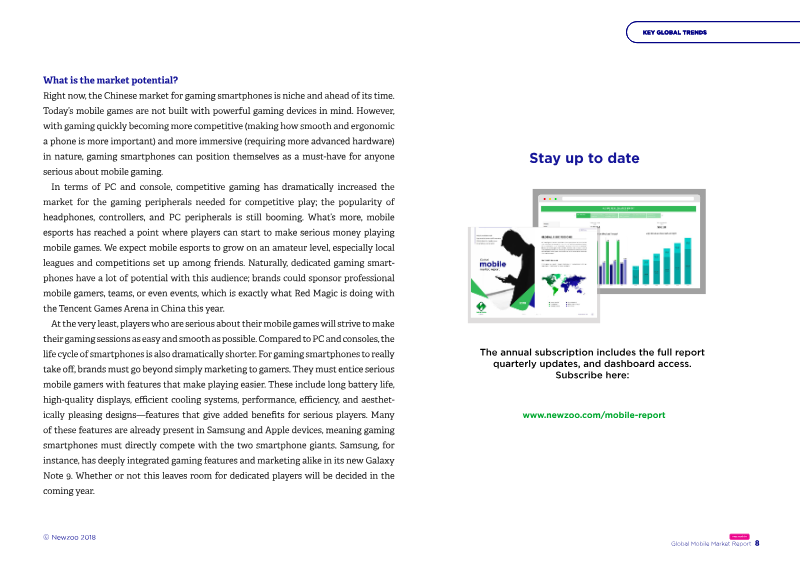
Newzoo · 2018
ReportGlobal Mobile Market Report 2018
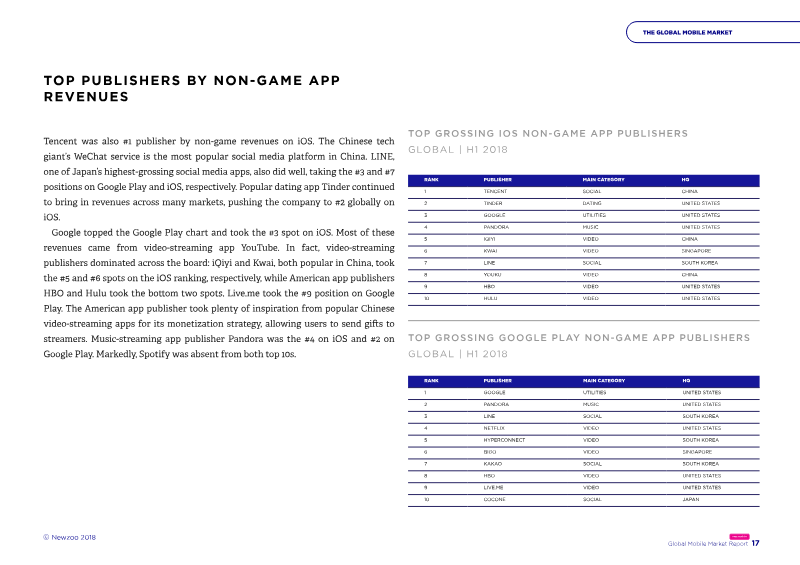
The global mobile market is undergoing a significant transformation characterized by a shift toward immersive, competitive gaming experiences and the integration of high-engagement subscription services. With global app store revenues reaching $92.1 billion in 2018, mobile gaming remains the primary economic driver, accounting for 76 percent of total expenditures. This financial growth is supported by hardware manufacturers who are increasingly developing dedicated gaming smartphones to meet the demands of high-performance software, particularly within the expansive Chinese market. Simultaneously, major media and technology firms are pivoting toward original video content to capture consumer attention, mirroring the subscription-based models popularized by leading streaming platforms. The industry’s expansion is underpinned by a robust increase in global smartphone adoption, which is projected to reach 3.8 billion users by 2021. This growth is heavily concentrated in the Asia-Pacific region, which continues to serve as the primary catalyst for global market penetration. While Samsung and Apple maintain their status as the dominant hardware manufacturers, the software landscape remains highly competitive, with casual gaming publishers and video-streaming services leading their respective revenue categories. These insights are derived from a comprehensive analytical framework that monitors the top 100 global markets, representing 98.5 percent of the world’s smartphone users. By integrating historical data, socio-economic indicators, and telemetry from over 400 million active devices, this intelligence provides a precise view of evolving consumer behaviors. The continuous refinement of these predictive models ensures that stakeholders can effectively navigate the rapid technological and economic shifts defining the mobile ecosystem as it matures into a central pillar of global digital entertainment.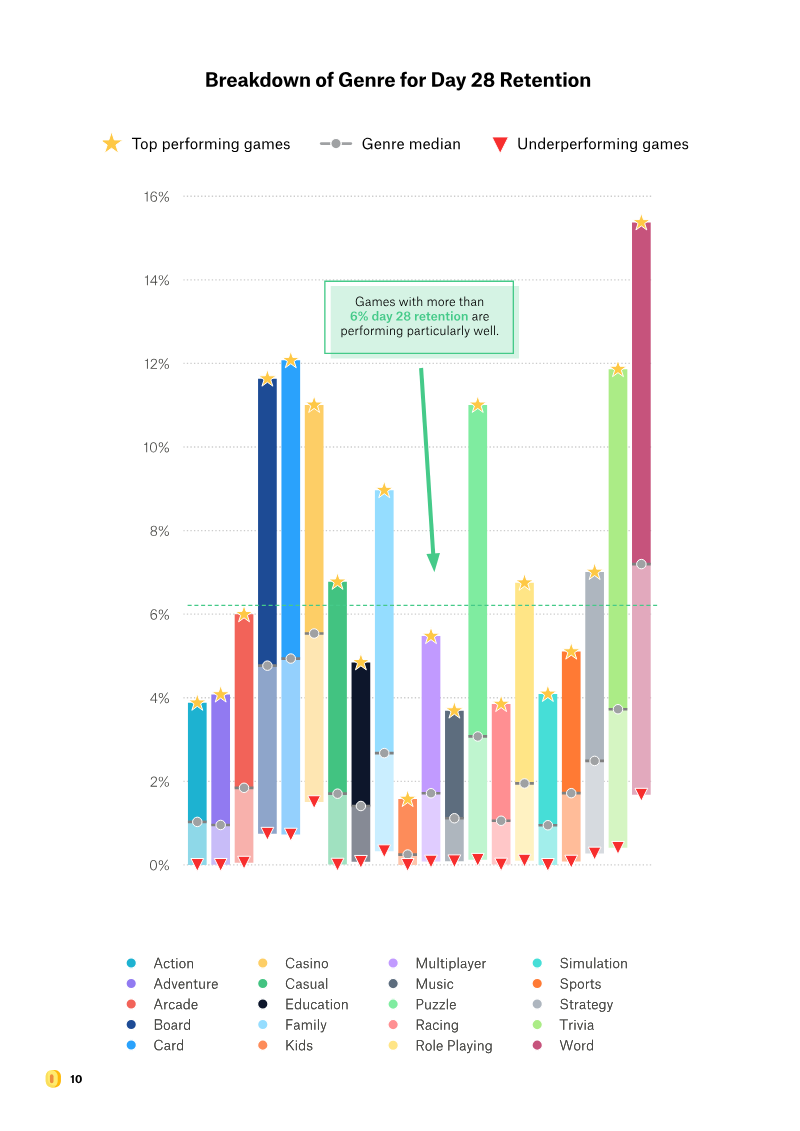
GameAnalytics · 2018
ReportMobile Gaming Benchmarks: 2018
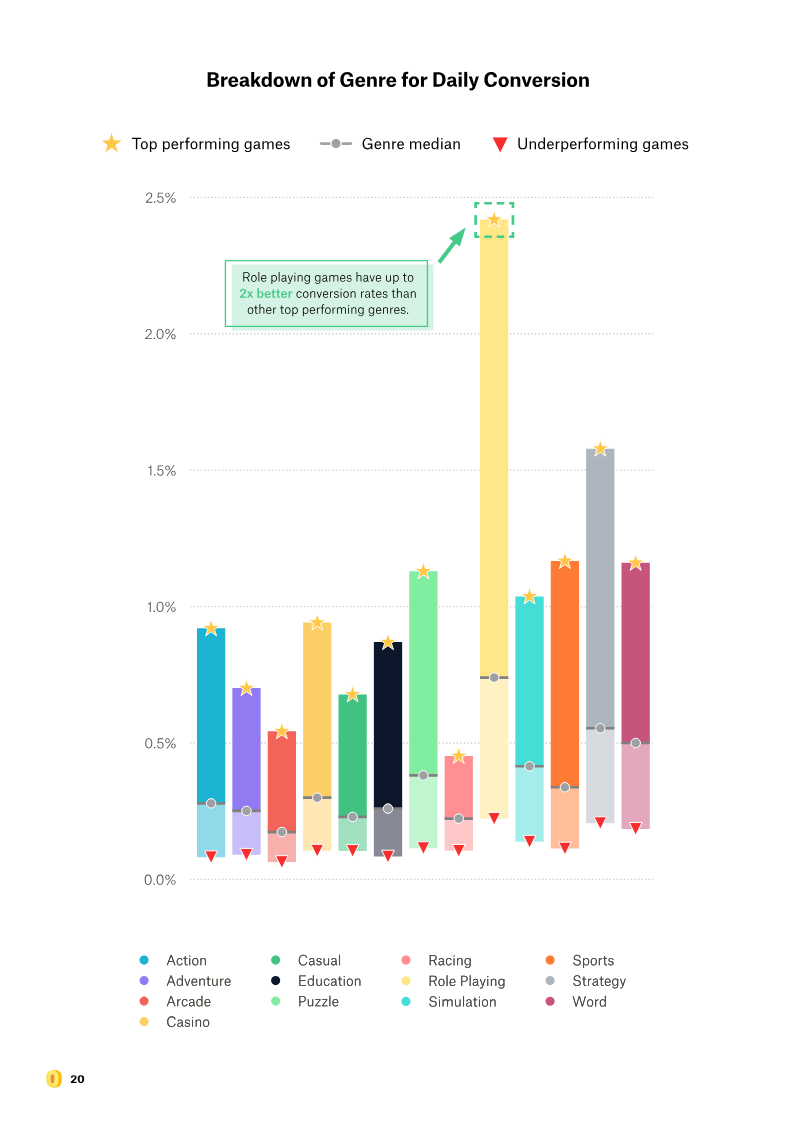
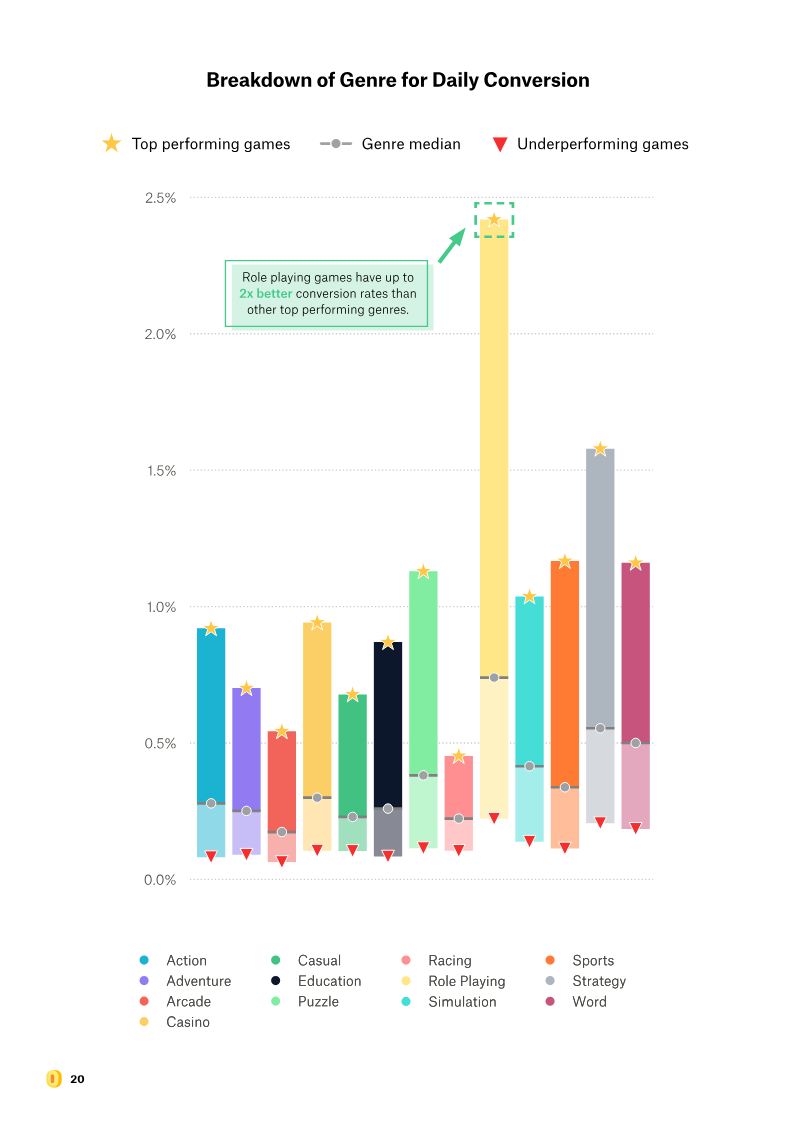
The 2018 mobile gaming benchmark study analyzes performance across more than 60 000 titles that each attract at least 1,000 daily users, drawing on data from 850 million monthly active players over a full calendar year (July 2017-June 2018). The methodology employs a dual presentation: an overall yearly view and genre-specific breakdowns, with green, yellow, and red bands indicating top 15%, median, and underperforming levels. Retention metrics reveal that day-28 retention peaks during the “cold and boring quarter” before Christmas, with top performers achieving 6.5-7% retention versus a median of only 1.5%. Card, Casino, and Word games lead the field, each exceeding 6% retention; Board and Trivia also perform well. Average session length follows a similar seasonal pattern, reaching roughly 15 minutes for top titles in winter compared to a median of 6.5 minutes, especially within Casino and Card genres where holiday engagement is strongest. Monetization data show role-playing games dominate ARPDAU, with leading titles earning 6–7 times the median and bottom performers generating none. Strategy games also outperform most other genres, achieving about twice the ARPDAU and conversion rates of their peers. Daily conversion rates for top-15% titles hover around 1.2%, while the median sits near 0.4% and bottom performers near 0.1%. The case study of Voodoo illustrates how a data-driven acquisition and monetization pipeline can scale an indie studio into a top publisher. By scraping Play Store data, analyzing D1/D7 retention through GameAnalytics, and rapidly iterating on high-potential titles, Voodoo launched multiple hits such as Paper.io (20 M+ downloads) and Helix Jump (310 M+). Rigorous KPI tracking and real-time analytics enabled the studio to publish simultaneously while minimizing risk, demonstrating a scalable model for high-performing mobile game portfolios.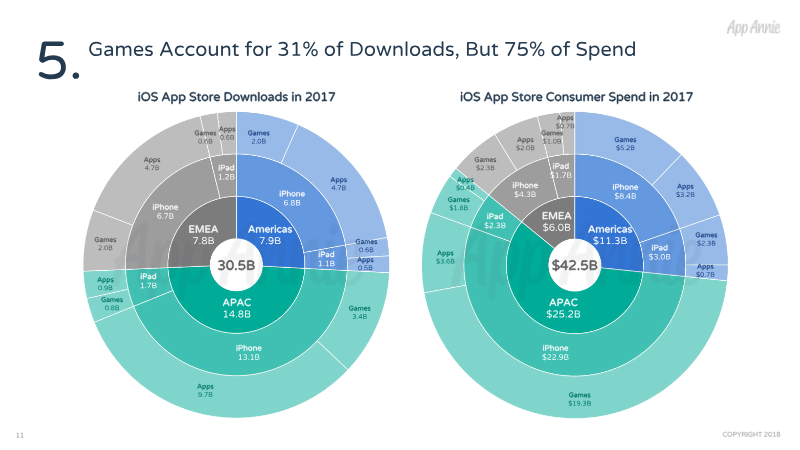
data.ai · 2018
ReportThe Data Behind 10 Years of the iOS App Store – 2018
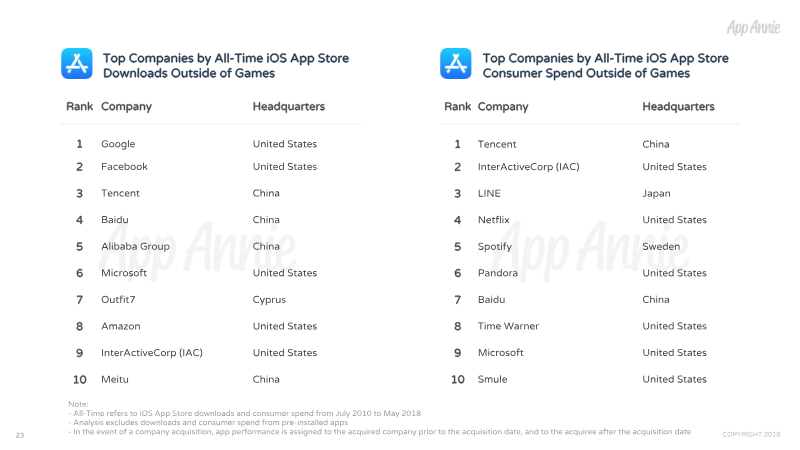
The iOS App Store underwent a profound transformation between 2010 and 2018, evolving from a nascent marketplace into a mature global economy characterized by massive revenue growth and a shift in monetization strategies. During this period, the platform facilitated over 170 billion downloads and generated $130 billion in consumer spend. While download volume grew at a steady compound annual growth rate of 15%, revenue surged at 52%, signaling a highly lucrative ecosystem where nearly 10,000 individual apps reached at least $1 million in annual consumer spend by 2017. The gaming sector emerged as the primary economic engine of the platform, accounting for 75% of total consumer spend despite representing only 31% of total downloads. This financial dominance was mirrored by a fundamental shift in business models, as the industry moved away from paid downloads—which fell to less than 1% of the market—toward free-to-play mechanics and in-app subscriptions. Clash of Clans and Netflix established themselves as the all-time leaders in consumer spend for games and non-games respectively, while Facebook maintained the highest volume of total downloads. Geographically, the center of the app economy shifted toward the Asia-Pacific region, which now accounts for nearly 60% of global iOS revenue. China, in particular, experienced a meteoric rise, overtaking the United States in 2016 to become the world’s largest market for both downloads and spending. This regional growth was largely propelled by domestic tech giants such as Tencent, Baidu, and NetEase. As the marketplace continues to mature, data-driven insights from providers like App Annie remain essential for businesses navigating this complex, multi-billion dollar landscape.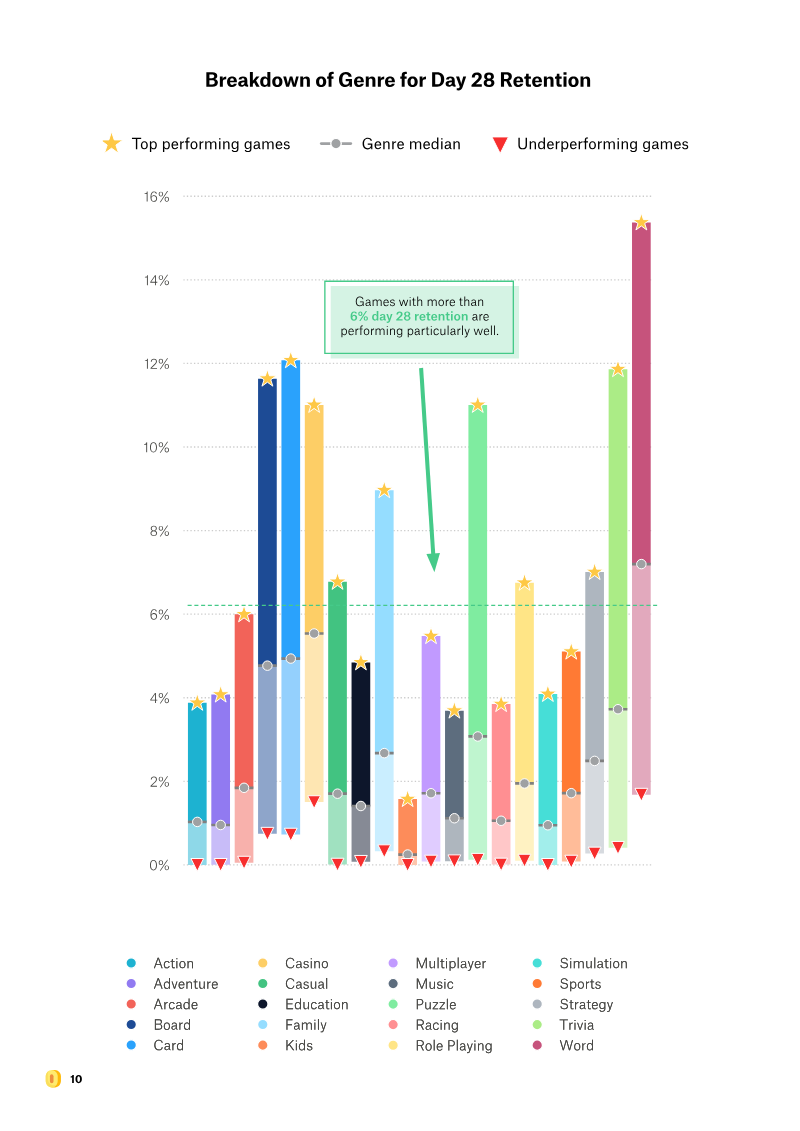
GameAnalytics · 2018
ReportA Global Analysis of Mobile Gaming Benchmarks: 2018 Edition
The mobile gaming landscape between July 2017 and June 2018 was characterized by a widening performance gap between elite titles and the market median. Analysis of over 60,000 games and 850 million monthly active players reveals that top-tier titles in the 15th percentile maintain Day 1 retention rates exceeding 35%, whereas Day 28 retention across the board rarely surpasses 6%. This retention decay underscores the difficulty of long-term player engagement, leading industry leaders like Voodoo to implement strict 50% Day 1 retention thresholds to identify potential hits early in the development cycle. Monetization metrics further illustrate this disparity, with top-performing games generating three to four times more revenue per paying user than average titles. The Role Playing, Strategy, and Casino genres dominate financial benchmarks, with elite performers achieving an average revenue per paying user of up to $40. Furthermore, the average revenue per daily active user for top-tier games is six times higher than the median, a success largely attributed to sophisticated A/B testing of price points and the implementation of reactive in-game offers. As mobile games are projected to account for 76% of global app revenue, the ability to convert and retain players remains the primary differentiator for commercial success. While average games struggle with low conversion rates, top-performing titles achieve conversion metrics triple those of the median. These findings suggest that data-driven development and aggressive optimization of monetization funnels are essential requirements for competing in a market where the majority of value is concentrated among a small percentage of high-performing titles.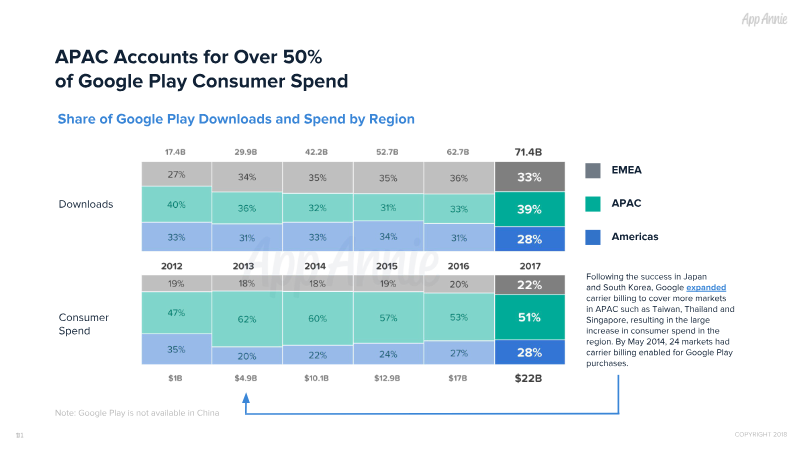
data.ai · 2018
ReportThe Data Behind 10 Years of Google Play (2018)
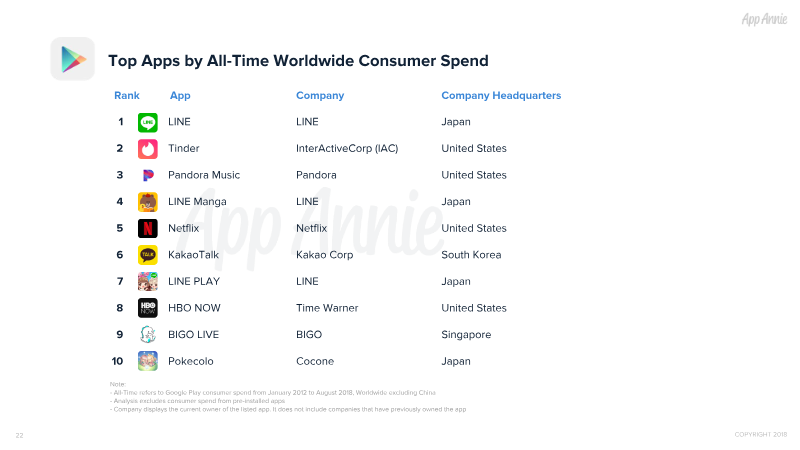
This analysis examines the growth and performance of the Google Play Store over a nearly seven-year period, spanning from January 2012 to August 2018. Utilizing data from the App Annie platform, the findings track the evolution of the Android ecosystem from its early stages to a mature marketplace featuring over 2.8 million available apps. During this timeframe, the platform recorded nearly 330 billion total downloads and generated over $85 billion in consumer spend, with more than 5,000 individual apps surpassing the $1 million revenue milestone. Geographic trends reveal a significant divide between volume and value. India leads the world in total downloads at 36.9 billion, followed closely by the United States and Brazil. However, Japan emerges as the most lucrative market, contributing $25.1 billion in consumer spend, significantly outpacing the United States and South Korea. The data highlights a shift in monetization strategies, particularly the 2017 transition toward in-app subscriptions. This change, supported by a reduction in Google’s transaction fees for long-term subscribers, resulted in a 55% growth in spend for non-gaming apps between 2016 and 2017. The competitive landscape is dominated by major social media and gaming entities. Facebook-owned properties occupy the top four spots for all-time downloads, while LINE and Tinder lead in non-gaming consumer spend. In the gaming sector, Subway Surfers is the most downloaded title, but GungHo Online’s Puzzle & Dragons and Mixi’s Monster Strike lead in total revenue. Looking forward, the analysis projects continued aggressive growth, estimating that annual consumer spend on Google Play will reach $42 billion by 2022, a 90% increase from 2017 levels.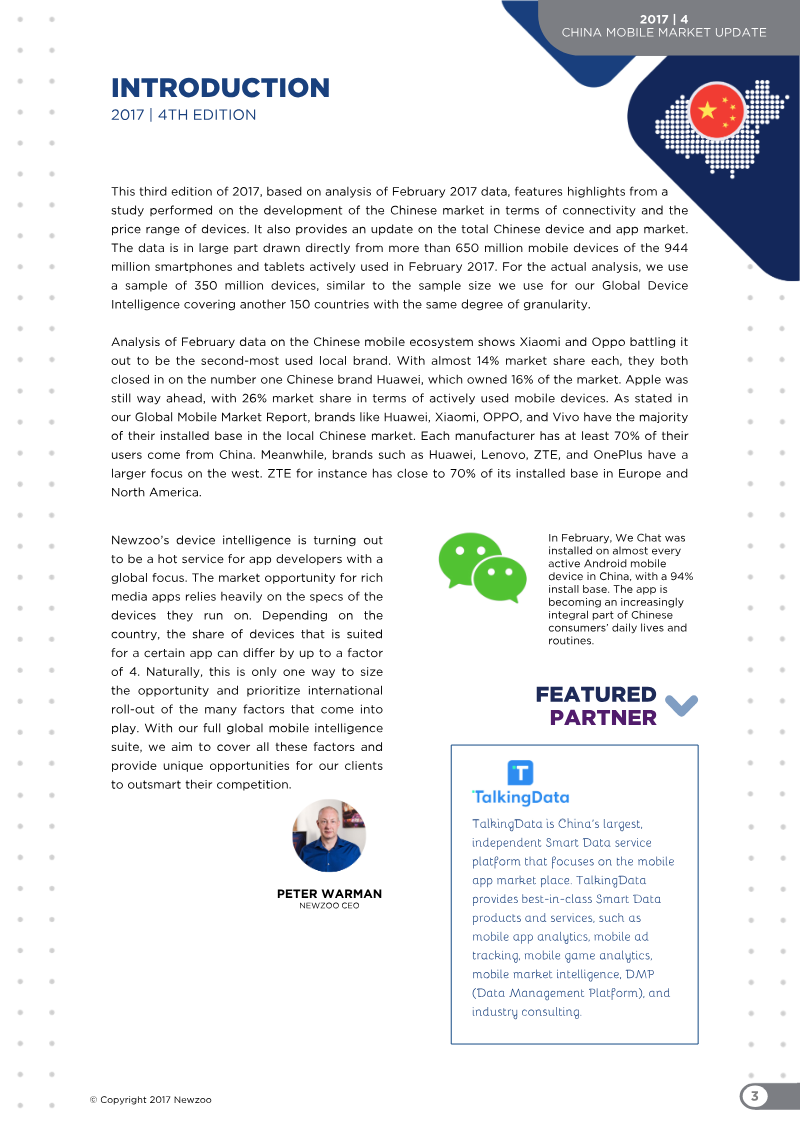

Newzoo · 2017
ReportChina Mobile Market Update: April 2017
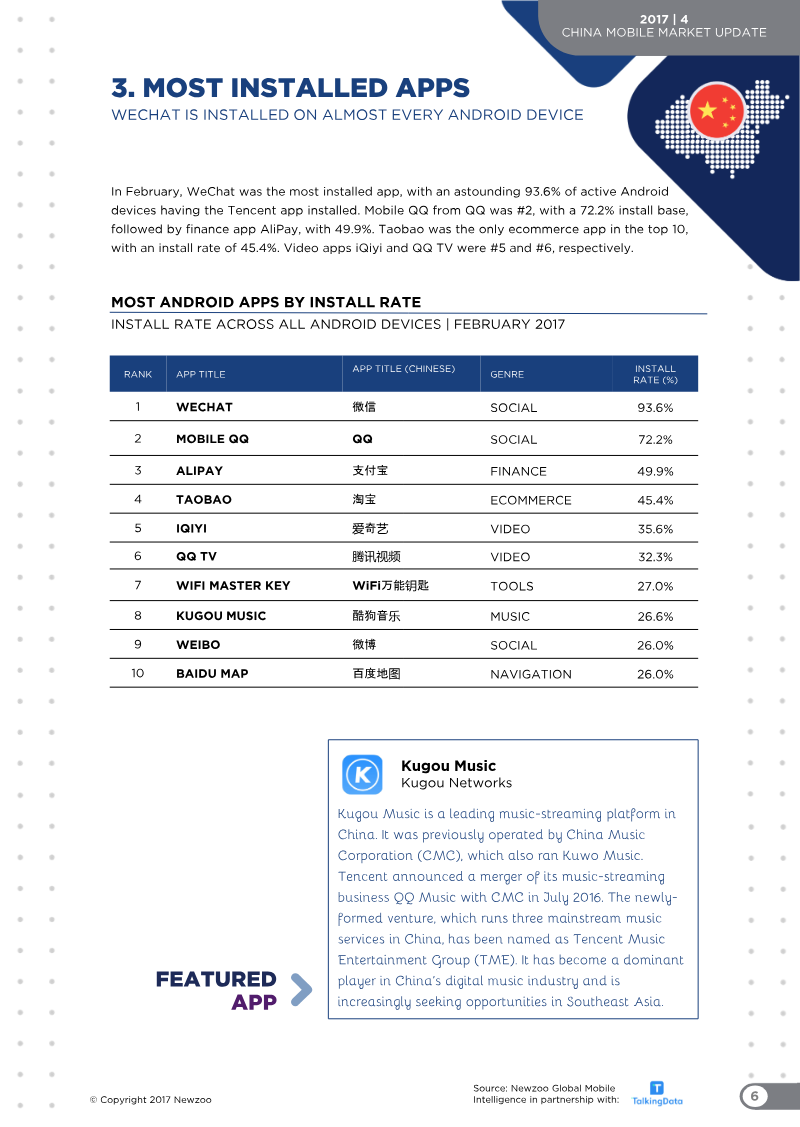
This analysis of the Chinese mobile market, based on February 2017 data, examines the landscape of device usage, app store penetration, and consumer connectivity trends. The study utilizes a sample of 350 million active mobile devices to provide a granular view of the world’s largest mobile ecosystem, highlighting the dominance of local manufacturers and the rapid shift toward premium hardware and advanced network connectivity. In the device market, Apple maintained the lead with a 26.3% share of active devices, followed by Huawei at 15.6%. Xiaomi and Oppo remained highly competitive, each capturing 13.8% of the market. The data reveals a significant shift in consumer behavior, as 4G connectivity became the standard in 2016, rising to 57.9% of active devices compared to 31.6% in 2015. Simultaneously, the market saw a trend toward premiumization, with a notable increase in devices priced above 2,000 RMB and a corresponding decline in budget devices under 1,999 RMB. App store and application usage patterns underscore the dominance of domestic platforms. Tencent’s MyApp remained the leading app store with 24.1% coverage, while WeChat achieved near-universal penetration, installed on 93.6% of active Android devices. In the gaming sector, Tencent and NetEase maintained a stronghold on revenue, with titles like King of Glory and Onmyoji leading both Android and iOS charts. While casual games showed growth in the Android segment, the iOS market saw increased diversity with new publishers entering the top 10. These findings illustrate a maturing market characterized by high engagement with local social and utility platforms and a growing consumer appetite for higher-end mobile technology.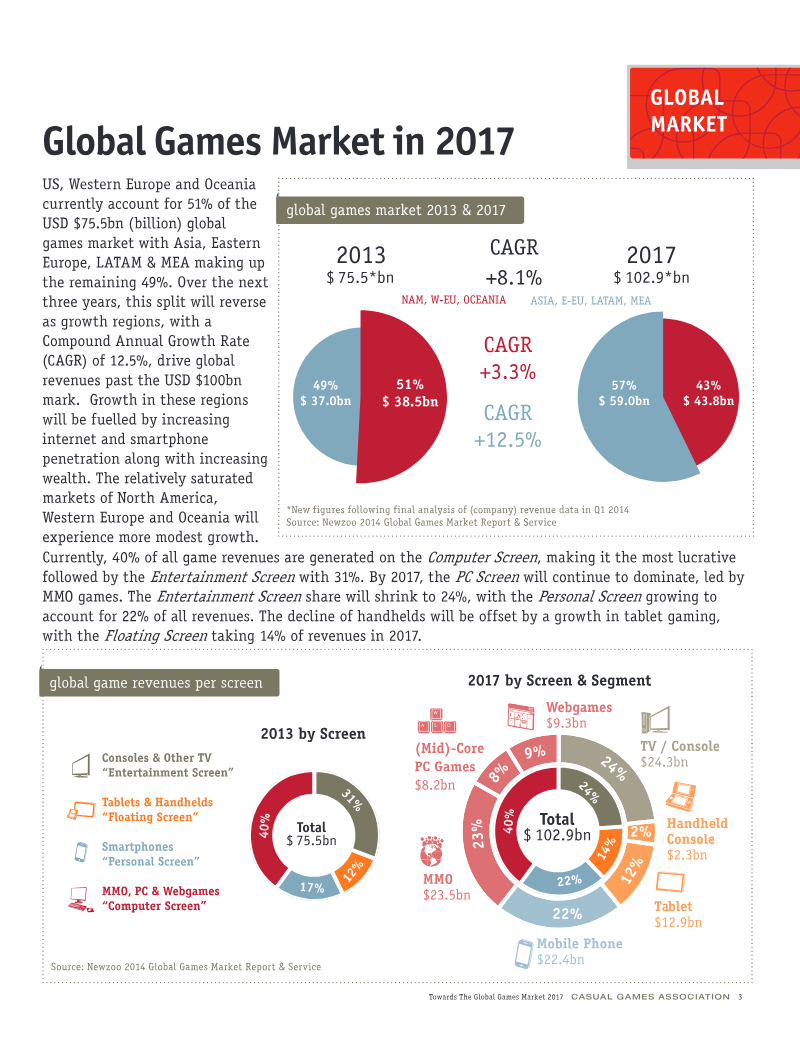
Newzoo · 2017
ReportCasual Games Sector Report: 2017
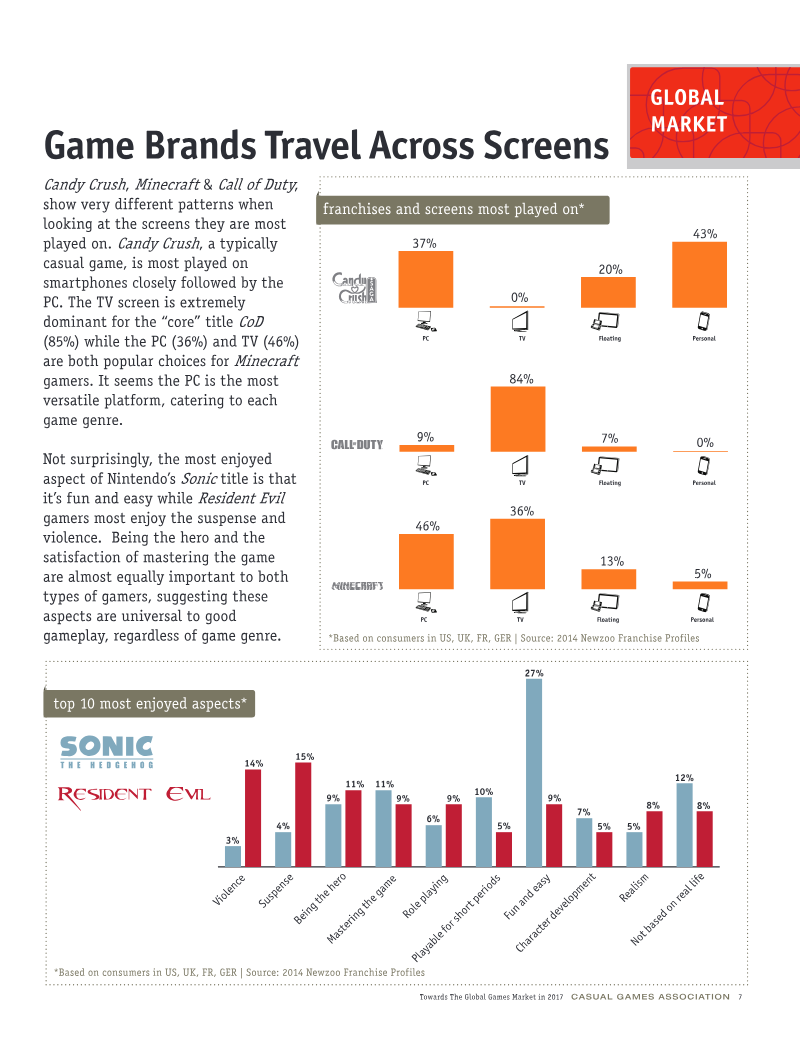
The global games market is undergoing a period of rapid expansion and structural transformation, with total revenues projected to exceed $100 billion by 2017. This growth is driven by the globalization of business models, such as free-to-play, and the increasing ubiquity of mobile devices. While mature markets in North America, Western Europe, and Oceania currently account for 51% of global revenue, emerging regions—including Asia, Eastern Europe, Latin America, and the Middle East—are expected to drive a compound annual growth rate of 12.5% over the forecast period, eventually shifting the majority of market share toward these developing territories. Mobile gaming serves as a primary catalyst for this expansion, with smartphone and tablet usage becoming essential for global consumers. By 2017, mobile gaming is expected to capture 34% of the total market, up from 23% in 2013. Simultaneously, the industry is evolving as games transition into broader entertainment brands that span multiple media platforms. This cross-media presence, supported by the rise of eSports and digital content consumption, allows developers to increase engagement and monetize non-paying users more effectively. China represents a significant focal point for industry growth, with revenues quadrupling between 2008 and 2013. Despite challenges related to piracy and strict censorship, the Chinese market is characterized by a robust mobile app ecosystem and high engagement with both domestic and foreign titles. Success for international companies in this region increasingly depends on local partnerships, effective localization, and the integration of in-game monetization models. The analysis relies on a combination of primary consumer research, transactional data, and financial analysis to provide a comprehensive view of these shifting global dynamics.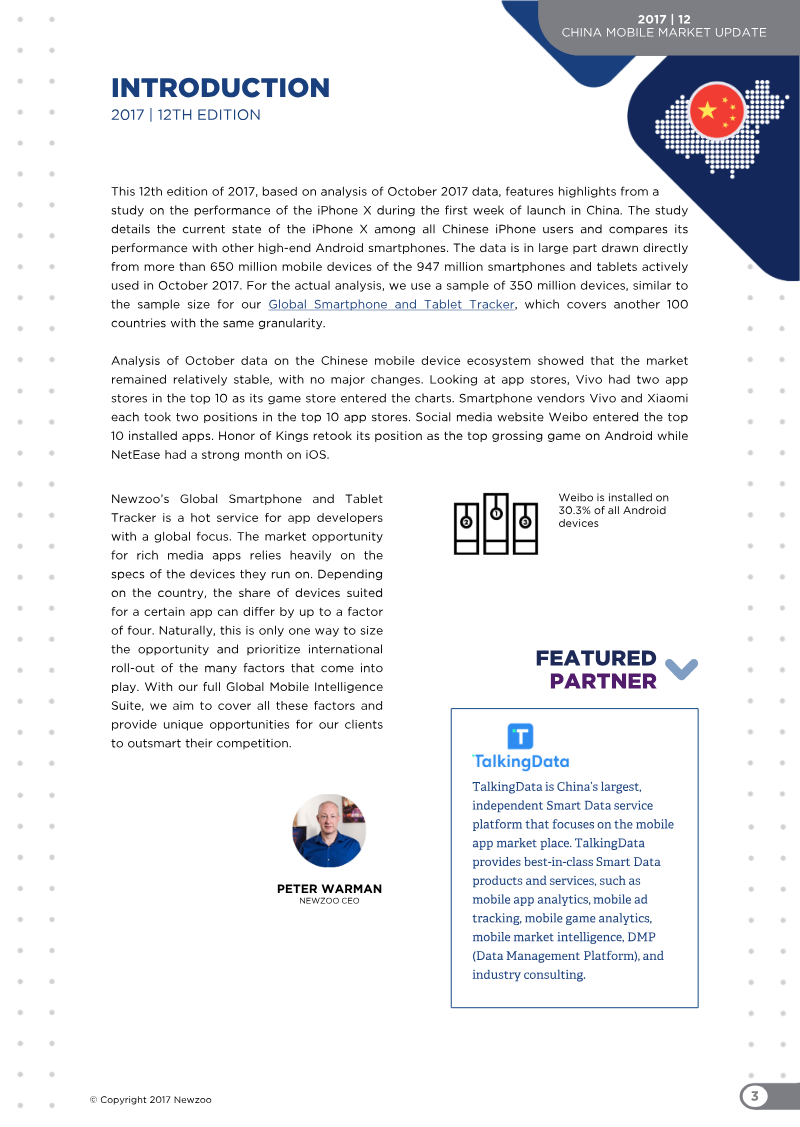

Newzoo · 2017
ReportChina Mobile Market Update: December 2017
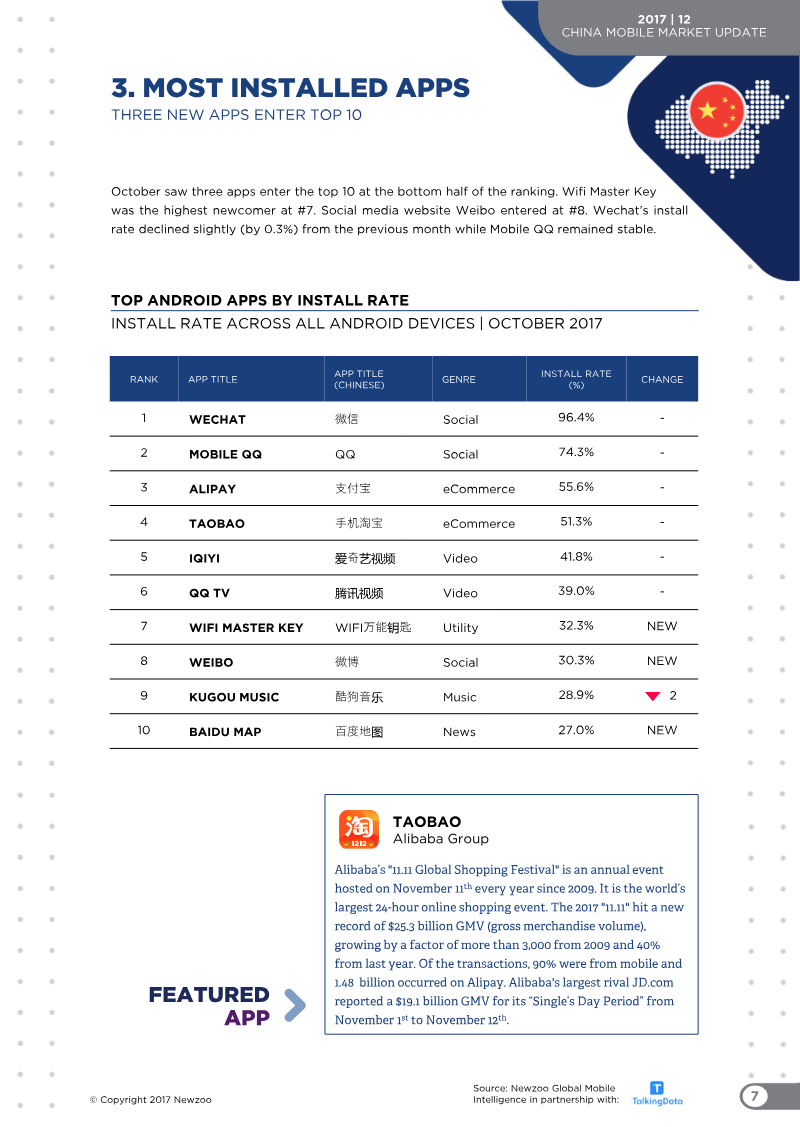
The Chinese mobile market remained stable throughout October 2017, characterized by consistent brand rankings and steady adoption rates. Based on an analysis of 350 million active devices from a total pool of 947 million smartphones and tablets, the data indicates that Apple maintained a 25.6% market share, while domestic manufacturers OPPO, Huawei, Vivo, and Xiaomi continued to dominate the remaining landscape. The ecosystem saw minor shifts in app store distribution, with Vivo expanding its presence by placing both its standard app store and its dedicated game center within the top 10, effectively displacing Google Play from the rankings. Consumer behavior in the gaming sector showed intense competition between industry leaders Tencent and NetEase. Honor of Kings reclaimed its position as the top-grossing game on Android, while NetEase demonstrated strong performance on iOS. The market also saw a strategic pivot toward the battle royale genre, with both publishers aggressively developing mobile iterations of popular titles to capture market share. Beyond gaming, the social and utility sectors remained anchored by established platforms like WeChat, Mobile QQ, and Alipay, though new entrants such as Wifi Master Key and Weibo successfully broke into the top 10 most installed applications. A specific performance analysis of the iPhone X during its launch week revealed high consumer interest, with the device significantly outperforming the iPhone 8 and 8 Plus in active usage. The data suggests that the iPhone X maintained a stronger appeal among high-end users compared to flagship offerings from domestic brands, which continued to focus primarily on mid-to-low-end market segments. These findings, supported by data from the independent smart data platform TalkingData, underscore a market that is increasingly defined by high-frequency mobile engagement, rapid adoption of new hardware, and a robust, localized app ecosystem.
Newzoo · 2017
Report