Mobile Games
The mobile market by genre, from hypercasual and puzzle to midcore and idle.
413 documents
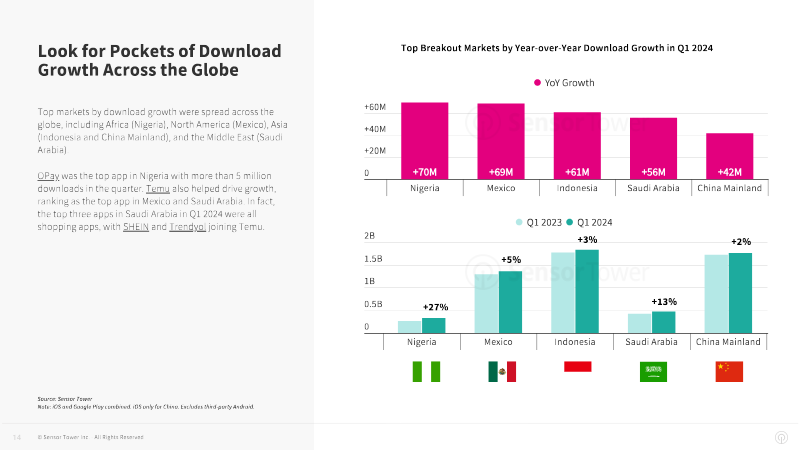
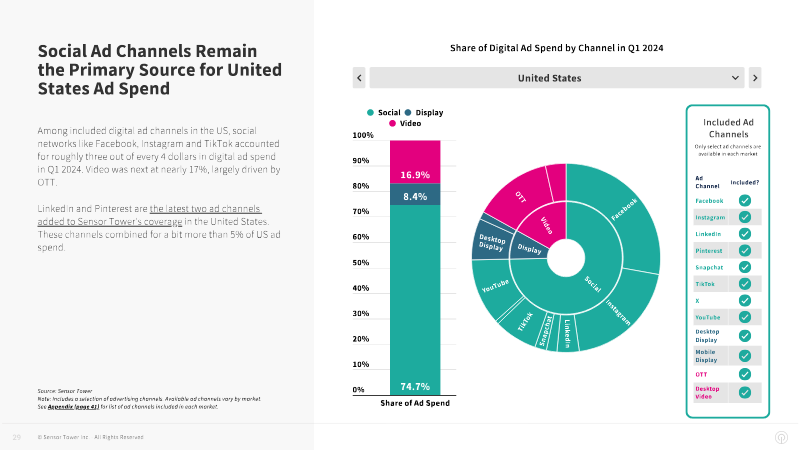
Sensor Tower · 2024
ReportQ1 2024 Digital Market Index
In the first quarter of 2024, the mobile gaming market showed a clear shift away from hyper‑casual titles, which experienced a year‑over‑year decline of more than ten percent across all major platforms. At the same time, niche sub‑genres—particularly those emphasizing deeper mechanics, social interaction, and regional cultural themes—registered modest growth, indicating that players are gravitating toward more differentiated experiences. Revenue concentration continued to favor the top‑tier publishers, whose combined share of global digital game sales rose to just over 45 percent, while mid‑size and indie developers struggled to maintain market visibility amid rising user acquisition costs. Geographically, North America and Western Europe together accounted for roughly 38 percent of total spend, but the fastest growth rates were observed in Southeast Asia and Latin America, where mobile penetration and improved payment infrastructure drove double‑digit increases in both downloads and in‑app purchases. The overall market size reached $23.7 billion in Q1, representing a 4.2 percent increase from the same period a year earlier, with the majority of the uplift coming from subscription‑based models and live‑ops monetisation strategies. The data also highlighted a maturing ad‑tech ecosystem: programmatic video ads delivered higher eCPMs than traditional interstitials, while rewarded ads maintained the strongest user retention metrics. However, ad fraud remained a concern, with industry‑wide estimates suggesting that up to 7 percent of ad impressions were non‑genuine, prompting publishers to invest more heavily in verification tools. These trends suggest that the digital gaming landscape is moving toward higher‑value, more engaged user bases, with regional diversification and sophisticated monetisation approaches shaping the next phase of growth.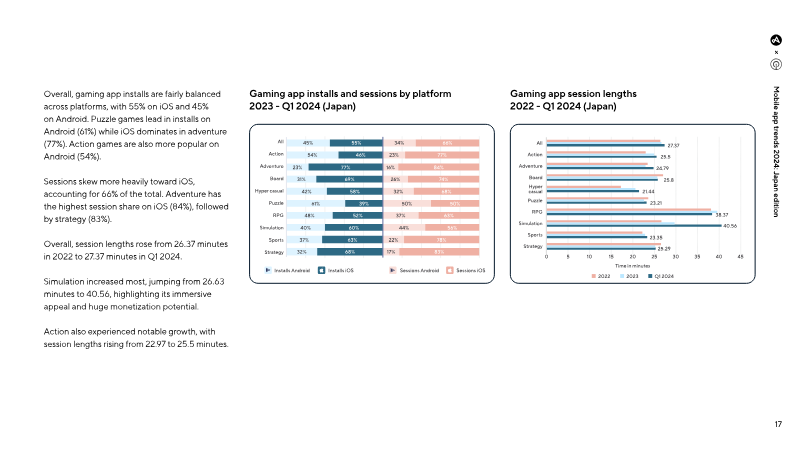

Sensor Tower · 2024
ReportMobile App Trends 2024: Japan Edition
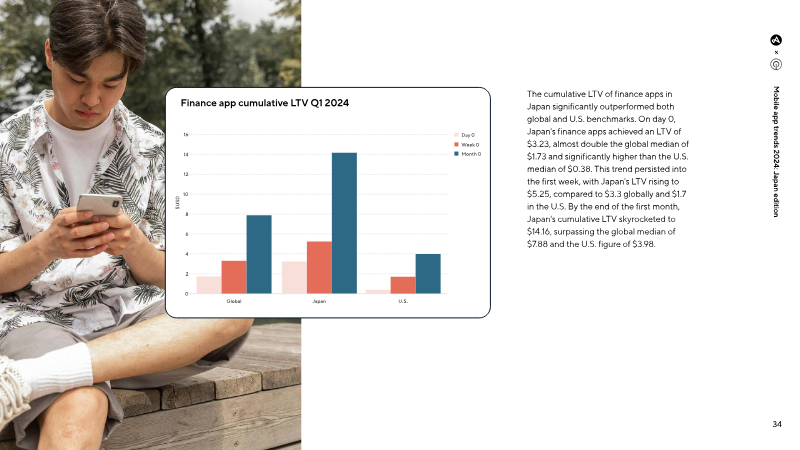
The Japanese mobile app market maintains its status as a global powerhouse, generating $17.9 billion in consumer spending and 2.5 billion downloads in 2023. Despite a marginal decline in annual installs, the market demonstrated a strong recovery in the first quarter of 2024, characterized by a 3.5% rise in spending and a 3% increase in downloads. This growth is underpinned by high user engagement and a notable 30% ATT opt-in rate within the gaming sector, signaling a resilient ecosystem for data-driven marketing and monetization. Mobile gaming remains the primary revenue driver, with RPGs accounting for nearly half of all consumer spend and achieving a high average revenue per monthly active user of $5.09. However, the landscape is evolving toward deeper immersion, as evidenced by simulation games reaching average session lengths of over 40 minutes. Simultaneously, the finance and e-commerce sectors are experiencing rapid expansion. Finance apps saw a 53.5% spending surge in early 2024, while e-commerce lifetime value in Japan reached $9.67 by the end of the first month, nearly doubling global medians. Strategic shifts in user acquisition are evident across all segments, with a marked transition toward paid channels. The paid-to-organic install ratio for gaming reached 2.31 in early 2024, while finance and e-commerce also saw significant increases in paid acquisition efforts. This trend is complemented by the emergence of Connected TV as a critical performance channel. With ad spend projected to reach 170 billion yen by 2025, advertisers are increasingly reallocating budgets from social media to CTV to leverage its high viewership and its proven ability to assist in driving mobile app installs through sophisticated measurement and AI-driven creative optimization.

SocialPeta · 2024
ReportMarketing Insights into Global Casual & Puzzle Games for Q1 2024
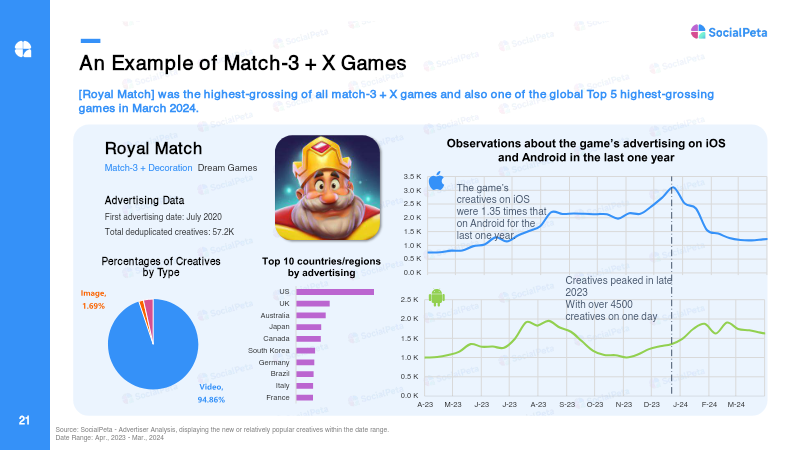
The global mobile gaming landscape in the first quarter of 2024 is characterized by a significant expansion in the advertiser base, which grew nearly 29% year-over-year to approximately 51,300 monthly active participants. Despite this increase in competition, the volume of unique creatives per advertiser decreased by 18%, signaling a strategic shift toward quality over quantity. Casual and puzzle games remain the primary drivers of this ecosystem, collectively representing half of all active advertisers. Casual games alone account for nearly 40% of total ad creatives, with the most intense market activity concentrated in Europe and the United States. In these regions, success is increasingly dependent on high-quality, short-form video content and rapid creative iteration to combat player fatigue. Performance data indicates that iterative content updates and rigorous A/B testing are essential for scaling titles in a saturated market. Successful case studies demonstrate that optimizing level depth and refining monetization strategies can yield substantial financial gains, as seen in the 32% increase in average revenue per user for Camo Snipper and the continued dominance of Royal Match as a top-five global grossing title. Furthermore, the rapid international expansion of instant games from Chinese developers highlights a growing trend toward cross-border competition. To penetrate diverse markets such as Japan, South Korea, and Southeast Asia, developers are increasingly relying on localized ad creatives and influencer marketing to bridge cultural gaps. The scope of these findings encompasses a broad geographic range, including Southeast Asia, the Middle East, South America, and East Asian territories. By analyzing these regional clusters, it becomes clear that while the casual and puzzle segments are globally ubiquitous, effective execution requires a nuanced understanding of local preferences. The current market environment demands a sophisticated balance between broad-reach advertising and localized engagement strategies to maintain growth and profitability in the face of rising advertiser density.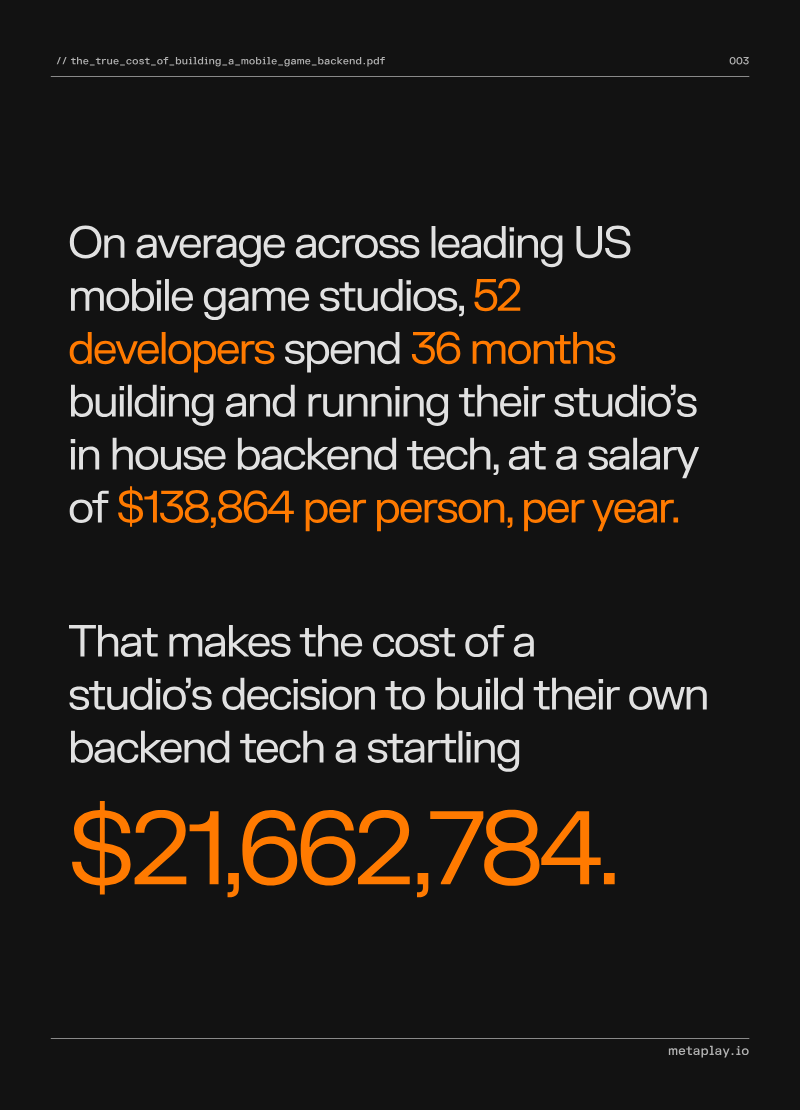

Metaplay · 2024
ReportThe True Cost of Building a Mobile Game Backend
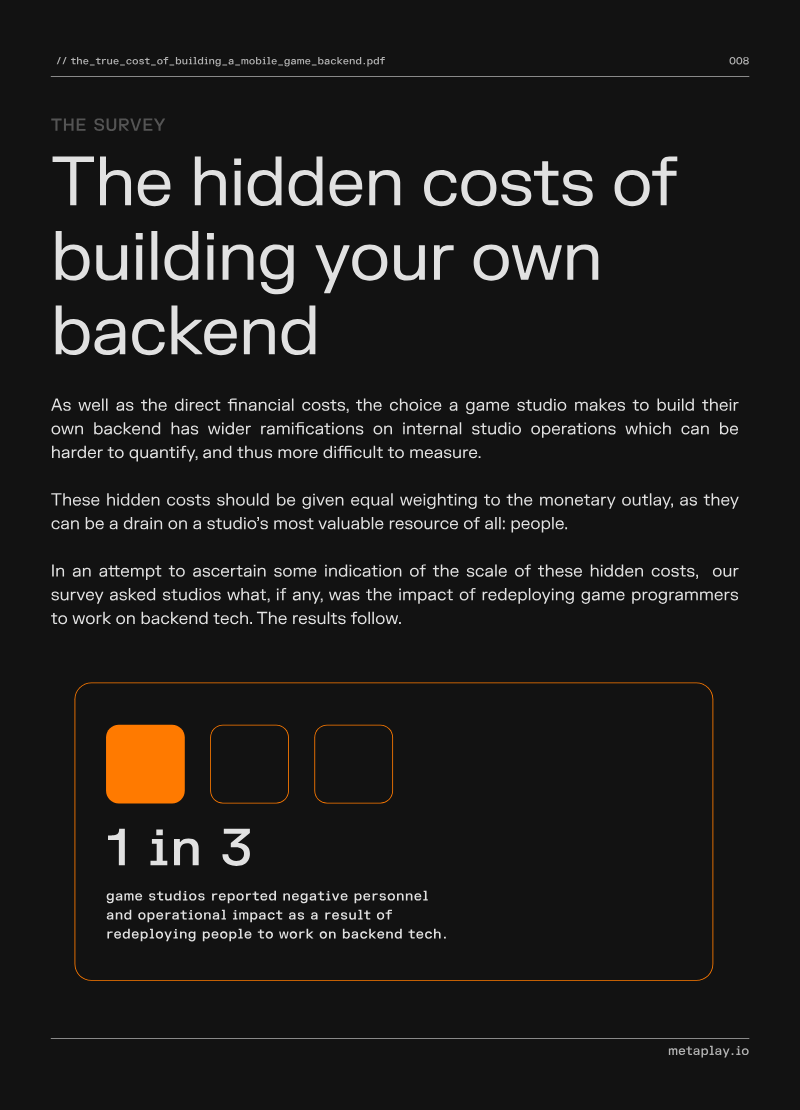
This analysis examines the financial and operational costs associated with developing in-house backend technology for mobile games. The primary thesis suggests that while third-party game engines have become industry standards, backend infrastructure is currently undergoing a similar shift as the technical demands of live-service games outpace the practicality of internal development. The findings are based on a survey of 125 C-level executives and tech leads at US-based mobile game studios with at least 50 employees, conducted in April 2024. Data indicates that the average leading US studio employs 52 developers for 36 months to build and maintain an internal backend. With an average annual salary of $138,864 per developer, the direct financial investment for a custom backend is estimated at approximately $21.6 million. The research notes that strategy and shooter genres are most likely to require these complex systems, while hypercasual games are increasingly adopting them to support "hybridcasual" live-ops models. Beyond direct costs, the analysis identifies significant "hidden" human and operational tolls. Approximately 50% of surveyed studios reported that diverting gameplay programmers to backend tasks slowed overall game development. Furthermore, one-third of respondents experienced higher employee turnover and increased "crunch" periods, while 20% reported direct revenue loss. The study concludes that the decision to build internal tech often results in negative knock-on effects across departments, suggesting that third-party solutions offer a more sustainable path for scaling live-service titles without sacrificing personnel well-being or development velocity.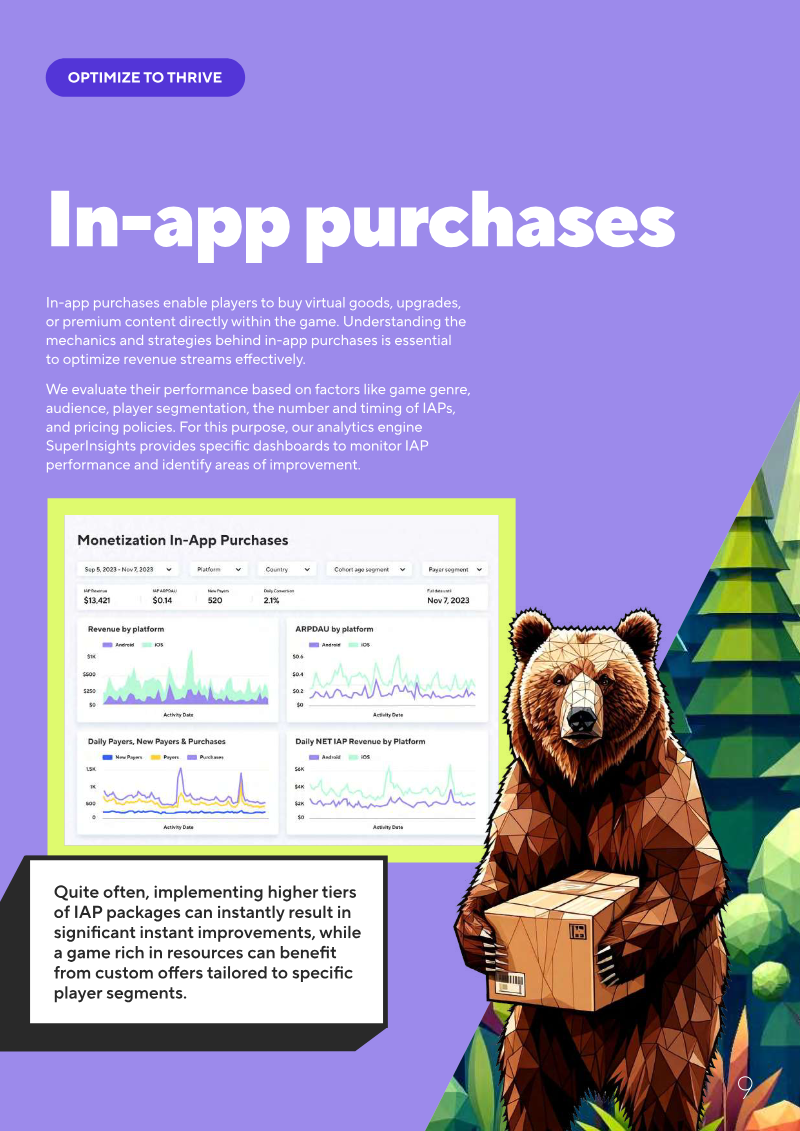


SuperScale · 2024
ReportTurning Organic Success into Long-Term Revenue: A Framework for F2P Mobile Games
This industry guide provides a strategic framework for mobile game developers to transition from initial organic traction to sustainable, long-term revenue growth. The central thesis argues that while organic "sparks" are invaluable, lasting success requires a rigorous, two-step approach: first, optimizing the game’s internal economy for maximum Lifetime Value (LTV), and second, deploying data-driven paid User Acquisition (UA) campaigns. The first phase focuses on monetization through ad mediation and in-app purchases (IAP). Key findings suggest that implementing a hybrid ad mediation setup—combining real-time bidding with manual waterfalls—can yield a 10% to 20% uplift in Average Revenue Per Daily Active User (ARPDAU) immediately. The analysis emphasizes the importance of rewarded ads over intrusive interstitials and highlights that personalized, segmented IAP offers can increase player spending by up to 23%. It also advocates for regional pricing, noting that price cuts in lower-purchasing-power markets can boost ARPDAU by as much as 30%. The second phase details a methodology for scaling through paid UA, emphasizing the necessity of accurate data post-IDFA. The guide recommends a three-step framework of assessment, preparation, and optimization. It advises that while platforms like Meta and TikTok are accessible for smaller budgets, larger networks typically require a minimum monthly spend of $20,000 to exit the "learning phase" effectively. Furthermore, it stresses the role of App Store Optimization (ASO), citing a case where a simple icon change resulted in a 90% install uplift. The scope of the analysis covers the global free-to-play (F2P) mobile gaming market, applicable to various genres and studio sizes. The methodology relies on industry benchmarks, case studies, and data from SuperScale’s proprietary analytics engine, SuperInsights. The overarching conclusion is that developers must treat monetization and UA as iterative, scientific processes, using predictive modeling to forecast Return on Ad Spend (ROAS) up to a year in advance to ensure business-level profitability.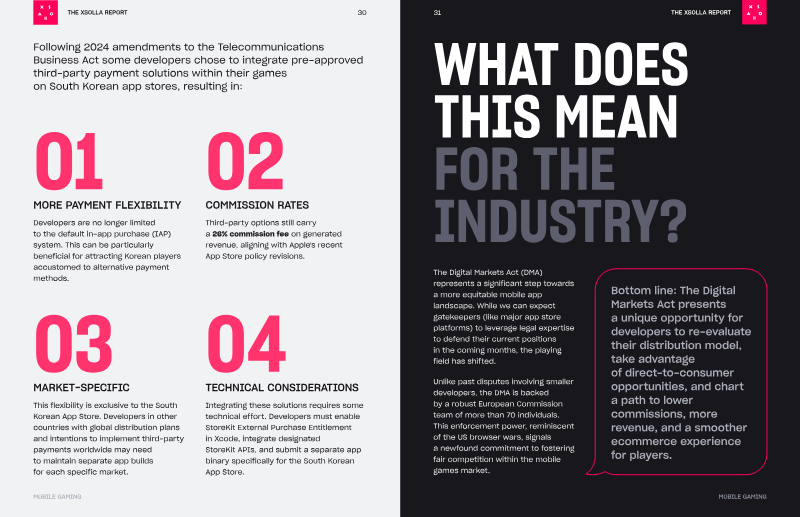

Xsolla · 2024
ReportState of Play: Spring Edition
Mobile gaming has solidified its position as the industry’s primary driver, currently engaging 1.9 billion players and tracking toward $118 billion in annual revenue by 2027. This growth is occurring alongside a fundamental restructuring of digital commerce. Regulatory shifts, such as the European Union’s Digital Markets Act and recent judicial rulings, are dismantling the traditional walled gardens of major app stores. By forcing the adoption of alternative billing systems and out-of-app commerce, these changes allow developers to bypass standard commission fees and engage in direct-to-consumer marketing, fundamentally altering the economics of mobile distribution. The industry is simultaneously transitioning toward a cross-platform ecosystem where seamless play and unified payment systems across mobile, PC, and console are becoming standard. Consumer behavior supports this shift, as 87% of multiplayer gamers now engage in cross-platform play. Younger demographics, specifically Gen Alpha and Gen Z, exhibit a 52% payer conversion rate, significantly outperforming older cohorts. To capture this value, developers are increasingly forming strategic alliances with telecommunications providers to integrate 5G infrastructure and mobile wallets, ensuring frictionless transactions in a "cross-pay" environment. Despite a significant cooling in investment during 2023—characterized by a 75% drop in Web3 funding and a 43% decline in merger and acquisition activity—the sector is recalibrating toward a sustainable "new normal." The workforce is becoming more formalized, with nearly three-quarters of designers holding university degrees. Market analysts anticipate a recovery throughout 2024, marked by a 20% increase in deal flow and the entry of major media entities like Netflix and Disney. This stabilization is supported by a shift in venture capital toward alternative models that prioritize marketing and operational support over traditional equity-only investments.
Apptica · 2024
ReportState of the Market 2023: An Annual Analysis of App Market and Advertising Activities
The 2023 market analysis evaluates global mobile advertising performance, concentrating on the two dominant operating systems, iOS and Android, and the leading social platforms that drive ad spend. Facebook and Instagram continue to command the largest share of the social advertising ecosystem, reinforcing their status as primary channels for marketers seeking broad reach and engagement across diverse audiences. Video advertising emerged as the pre‑eminent format throughout the year, registering a 16 % increase on iOS and a markedly higher 37 % rise on Android. This divergence underscores Android’s accelerating momentum in video consumption and ad adoption, while iOS maintains steady growth. Interactive ad formats also showed modest gains, with a 2.7 % uplift on iOS, indicating a gradual shift toward more engaging user experiences, though the expansion remains limited compared with video. Overall, the findings suggest that mobile video continues to dominate revenue generation, with Android delivering the strongest growth trajectory. The incremental rise in interactive formats points to emerging opportunities for richer creative solutions, yet video’s dominance will likely shape strategic allocations for the coming year. These trends highlight the importance of platform‑specific optimization and the need for advertisers to balance high‑impact video placements with exploratory interactive formats to maximize reach and performance across the mobile landscape.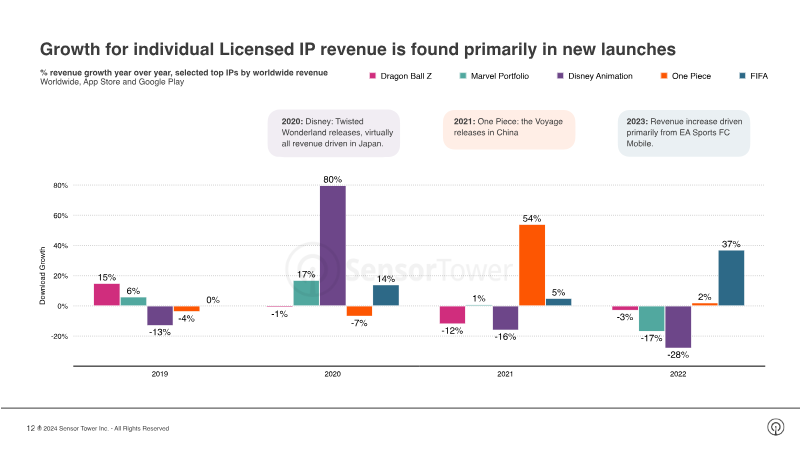
Sensor Tower · 2024
ReportLandscape Shifts in IP Gaming: An Analysis of How the Competitive Landscape of IP in Gaming Has Shifted in 2023
The global gaming landscape in 2023 was defined by the overwhelming commercial dominance of established intellectual properties, which accounted for every top launch on PC and console. Licensed mobile titles generated $16 billion in gross revenue, driven largely by the unprecedented success of Monopoly GO!, which reached $1 billion in revenue in under seven months. This performance propelled Hasbro and Scopely to the top of the corporate and publisher rankings, respectively. While video game and anime IPs continue to command the largest market share—particularly in Asia where they account for 70% of downloads—board game IPs experienced a significant revenue surge within the United States. Strategic integration of IP serves as a critical driver for both monetization and marketing efficiency. Role-playing games remain the most lucrative genre for licensed content due to the effectiveness of gacha-based monetization, while cross-platform collaborations and limited-time events continue to expand audience reach. Furthermore, established franchises demonstrate superior cost-efficiency compared to original titles, achieving high sales volumes with significantly lower marketing expenditures. This suggests that leveraging recognized brands provides a vital competitive advantage in an increasingly crowded marketplace. Despite the high visibility of major hits, the mobile IP market remains largely unsaturated, with licensed titles currently accounting for less than 20% of total revenue across most genres. While RPGs and social casino mechanics have proven successful, casual categories such as puzzle and simulation games represent significant untapped opportunities for future integration. Growth in the sector is increasingly dependent on high-profile new launches rather than the expansion of legacy titles, indicating that the strategic selection and execution of new IP partnerships will dictate the next phase of industry expansion.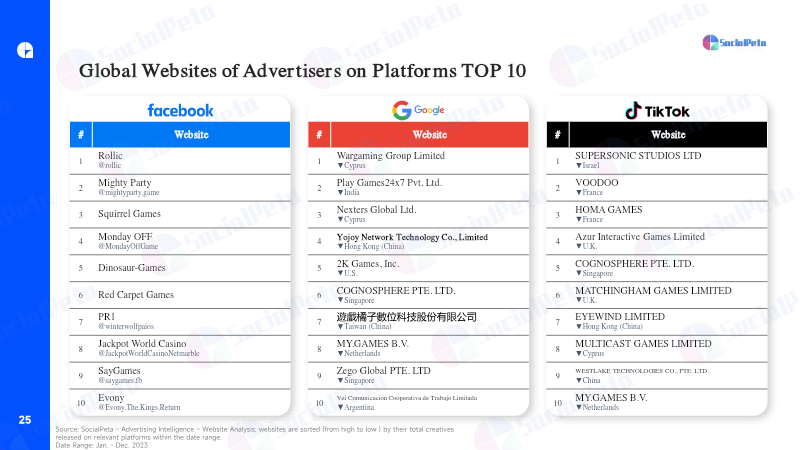
SocialPeta · 2024
Report2023 Global Mobile Games Marketing Trends White Paper
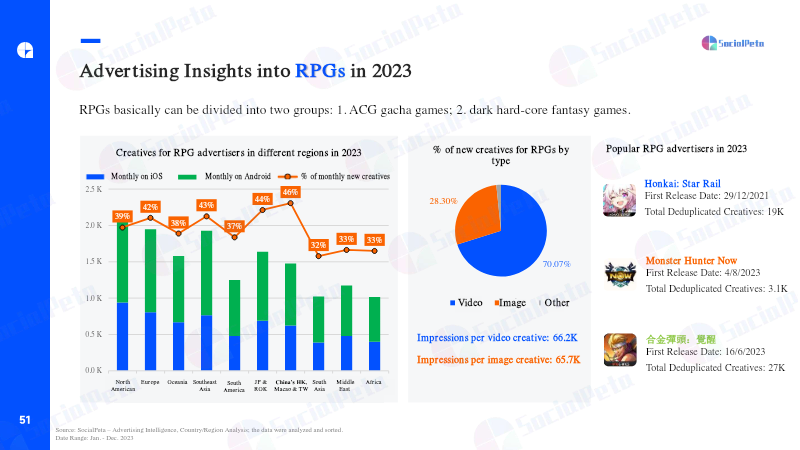
The global mobile gaming landscape underwent a significant transformation in 2023, characterized by a strategic shift toward the hybrid-casual model. This evolution combines the accessibility of hyper-casual mechanics with the monetization depth of mid-core titles, utilizing a mix of in-app advertising and in-app purchases to stabilize revenue. Marketing efforts were defined by a nearly 50% year-over-year surge in monthly active advertisers, exceeding 40,000 globally. While North America maintained its leadership in total advertiser volume, Southeast Asia emerged as the most competitive region for creative output. Concurrently, Android became the primary focus for volume-driven campaigns due to ongoing iOS privacy restrictions, though iOS remained the preferred platform for high-value mid-core and hard-core marketing. Creative strategies pivoted toward high-impact visual storytelling and the integration of generative AI to manage rising user acquisition costs. Although video remains the dominant format, accounting for over 76% of impressions, AI-generated image creatives gained significant traction, particularly in square formats. Developers increasingly utilized "mini-game" ad patterns—such as ASMR, dramatic narratives, and deliberate failure scenarios—to lower entry barriers for complex genres like Simulation and Strategy games. Meanwhile, RPG and Casino titles leaned heavily on influencer collaborations and live-action content to drive engagement in emerging markets across Southeast Asia and the Middle East. Sustainable growth in 2024 depends on a holistic integration of AI-driven production and programmatic transparency. The successful global expansion of Chinese-developed mini-games and the revitalization of legacy titles through trending ad mechanics illustrate a broader trend of creative agility. By analyzing over 1.4 billion ad creatives across 70 countries, it is evident that the industry is moving toward a data-driven future where high-engagement formats like rewarded ads and user-generated content are essential for navigating a fragmented and privacy-conscious global market.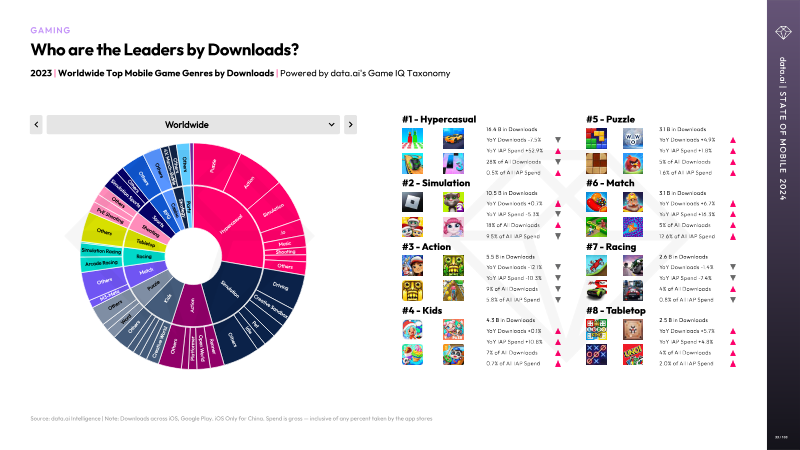
data.ai · 2024
ReportState of Mobile 2024
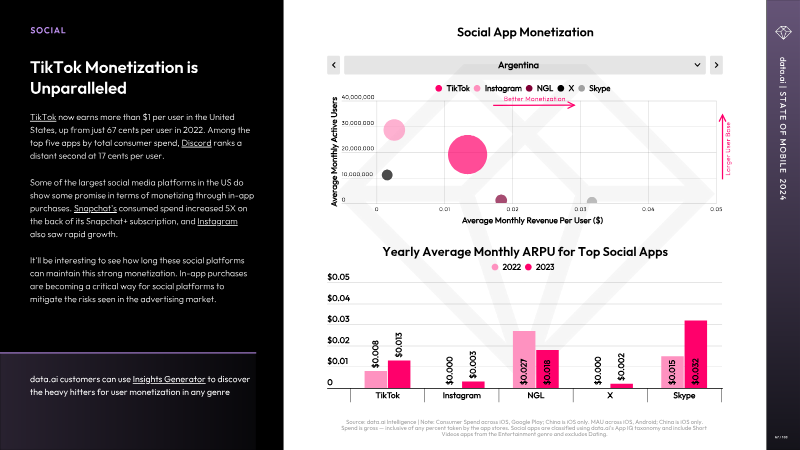
The global mobile economy experienced a significant recovery in 2023, with consumer spending rising 3% to $171 billion and daily engagement surpassing five hours per user in leading markets. While mobile gaming faced a slight 2% contraction in spending due to economic headwinds and a shift toward longer title life cycles, the broader industry was bolstered by a resilient non-gaming sector. This growth was primarily driven by social media "tipping," video streaming subscriptions, and the rapid emergence of generative AI. Mobile advertising also remained a cornerstone of the ecosystem, reaching $362 billion with projections to exceed $400 billion in the coming year. The landscape is increasingly defined by a shift in consumer behavior and monetization strategies. Non-gaming apps reached a record $64 billion in spend, led by TikTok, which became the first non-game app to surpass $10 billion in lifetime revenue. In contrast, the gaming market saw a decline in new hit releases, with the industry consolidating around established high-fidelity IPs and social multiplayer genres like Creative Sandbox and Battle Royale. Despite this consolidation, breakout successes like Monopoly GO and Honkai: Star Rail demonstrated that high-quality debuts can still disrupt saturated markets. Across various sectors, mobile integration has reached unprecedented levels. Travel and ticketing apps saw record-breaking demand as consumers returned to in-person events, while the finance sector experienced a surge in personal loan apps and "Super Apps" amid global inflation. Retail also underwent a structural shift as China-based platforms like Temu gained significant global market share. Ultimately, the 2023 data reflects a mature mobile market where growth is increasingly tied to sophisticated AI integration, creator-driven economies, and the transition of traditional services into comprehensive digital hubs.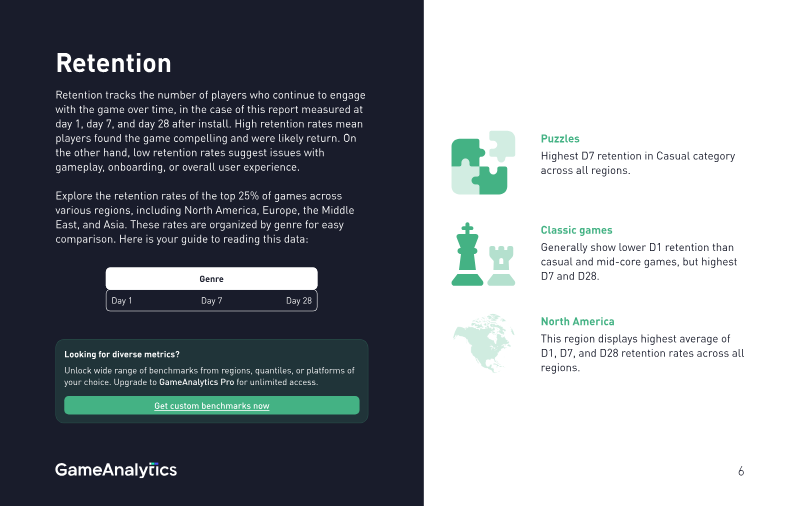
GameAnalytics · 2024
ReportMobile Gaming Benchmarks: Q1 2024
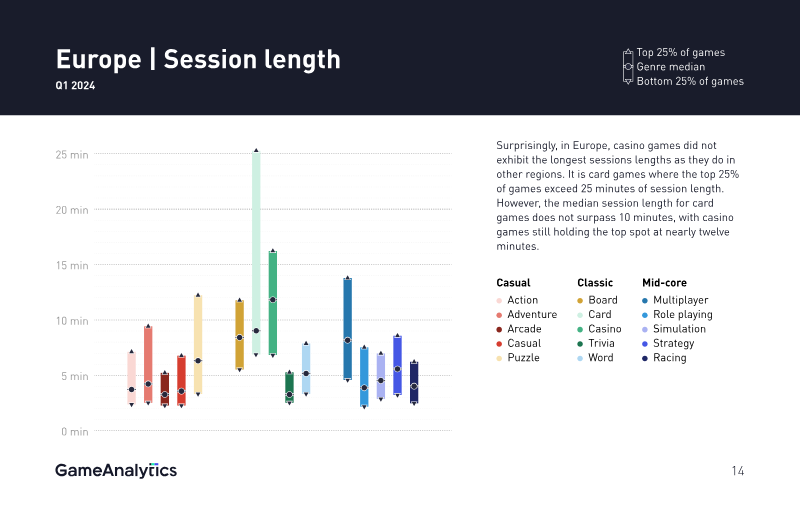
The Q1 2024 mobile gaming benchmarks provide a comprehensive analysis of player engagement metrics, specifically retention rates, session lengths, and session counts across 15 game genres. The analysis is based on data from over 10,000 games utilizing the GameAnalytics platform, representing 1.67 billion monthly active users across North America, Europe, the Middle East, and Asia. The primary objective is to offer developers a standardized framework to evaluate game performance, identify areas for optimization, and refine mechanics to improve long-term player retention and engagement. Key findings indicate that global median retention rates for the first quarter of 2024 were 22.91% for Day 1, 4.20% for Day 7, and 0.85% for Day 28. Classic games—encompassing board, card, casino, and trivia titles—consistently outperformed other genres across most regions and metrics. While North America and Europe generally exhibit higher retention averages, the Middle East shows a distinct preference for classic games, which achieve their highest regional performance there. Puzzle games also demonstrate notable stability, maintaining consistent engagement metrics across all monitored territories. Regarding session behavior, the global median session length is 4.45 minutes, with most genres averaging 4 to 5 sessions per day. Europe leads in session duration, while the Middle East records the highest frequency of daily sessions, particularly within the puzzle and word genres. The analysis suggests that session length and frequency are highly correlated with game pacing and social features. To optimize these metrics, the findings recommend a data-driven approach involving A/B testing, funnel analysis, and the implementation of LiveOps to adapt to player behavior in real-time.
Liftoff · 2024
Report