Marketing & User Acquisition
Campaigns, ad creatives, app store optimization and the cost of a player.
232 documents
Tenjin · 2023
ReportFrom Hyper to Hybrid: 2023 Follow-up
The mobile gaming landscape experienced a notable shift in monetization and user acquisition patterns between 2022 and the first half of 2023. In-app purchase (IAP) activity demonstrated robust growth across both major mobile operating systems, with Android and Apple platforms recording increases of 23% and 24%, respectively. This upward trend in monetization suggests a resilient consumer base despite broader economic fluctuations within the mobile app ecosystem. Geographic distribution of installs remained relatively stable on Android, with India, Brazil, and the United States maintaining their positions as the top three markets. Conversely, the iOS landscape underwent more significant regional changes, as the United Kingdom, Canada, and Germany gained prominence, displacing China and Saudi Arabia from the top five rankings. These shifts highlight the evolving importance of Western markets for iOS-based mobile game developers. Ad network performance also saw a realignment in competitive dominance. On Android, Google Ads ascended to the top position for total installs in the first half of 2023, while Meta entered the top five. On iOS, AppLovin reclaimed the leading position, and Meta secured a top-five spot, reflecting a dynamic advertising environment where major platforms continue to vie for market share. This analysis relies on anonymized data aggregated by Tenjin from January 1, 2022, through June 30, 2023. The findings are restricted to ad networks and countries that achieved a minimum threshold of 25 million installs, ensuring that the reported trends represent significant market activity. By tracking these metrics, the data provides a clear view of the shifting priorities and regional focus areas for mobile publishers navigating the transition toward hybrid monetization models.


Tenjin · 2023
ReportFrom Hyper to Hybrid in 2023
The report examines mobile advertising and in-app purchase (IAP) trends across Android and iOS platforms from January 2022 through June 2023, focusing on the shift toward hybrid marketing strategies. Key findings show a 23% rise in Android IAPs and a 24% increase on Apple, indicating robust revenue growth for both ecosystems. Geographic analysis reveals that India, Brazil, the United States, Indonesia, and Mexico remain the top five Android install markets in both 2022 and H1 2023, while iOS installs shift from China and Japan in 2022 to Canada and Germany in H1 2023, underscoring changing regional appetites. Ad network performance also evolved: Google Ads ascended to the top Android spot in H1 2023, overtaking AppLovin, while Meta entered the top five on both platforms. On iOS, AppLovin moved from second to first place, and Google Ads entered the top five for the first time. These shifts suggest advertisers are reallocating spend toward networks with stronger cross-platform reach and data capabilities. The methodology relies on anonymized Tenjin data collected between 1 January 2022 and 30 June 2023, with rankings limited to networks and countries exceeding 25 million installs. Tenjin positions itself beyond attribution, offering a data-science platform, SKAdNetwork reporting, LTV analytics, automation APIs, and cost aggregation to support hyper-growth for small and medium publishers. The report thus provides actionable insights into platform performance, regional dynamics, and network effectiveness for mobile marketers navigating the hybrid advertising landscape.


data.ai · 2023
ReportState of Mobile 2023
Global mobile usage reached a record in 2023, with users spending an average of more than five hours per day on apps and total advertising expenditure projected at $362 billion, reflecting an 18.5% five-year CAGR. While overall consumer spend dipped slightly in 2022, non-gaming verticals—utilities, productivity tools, and OTT services—experienced robust growth in downloads (11%), spend (9%) and time-spent (14%). Gaming, by contrast, saw a 5% decline in spend despite a surge to nearly 90 billion downloads, with RPGs dominating in-app purchase revenue and hypercasual titles leading download volume. Creative sandbox games such as Roblox and Minecraft drove a 25% rise in global playtime, whereas battle-royale shooters fell by roughly 20%, indicating a shift toward casual, creative experiences and age-segmented targeting. Social platforms continued to shape consumer spending patterns. TikTok surpassed all other non-gaming apps with over $3 billion in 2022, achieving a 17% year-over-year increase in total time spent and leading ARPU at approximately $0.85 per user; its revenue model relies heavily on high-price in-app purchases, while Snapchat’s earnings are largely subscription-based. In the travel sector, airline and transportation apps such as Uber and Moovit dominated downloads across iOS and Google Play, with steady growth in North America and emerging markets like Mexico and Brazil. Sports-focused apps remained fragmented yet profitable, driven by live-score trackers and fan engagement platforms that generate high-frequency usage. Geographically, the top ten markets—China, India, the United States, Brazil, Indonesia and others—contributed the majority of downloads and spend, with pockets such as Mexico, Hong Kong and Brazil exhibiting 15–34% year-over-year growth. The data underscore a continued dominance of mobile advertising, resilience of non-gaming verticals amid economic headwinds, and the importance of diversified monetization strategies across social and gaming segments.


Tenjin · 2023
ReportFrom Hyper to Hybrid in 2023 (2023)
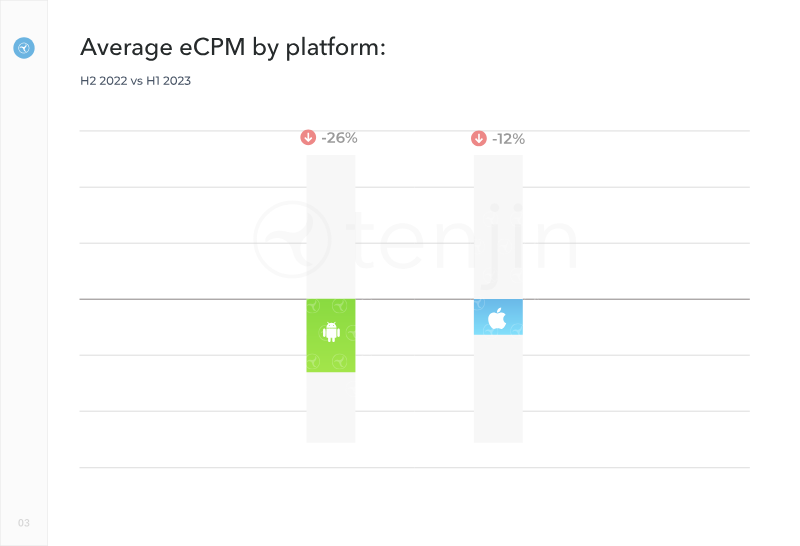
The report examines the evolving landscape of mobile gaming in 2023, focusing on the decline of pure hyper-casual profitability and the rise of hybrid models that blend ad revenue with in-app purchases. It attributes the downturn to factors such as iOS App Tracking Transparency, post-COVID user behavior shifts, and stricter publisher gatekeeping that now demands “absolute hit” metrics. Consequently, developers increasingly self-publish and diversify monetization strategies, incorporating IAPs and meta gameplay elements. Key findings highlight that India leads in ad impressions and IAP volume, while the United States dominates eCPM earnings across both Android and iOS platforms. Apple Search Ads remains the top iOS ad network, securing three of the highest positions, whereas Applovin dominates Android advertising. In monetization channels, ironSource and Meta networks top the rankings for revenue generation on both operating systems. The data set spans global markets, covering major regions such as North America and Asia, and includes both Android and iOS ecosystems. The methodology relies on Tenjin’s comprehensive data warehouse, aggregating millions of installs and ad impressions to produce rankings and predictive insights. The analysis integrates LTV prediction models, attribution visualization, and advanced metrics to provide actionable guidance for publishers transitioning from hyper-casual to hybrid monetization strategies.


AppsFlyer · 2023
ReportThe State of Mobile Gaming in India: 2023
India’s mobile-gaming ecosystem is experiencing rapid expansion, with a projected market value of $8.6 billion by 2027 and more than 600 million active users. Growth is fueled by affordable smartphones, low data costs, and a pandemic-accelerated surge in casual, hyper-casual, and real-money titles. Install rates spiked up to 90% during lockdowns, while in-app purchase revenue is expected to reach $284 billion by 2026. To sustain this momentum, brands must deploy comprehensive customer-engagement platforms that provide real-time analytics, segmentation, and personalized push campaigns to enhance retention and monetization. Push notifications and in-app messaging prove critical for user engagement. Data shows a 3.34% click-through rate and up to 91% delivery success for push alerts, while in-app campaigns achieve 15–44% conversion rates and a 38% average on one million impressions. Segmentation techniques such as RFM, affinity profiling, and predictive AI models (e.g., Sherpa) enable targeted, omnichannel flows that reduce churn and lower acquisition costs—new customers cost five times more than retaining existing ones. App Store Optimization tools like AppTweak further amplify visibility; for instance, RummyCircle’s keyword strategy increased visibility by 14.2% and drove a 200,000-download spike after A/B testing. Despite the market’s growth, brands face declining installs, stickiness, and revenue. The solution lies in data-driven engagement: hyper-personalized messaging powered by AI unlocks deeper customer insights, improves retention, and provides a competitive advantage. Platforms such as MoEngage, already trusted by Fortune 500 and internet-first brands worldwide, offer the scalability required for publishers to thrive in India’s dynamic mobile-gaming landscape.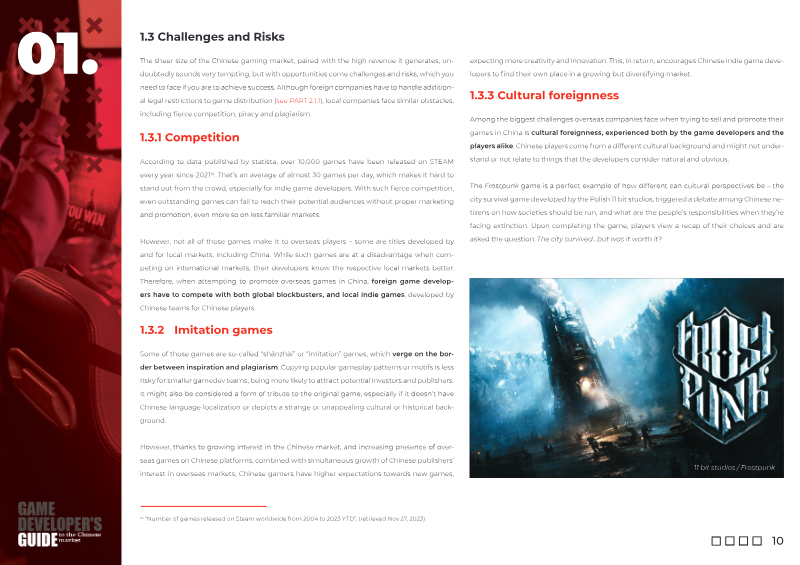

Indie Games Poland Foundation · 2023
ReportDeveloper's Guide to the Chinese Market
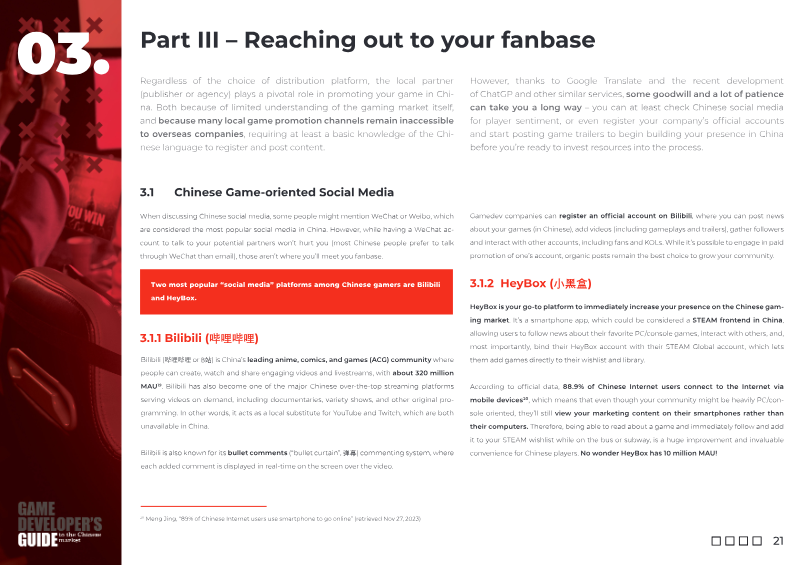
The Chinese gaming market represents a massive, recovering ecosystem that reached a record 668 million players by mid-2023. While mobile gaming accounts for two-thirds of total revenue, the PC and console segments remain vital, supported by an estimated 55 million users on Steam. Despite this scale, the market presents a high barrier to entry characterized by rigorous regulatory oversight, intense domestic competition, and distinct cultural preferences. Success in this region hinges on a sophisticated understanding of local infrastructure, including the mandatory ISBN licensing process for domestic distribution and the necessity of adapting technical frameworks to function without blocked global services. Navigating this landscape requires more than simple translation; it demands comprehensive localization of aesthetics, humor, and social-oriented multiplayer features. Because regulatory compliance is strict—requiring the removal of prohibited themes and foreign text—collaboration with experienced local publishers is essential. These partners provide the institutional knowledge required to manage complex government approvals and navigate the unique social media environment. Developers are encouraged to move beyond Western-centric marketing strategies, instead prioritizing engagement on platforms like Bilibili and HeyBox and utilizing native-speaking coordinators to manage relationships with local media and key opinion leaders. While high-profile industry events such as ChinaJoy and WePlay Expo offer significant exposure, developers must balance the high costs of participation against the potential for direct partnership outreach. The market rewards a patient, strategic approach that prioritizes long-term relationship building over immediate gains. By integrating into the local gaming culture, adhering to regional content sensitivities, and leveraging specialized expertise, foreign developers can effectively capture a share of one of the world’s most significant gaming populations.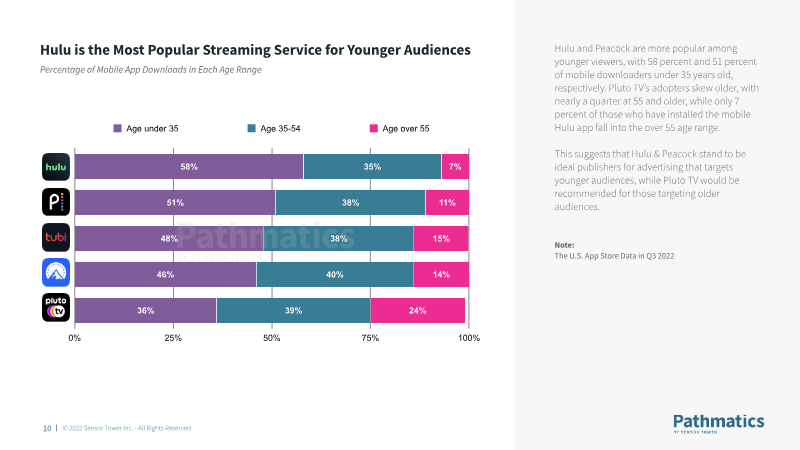
Sensor Tower · 2023
ReportThe State of OTT Advertising in the U.S.: An Analysis of OTT Ad Spending Trends and Top Advertisers
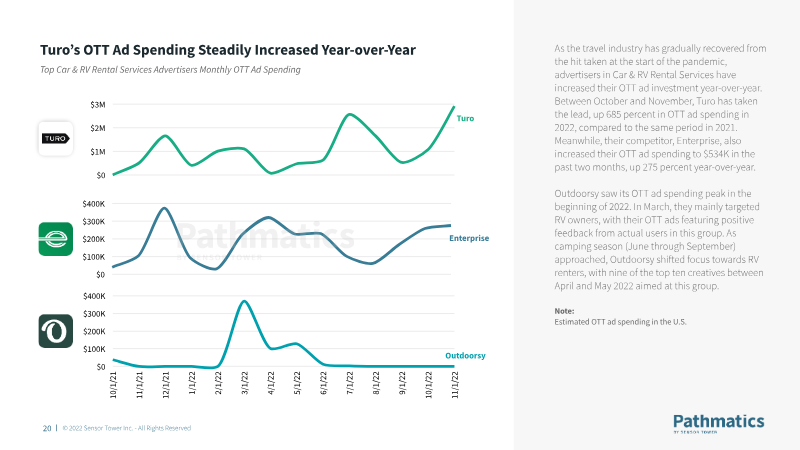
Over the course of late 2021 through 2022, the United States Over-the-Top (OTT) advertising market solidified its position as a critical component of the digital landscape, averaging $3.26 billion in quarterly expenditures. This investment represents nearly 15% of all digital advertising spend, signaling a maturation of the sector. While Financial Services previously led the market, Consumer Packaged Goods emerged as the primary spending category by mid-2022. Simultaneously, the automotive industry demonstrated aggressive expansion with a 74% year-over-year increase in ad spend, reflecting a broader trend of traditional industries pivoting toward streaming platforms to capture shifting consumer attention. Platform dynamics reveal a competitive environment where established services and rising challengers cater to distinct demographics. Hulu and Peacock maintain a strong foothold among viewers under the age of 35, while Tubi has distinguished itself as the fastest-growing publisher, recording a 37% increase in ad revenue. This growth is mirrored by specific service sectors, particularly travel and food delivery, which utilized OTT to drive direct consumer actions. For instance, strategic campaigns from brands like Booking.com and UberEats resulted in measurable performance gains, such as significant spikes in mobile app installations following targeted high-spend periods. The transportation and grocery sectors further illustrate the shift toward OTT-centric digital strategies. Companies like Turo now allocate more than half of their total digital budgets to streaming advertisements, while grocery delivery services saw a 14% year-over-year increase in investment. These trends underscore a broader industry conclusion: OTT has evolved from a secondary experimental channel into a primary driver for brand visibility and user acquisition across the American economy. As brands like United Airlines and Instacart dominate their respective niches, the ability to track creative impressions and seasonal spikes remains essential for navigating this high-growth advertising vertical.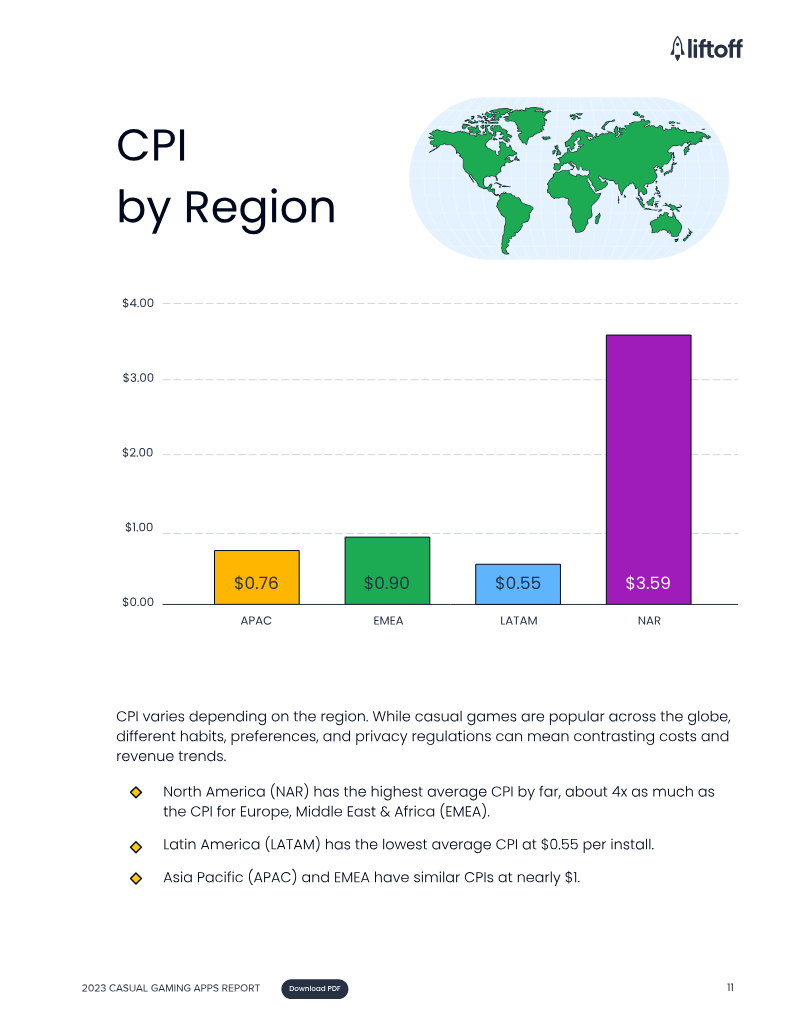

Liftoff · 2023
Report2023 Casual Gaming Apps Report
The casual gaming landscape in 2023 is defined by a strategic pivot from rapid user acquisition toward long-term profitability and sophisticated engagement models. While iOS acquisition costs significantly exceed those of Android at $2.23 compared to $0.63, both platforms achieve a comparable Day-7 return on ad spend of approximately 7.7%. North America remains the most expensive yet lucrative market, yielding an 8.1% return on ad spend despite a high $3.59 cost per install. Simulation games have emerged as a particularly efficient entry point for developers, maintaining the lowest acquisition costs at $0.59. Casual titles serve as the primary engine for the broader mobile ecosystem, driving 74% of installs across all gaming categories and nearly 75% of mid-core installs. Hyper-casual and puzzle games remain the dominant traffic sources, but the industry is increasingly embracing hybridization. This trend involves layering complex meta-elements, such as narrative progression and competitive social features, over simple core mechanics. By blending ad-based and in-app purchase monetization models, developers are successfully targeting crossover audiences and extending the lifecycle of traditionally short-lived genres. Engagement strategies now heavily rely on competitive mechanics and gameplay diversification. Approximately 90% of leading level-based titles utilize solo leaderboards, while over half incorporate team-based races, debunking the myth that casual players avoid competitive environments. Furthermore, nearly a quarter of top-grossing casual games integrate minigames, such as hidden object or board game mechanics, to refresh the user experience and lower acquisition barriers. These features collectively deepen player retention and monetization, signaling a shift toward more robust, feature-rich casual experiences that prioritize player depth over simple volume.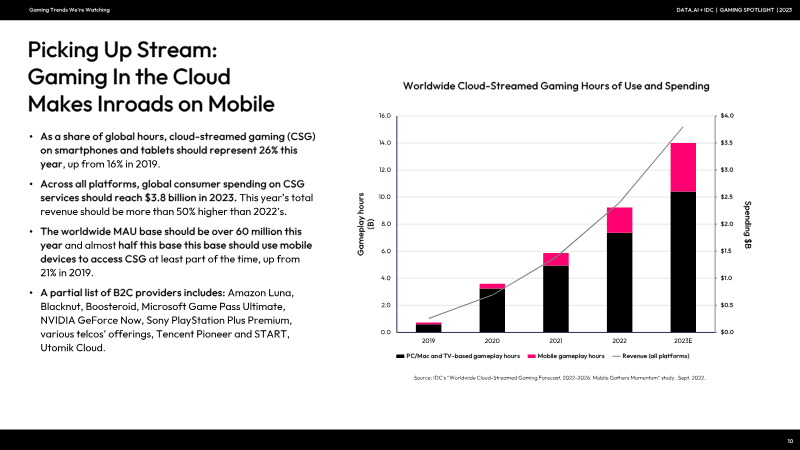

data.ai · 2023
ReportGaming Spotlight 2023 Review
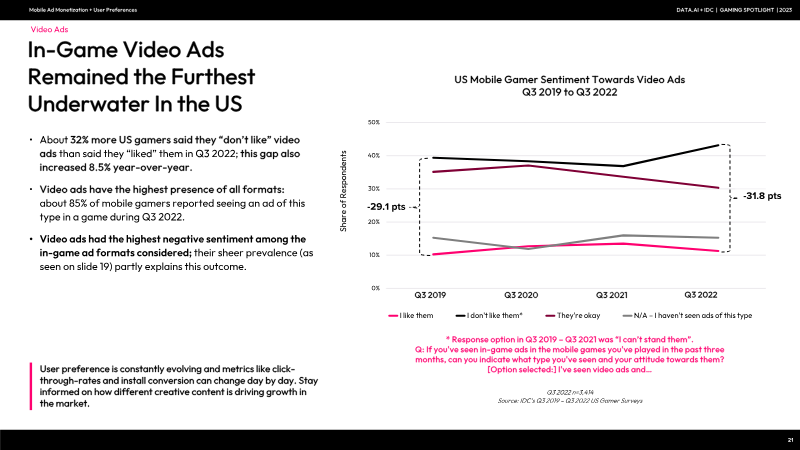
The global gaming market in 2023 was defined by a complex interplay between mobile contraction and steady growth in the PC and console sectors. While mobile remains the industry’s largest segment, consumer spending fell 2% to $108 billion, a decline attributed to macroeconomic instability and privacy-related shifts such as Apple’s App Tracking Transparency framework. Conversely, the PC and home console markets expanded by 4% and 3% respectively, bolstered by the rising popularity of subscription services. Handheld gaming also experienced a demographic fragmentation, with the Nintendo Switch Lite attracting a younger, female-leaning audience while the Steam Deck appealed to older, male gamers. Emerging technologies like cloud-streamed gaming are gaining significant traction, projected to reach $3.8 billion in revenue with mobile devices facilitating over a quarter of global streaming hours. Success in the first half of 2023 was concentrated among high-performing titles that leveraged Gen Z engagement and sophisticated in-app purchase models. Monopoly GO and Honkai: Star Rail emerged as standout performers, generating hundreds of millions in revenue within their first months of release. Established franchises like Royal Match and FIFA Soccer also reached significant lifetime milestones, surpassing $1.7 billion and $1 billion respectively. These successes occurred despite a challenging user acquisition landscape where gamer sentiment toward traditional advertising formats has turned increasingly negative. While rewarded video and playable ads remain the most tolerated formats, overall ad fatigue is rising due to market oversaturation. To navigate this evolving environment, the industry must adapt to shifting privacy standards and the impending implementation of Google’s Privacy Sandbox. Although data suggests that privacy frameworks have not directly damaged iOS ad sentiment, the general decline in ad acceptance necessitates a move toward more diverse formats and contextual market data. Strategic focus is shifting toward combating rising acquisition costs through high-value player engagement and the optimization of cross-platform experiences. As the market stabilizes, the integration of cloud services and the continued dominance of mobile-first economies in emerging regions will likely dictate the next phase of global industry growth.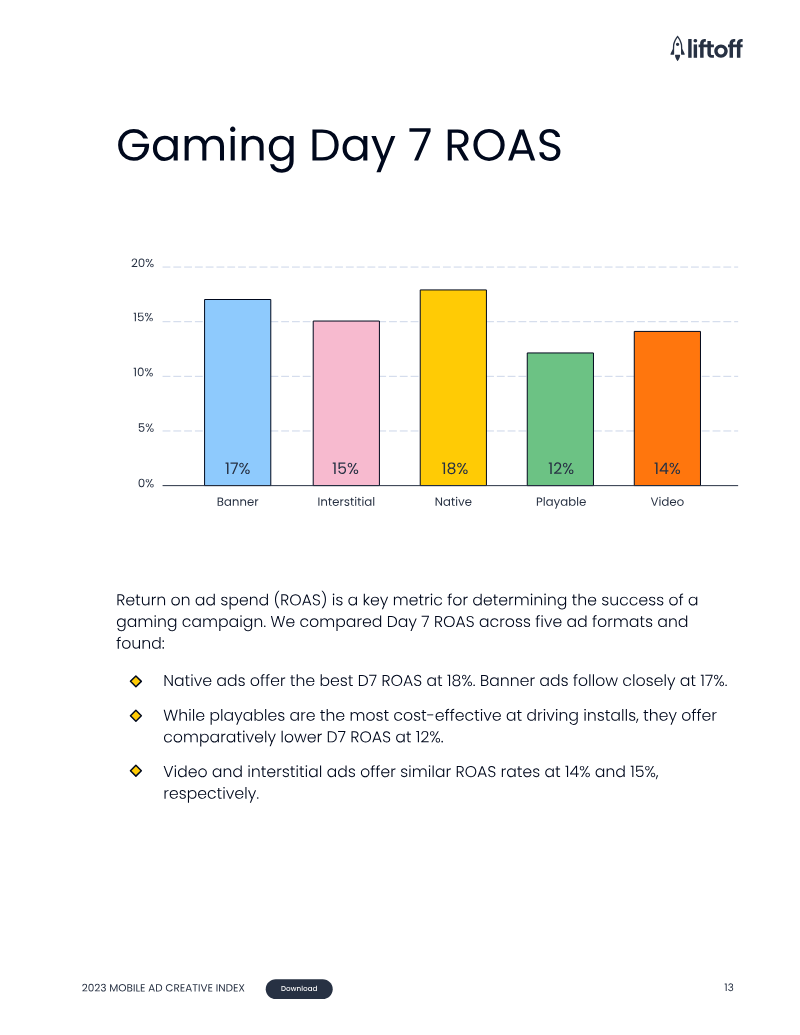
Liftoff · 2023
ReportMobile Ad Creative Index
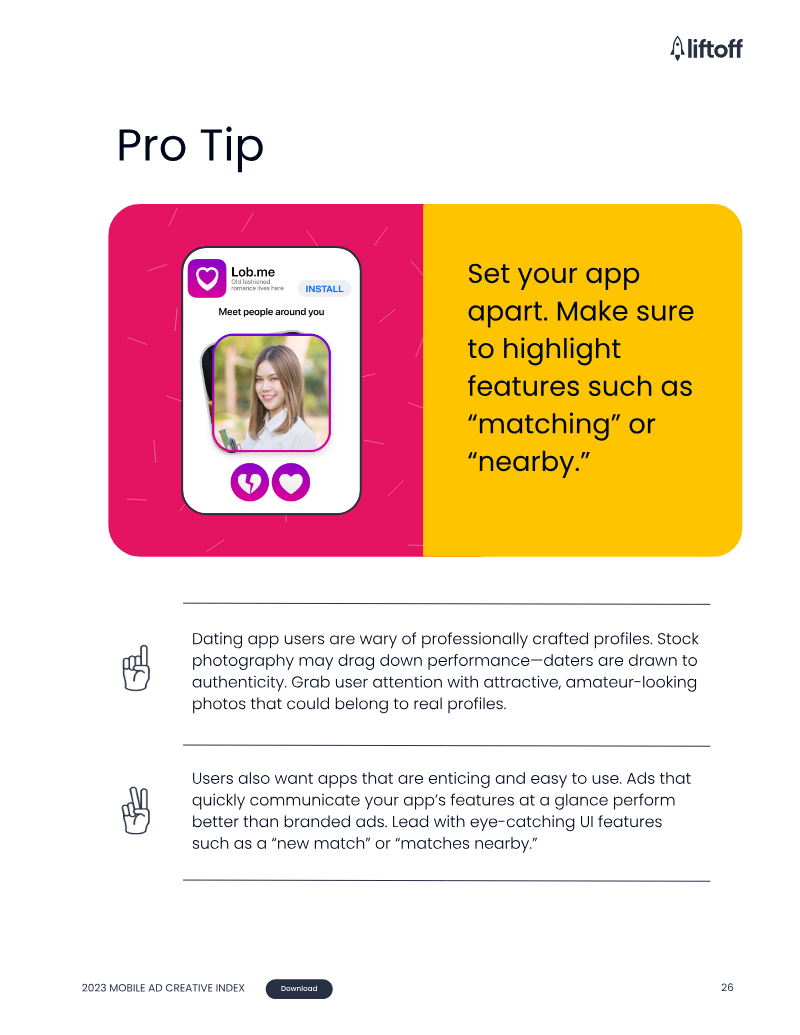
The mobile advertising landscape in 2023 is defined by a strategic shift toward high-performing creative formats as advertisers navigate macroeconomic pressures and evolving privacy regulations. Despite these challenges, mobile ad revenue continues to grow, driven by the efficiency of specific ad types tailored to distinct industry verticals. Native ads emerge as the most cost-effective format overall, boasting a $1.01 cost-per-install and delivering a leading 18% Day 7 return on ad spend within the gaming sector. Meanwhile, playable ads have established themselves as the premier tool for driving gaming installs, while banner ads remain the dominant force in e-commerce due to their low cost-per-action and high conversion rates. Performance metrics across finance, entertainment, and social applications further underscore the importance of format selection. Native and banner ads provide the lowest entry costs for social and dating apps, yet interstitial and video formats yield significantly higher short-term returns, reaching up to 44% Day 7 return on ad spend. Creative strategies are increasingly moving away from lifestyle imagery in favor of clean, user-interface-focused designs. Implementing multi-page ad experiences has proven particularly effective, resulting in a 20% increase in installs per mille. Optimization now relies on a sophisticated blend of interactivity and narrative depth. Interactive playable ads serve a dual purpose by engaging users and gathering valuable audience data, while longer video segments of 31 to 60 seconds drive 50% higher conversions by showcasing complex mechanics and storytelling. Furthermore, the integration of authentic user-generated content that focuses on problem-solving builds necessary trust with modern consumers. By aligning creative content with specific psychological motivations—such as competition or exploration—advertisers can maximize engagement and emotional connection across global mobile markets.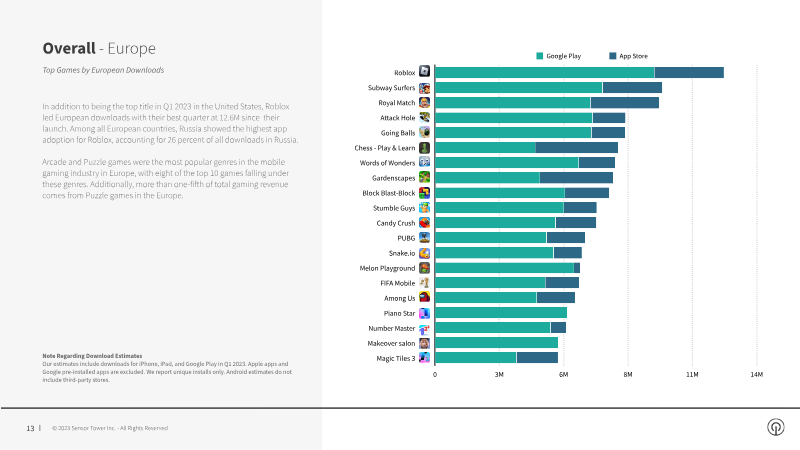

Sensor Tower · 2023
ReportQ1 2023: Store Intelligence Data Digest
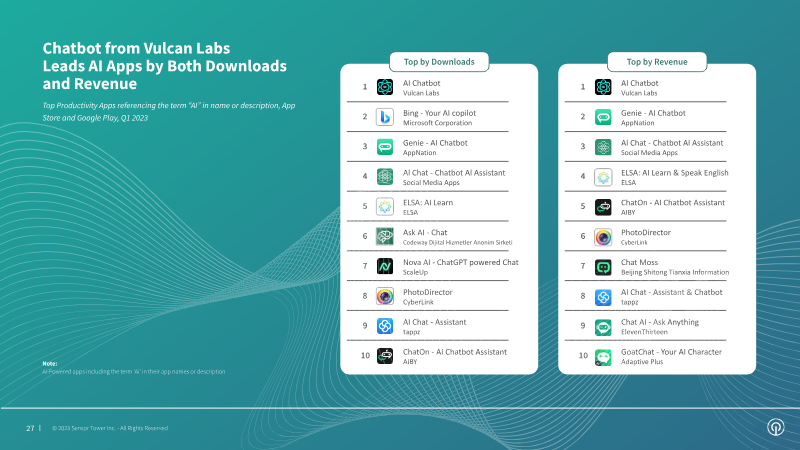
The global mobile app ecosystem experienced a slight contraction in early 2023, with total downloads falling 2.6% year-over-year to 35 billion. Despite this overall decline, the market remained bifurcated between Google Play’s 26.9 billion installs and the App Store’s 8.1 billion. While established giants like Meta and Google maintained their status as leading publishers, TikTok secured its eleventh consecutive quarter as the world’s top app. The gaming sector showed stability through the continued popularity of titles such as Subway Surfers and Roblox, even as broader consumer behavior shifted toward emerging technologies and new retail platforms. The most significant growth occurred within the artificial intelligence and marketplace sectors. AI-powered productivity tools saw an explosive 378% increase in downloads and a nearly 400% surge in revenue, reaching $20 million in quarterly earnings driven primarily by U.S. demand. Simultaneously, the North American retail landscape underwent a major disruption as the Chinese shopping app Temu captured a 50% market share. Following a high-profile Super Bowl campaign, Temu surpassed Amazon in average monthly user engagement, clocking 64 minutes per user. This shift coincided with a general downturn in traditional social networking and messaging installs, though privacy-centric platforms like Telegram and short-video leaders continued to grow. Comprehensive market intelligence across these sectors reveals a digital economy in transition, where established social media dominance is being challenged by specialized AI utilities and aggressive new e-commerce entrants. By tracking performance across major platforms including TikTok, YouTube, and Instagram, data indicates that while total volume may be cooling, high-value engagement is concentrating in specific, high-growth niches. These trends reflect a broader evolution in consumer priorities toward utility-driven AI and highly competitive, gamified shopping experiences.

SocialPeta · 2023
Whitepaper