Skip to main content
Game Industry
Library
Library
Search
Ask AI
News
Connect your AI
Browse
The Catch Up
Topics
Collections
Writers
Help
Subscribe
Game Industry
Library
Library
Search
Ask AI
Saved
Library
223 reports matching your filters
All Types
Reports
Articles
Presentations
Whitepapers
Financial
Legal
Other
Search
Japan
Market Analysis
Investment
Mobile
Global
Game Publishing
Advertising
Monetization
Game Development
Console
Asia
Marketing
RPG
Player Behavior
Market Forecast
Mergers & Acquisitions
USA
South Korea
Clear
Filters
1
Japan
Recently added
Newest first
Oldest first
Title A–Z
Title Z–A
Report
1 pages
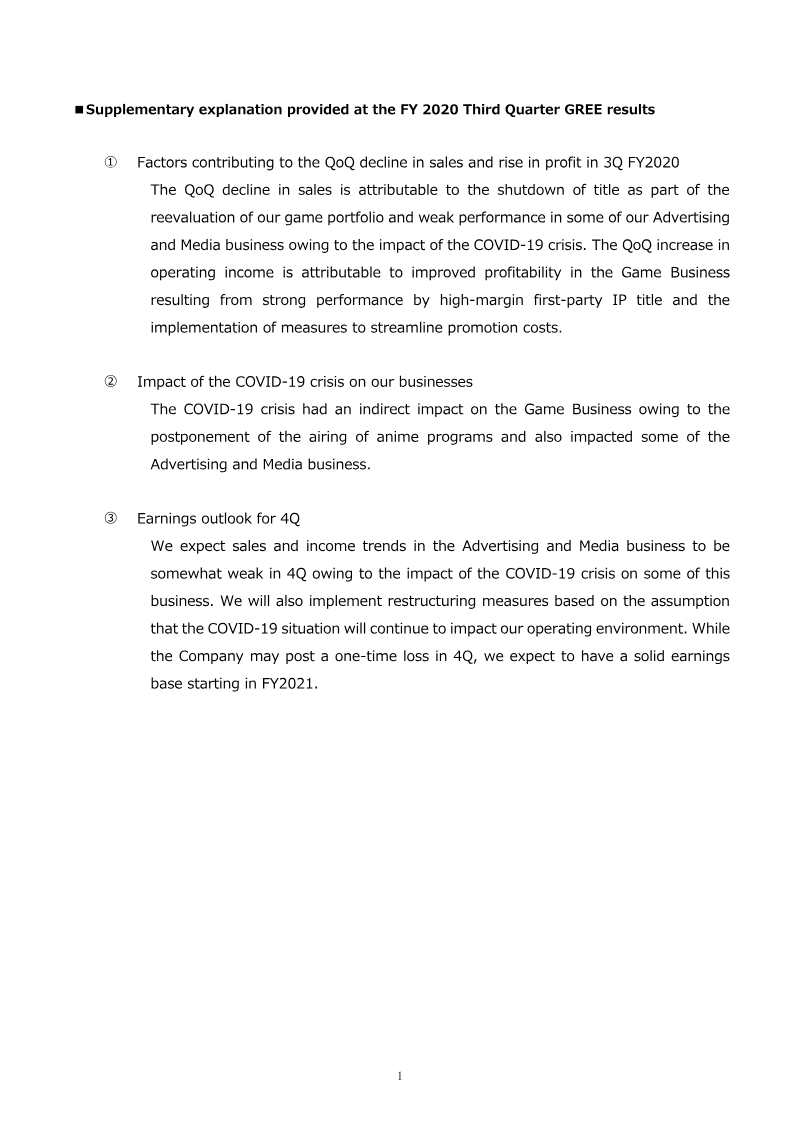
Supplementary Explanation: FY 2020 Third Quarter GREE Results
GREE reported a quarter-over-quarter sales decline in Q3 FY 2020, driven by a strategic shutdown of underperforming game titles and weak performance in the Advertising and Media segment.
Operating income increased during Q3 despite lower sales, primarily due to the strong performance of high-margin first-party IP titles and reduced promotional spending.
The COVID-19 pandemic negatively impacted the Advertising and Media business and caused indirect disruptions to the Game Business, including the postponement of anime broadcasts.
Market Analysis
Monetization
Marketing
+2
GREE
Report
1 pages
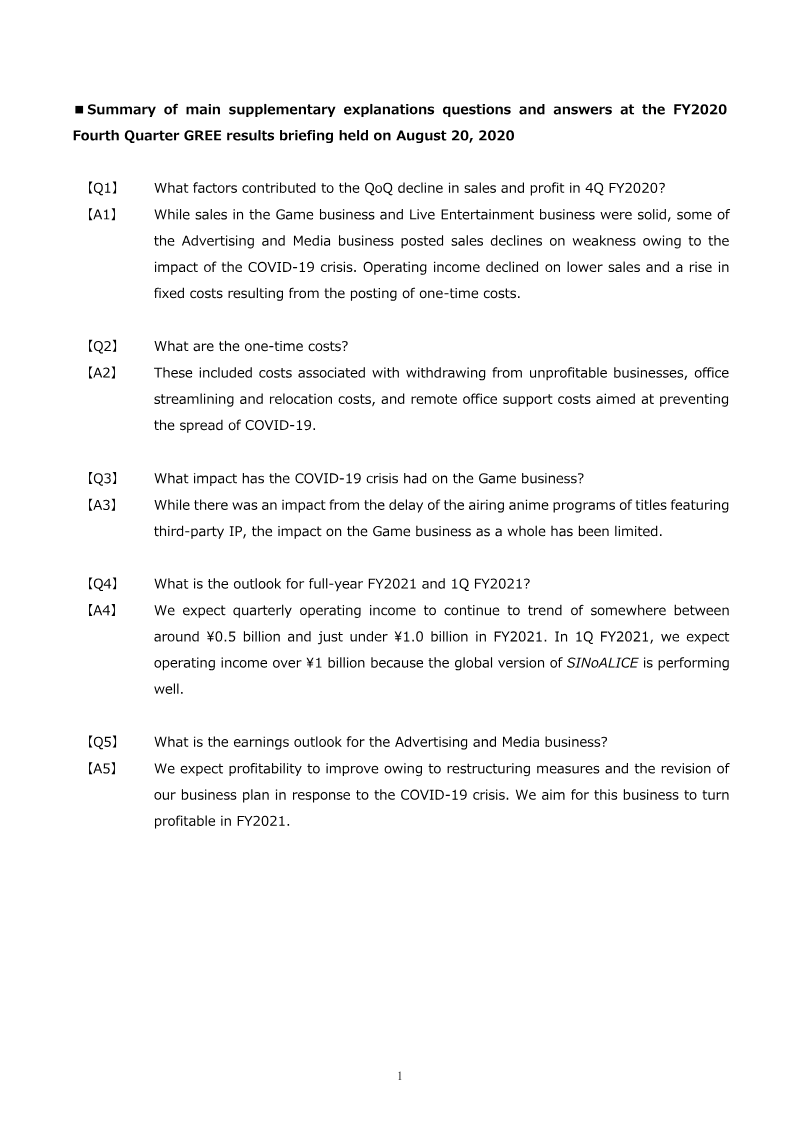
Summary of Main Supplementary Explanations Questions and Answers: FY2020 Fourth Quarter Results Briefing
The company projects fiscal 2021 quarterly operating income to range between ¥0.5 billion and just under ¥1.0 billion, with a Q1 forecast exceeding ¥1 billion.
The Q1 2021 earnings surge is driven by the successful global launch of the game title SINoALICE.
Fiscal 2020 Q4 operating income declined due to decreased sales and one-time costs, including unit divestitures, office consolidation, and remote-work support.
Market Analysis
Monetization
Mobile
+1
GREE
Report
2 pages
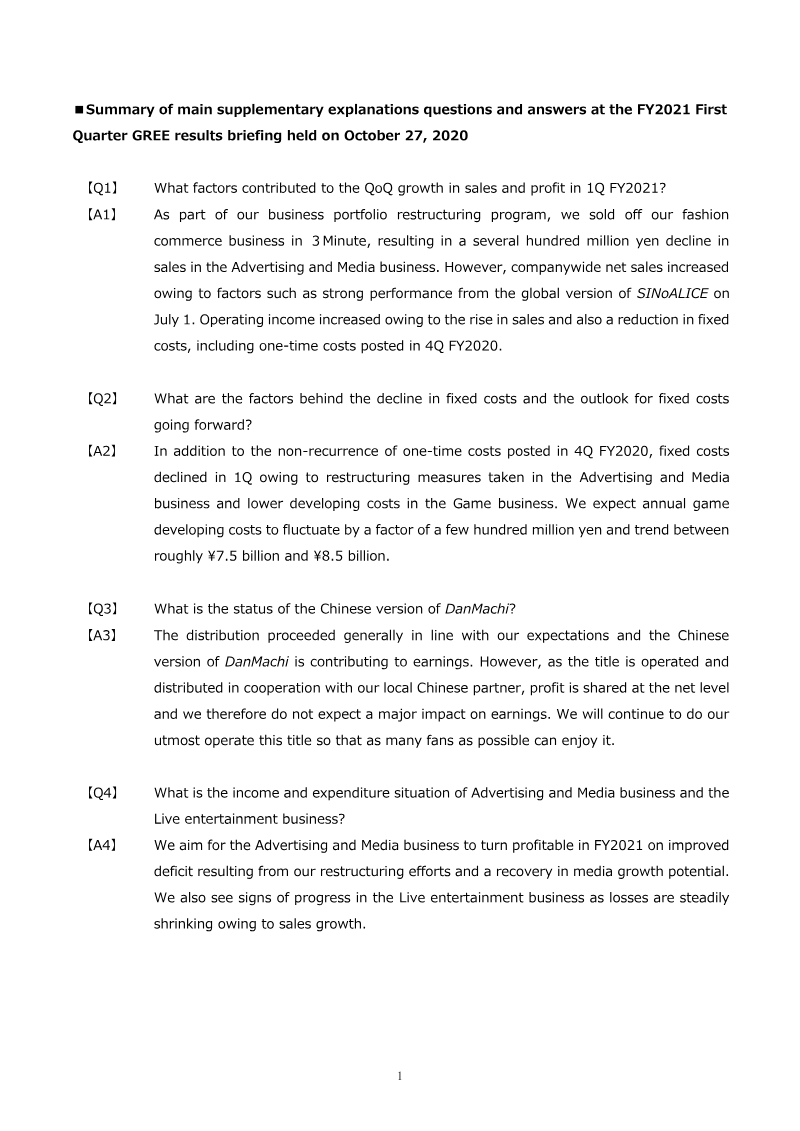
Summary of Main Supplementary Explanations Questions and Answers: FY2021 First Quarter GREE Results Briefing
GREE achieved Q1 FY2021 growth in sales and operating income driven by the July 1 global launch of SINoALICE and a reduction in fixed costs.
Operating income for Q2 FY2021 is projected to remain stable between ¥0.5 billion and just under ¥1.0 billion as SINoALICE momentum slows and development spending increases.
Annual game development expenses are forecasted to range between ¥7.5 billion and ¥8.5 billion, with total fixed costs expected to fluctuate by a few hundred million yen.
Market Analysis
Monetization
Mobile
+2
GREE
Report
1 pages
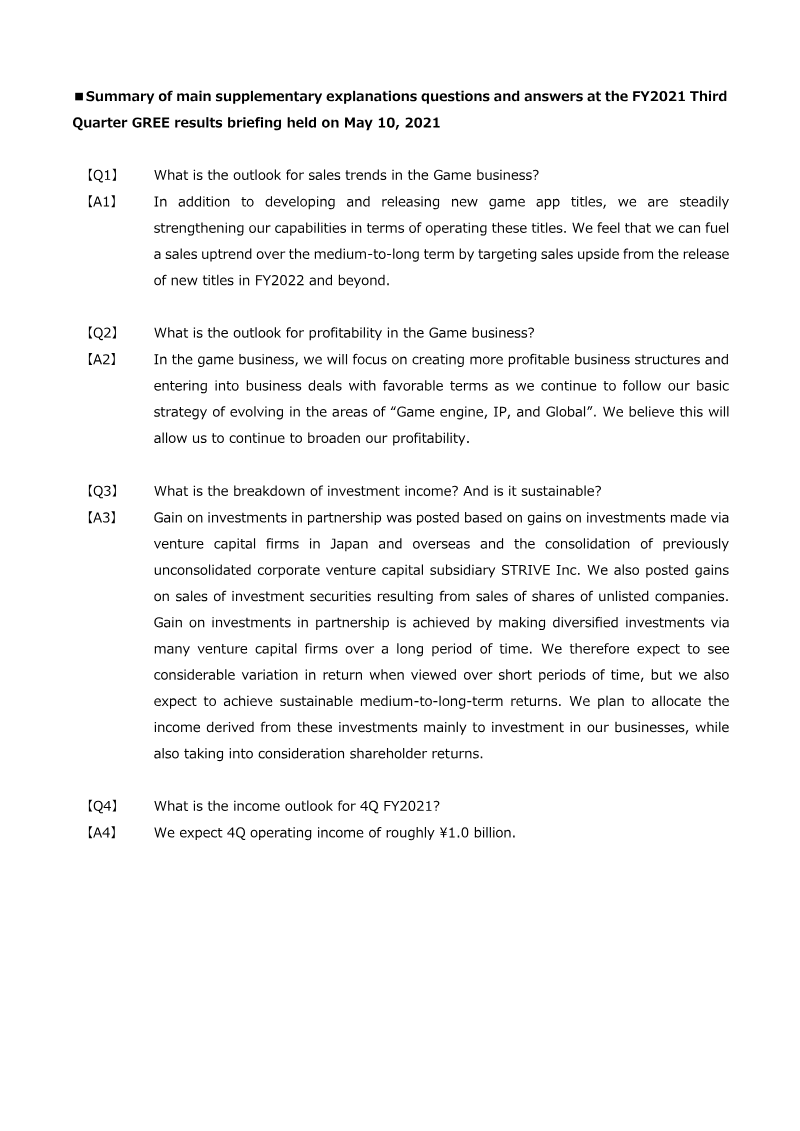
Summary of Main Supplementary Explanations Questions and Answers: FY2021 Third Quarter GREE Results Briefing
GREE projects operating income for the fourth quarter of FY2021 to reach approximately ¥1.0 billion.
The company anticipates a medium-to-long-term sales uptrend driven by a pipeline of new game titles scheduled for release in FY2022 and beyond.
Strategic growth initiatives focus on game engine development, intellectual property acquisition, and global market expansion.
Market Analysis
Game Development
Live Ops
+3
GREE
Report
1 pages
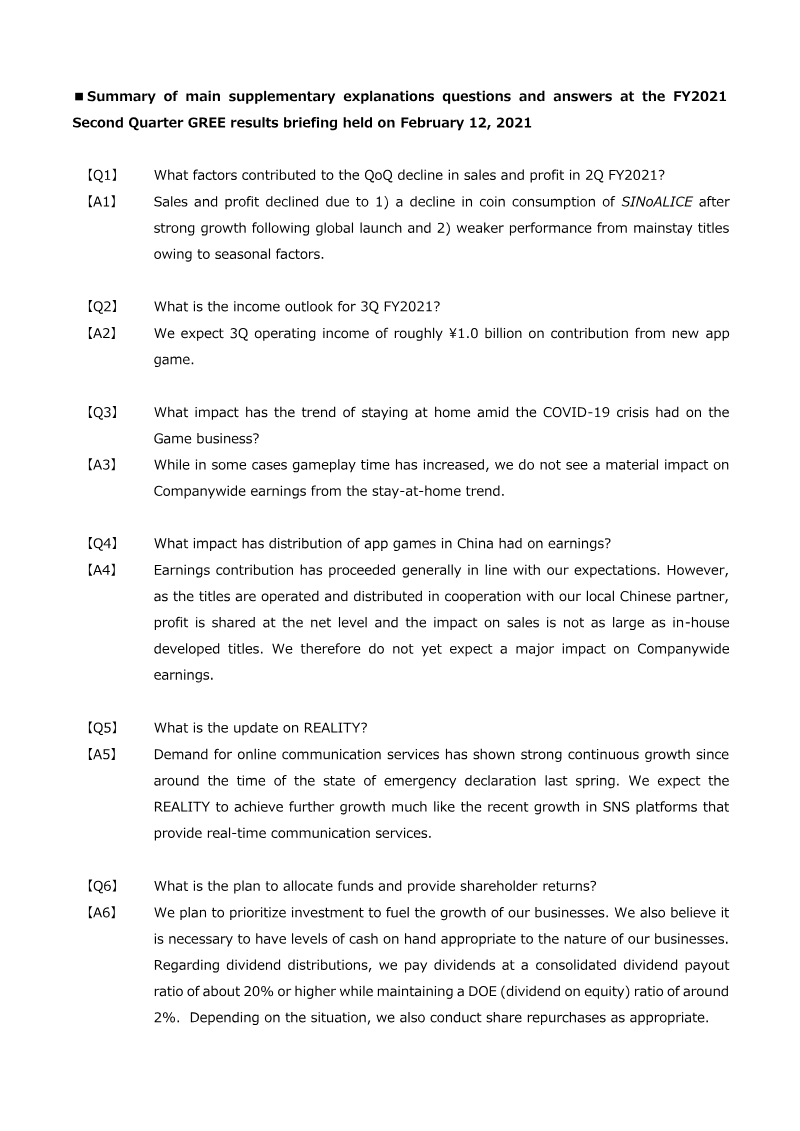
Summary of main supplementary explanations questions and answers at the FY2021 Second Quarter GREE results briefing held on February 12, 2021
GREE projects Q3 FY2021 operating income at approximately ¥1.0 billion, primarily supported by the launch of a new app game.
The quarter-over-quarter decline in FY2021 Q2 sales and operating income was driven by a slowdown in SINoALICE coin consumption and seasonal weakness in flagship titles.
The REALITY brand for real-time communication services has seen sustained growth since the spring 2020 state of emergency, with management expecting continued expansion.
Market Analysis
Monetization
Mobile
+1
GREE
Report
2 pages
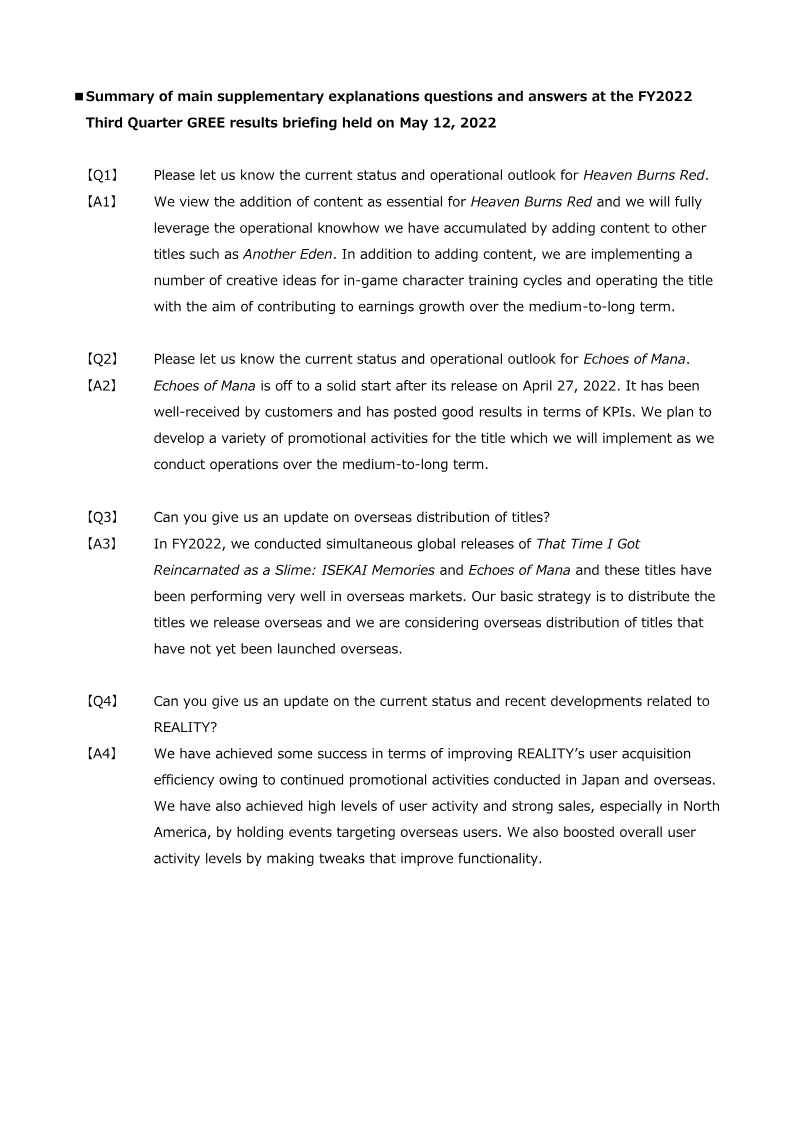
Summary of Main Supplementary Explanations Questions and Answers: FY2022 Third Quarter GREE Results Briefing
GREE projects Q4 operating income for its Internet and Entertainment Business to reach between ¥2.5 billion and just under ¥3.0 billion, driven by the performance of new titles.
The company reported a cumulative loss for Q3 FY2022, primarily due to volatility and a year-over-year decline in the Investment and Incubation Business.
Heaven Burns Red is being managed as a long-term growth engine, with the company applying operational experience from Another Eden to implement new content and training cycles.
Market Analysis
Live Ops
Mobile
+2
GREE
Report
3 pages
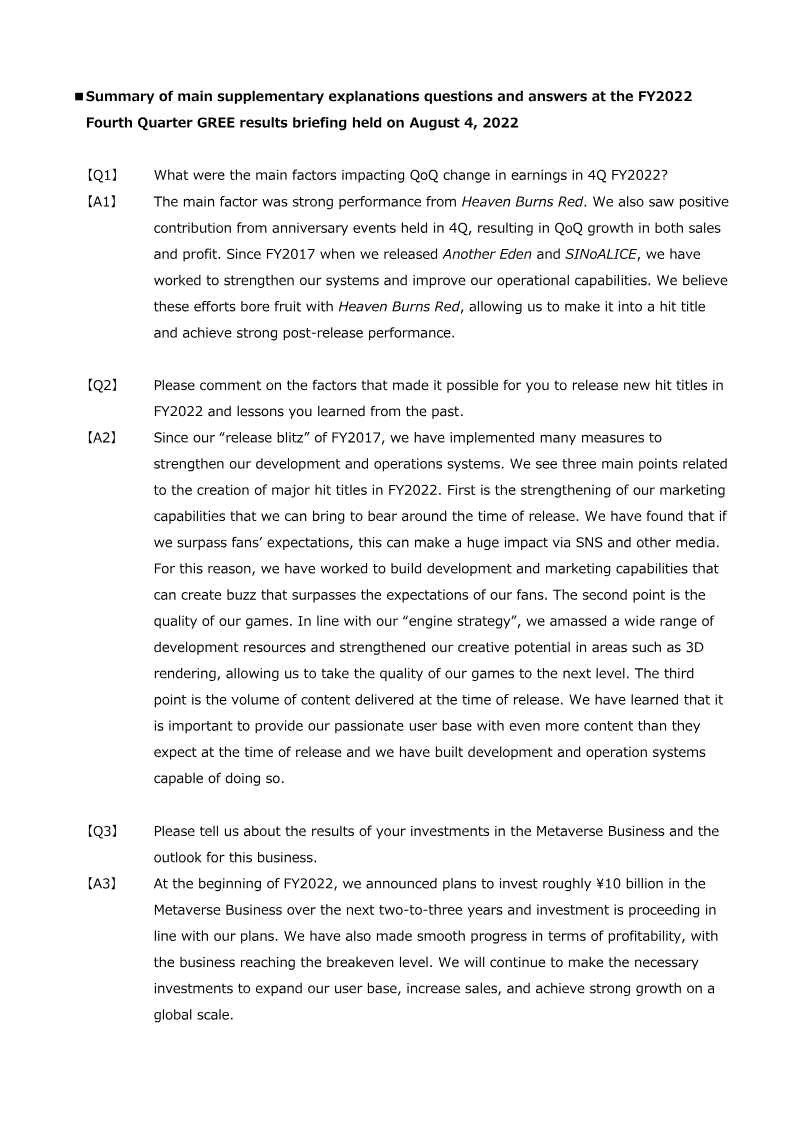
Summary of main supplementary explanations questions and answers at the FY2022 Fourth Quarter GREE results briefing held on August 4, 2022
GREE’s FY2022 Q4 earnings growth was driven by the successful launch of *Heaven Burns Red* and high-performing anniversary events, validating a 'release blitz' strategy focused on high-quality 3D rendering and marketing.
The company has allocated ¥10 billion over two to three years to its Metaverse business, which has currently reached a breakeven point as it seeks to expand its global user base.
Operating income for the Internet and Entertainment segment is projected to decline to ¥1.0–¥1.5 billion in FY2023 Q1, reflecting a normalization after the peak performance of new titles in FY2022 and ongoing system investments.
Market Analysis
Mobile
JRPG
+2
GREE
Report
2 pages
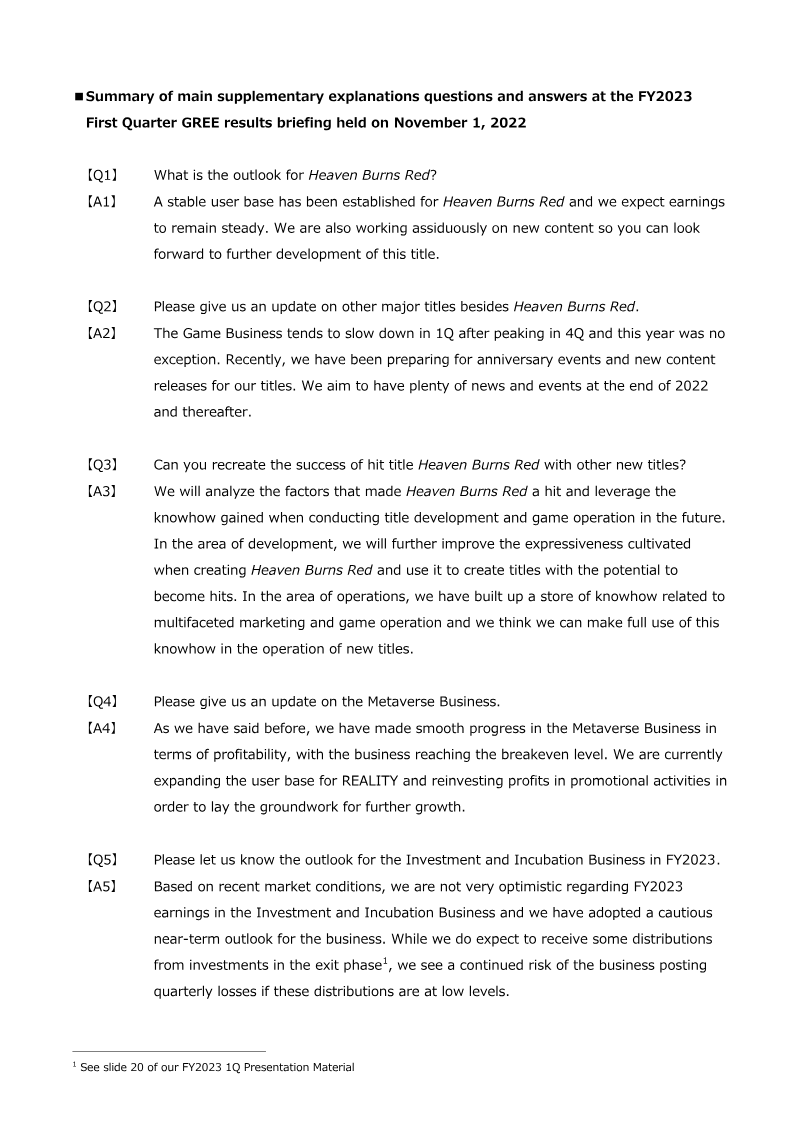
Summary of Main Supplementary Explanations Questions and Answers: FY2023 First Quarter GREE Results Briefing
GREE projects operating income for the Internet and Entertainment Business to reach between ¥1.0 billion and ¥1.5 billion in Q2 FY2023.
The flagship title 'Heaven Burns Red' maintains a stable user base, with the company leveraging its development and marketing lessons from this game to inform future title releases.
The metaverse segment, anchored by the platform REALITY, has reached a breakeven point and is currently reinvesting profits into promotional activities to scale its user base.
Market Analysis
Live Ops
Mobile
+2
GREE
Report
2 pages
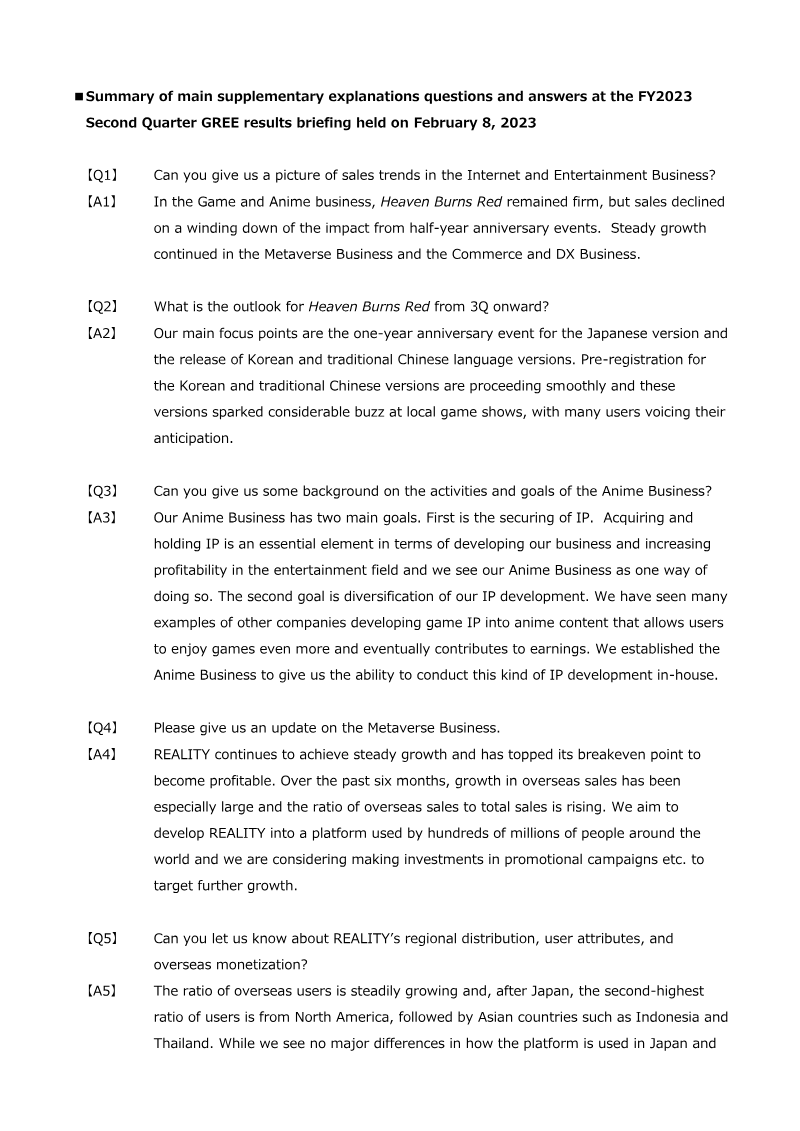
Summary of Main Supplementary Explanations Questions and Answers: FY2023 Second Quarter
GREE projects Q3 FY2023 operating income for its Internet and Entertainment Business to range between ¥1.0 billion and ¥1.5 billion, heavily dependent on the performance of new Korean and traditional Chinese releases of 'Heaven Burns Red'.
The 'REALITY' metaverse platform has achieved profitability, with significant overseas growth led by North America, followed by Indonesia and Thailand.
GREE is scaling marketing spend in Q3 to support the one-year anniversary of 'Heaven Burns Red' and the international expansion of the 'REALITY' platform.
Market Analysis
Metaverse
Mobile
+4
GREE
Report
2 pages
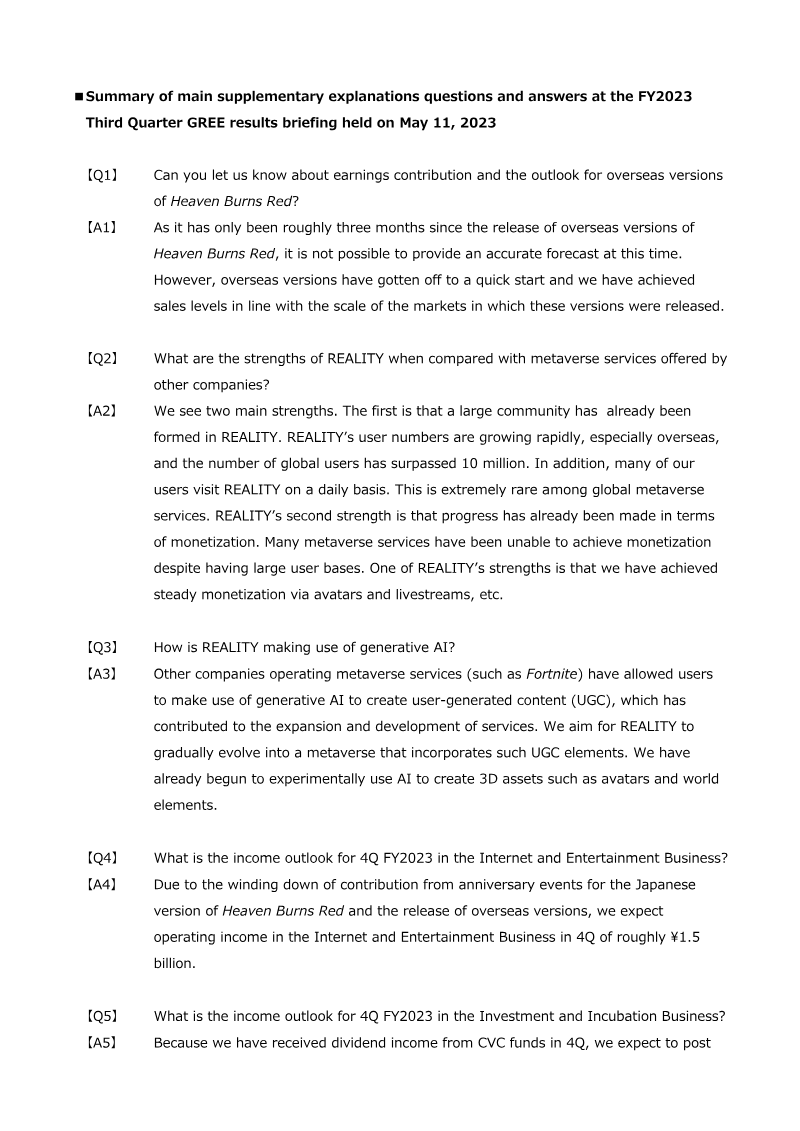
FY2023 Third Quarter GREE Results Briefing: Summary of Supplementary Explanations
GREE’s metaverse platform, REALITY, has surpassed 10 million global users and maintains high daily engagement rates through avatar sales and livestreaming.
The Internet and Entertainment segment projects Q4 operating income of approximately ¥1.5 billion, balancing the decline of domestic anniversary event revenue with new overseas expansion.
GREE is integrating generative AI into the REALITY platform to facilitate user-generated 3D content, including avatars and world elements.
Market Analysis
Monetization
Metaverse
+3
GREE
Report
2 pages
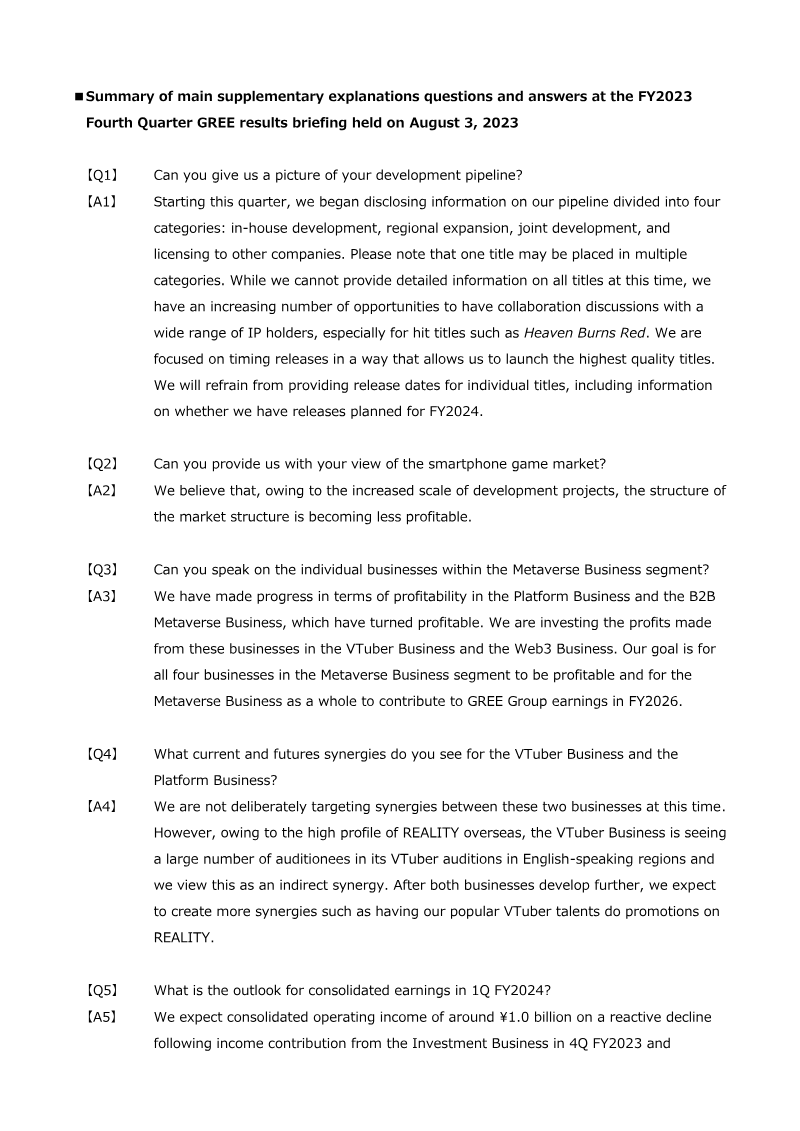
Summary of Main Supplementary Explanations Questions and Answers: FY2023 Fourth Quarter
GREE is pivoting away from the declining profitability of the smartphone game market toward a diversified portfolio, aiming for half of non-investment earnings to come from non-game, non-anime sources by FY2026.
The company projects a consolidated operating income of ¥4.0–5.0 billion for FY2024, excluding contributions from new game releases, anime, or investment income.
Within the Metaverse Business segment, the Platform and B2B sub-segments are currently profitable, with a group-wide goal for all four sub-segments to reach profitability by FY2026.
Game Development
Game Publishing
Market Analysis
+1
GREE
Report
1 pages
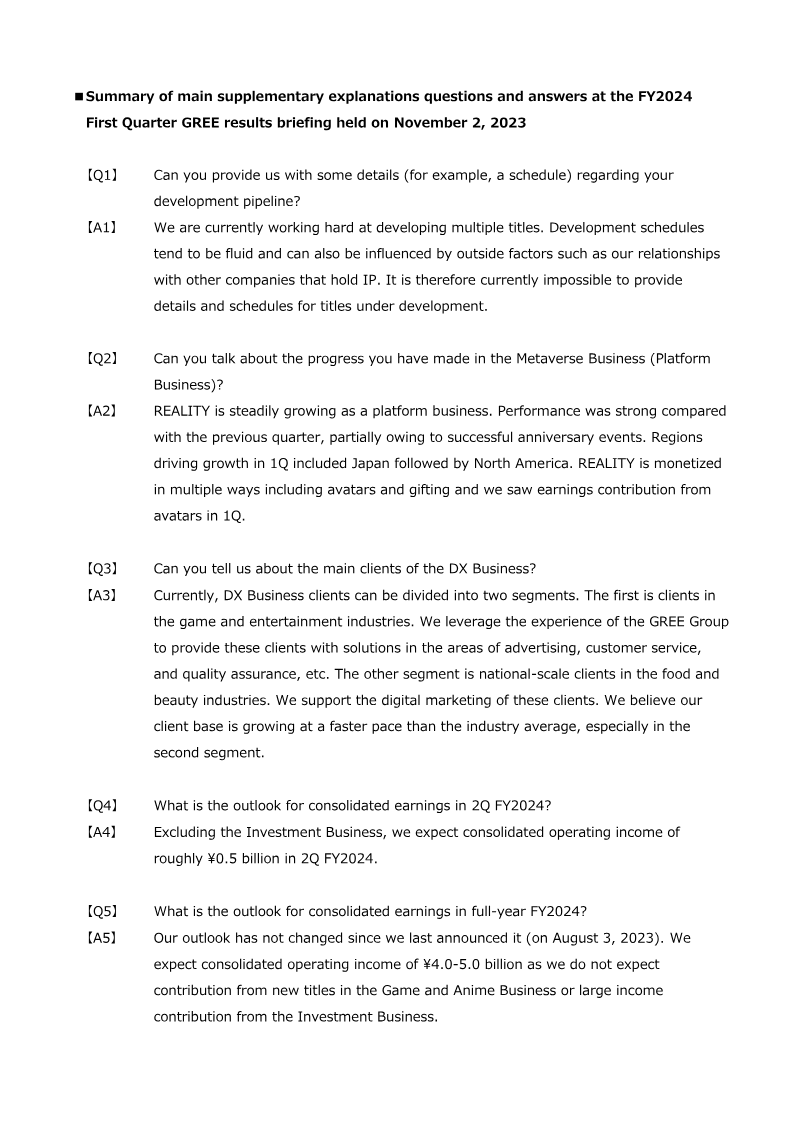
Summary of Main Supplementary Explanations Questions and Answers: FY2024 First Quarter GREE Results Briefing
GREE maintains its FY2024 consolidated operating income guidance of ¥4.0 billion to ¥5.0 billion, as originally announced on August 3, 2023.
The company projects consolidated operating income for the second quarter at approximately ¥0.5 billion, excluding the impact of investment activities.
The REALITY metaverse platform achieved robust growth in Q1, driven by strong performance in the Japanese and North American markets through avatar and gifting monetization.
Market Analysis
Game Development
Metaverse
+2
GREE
Report
2 pages
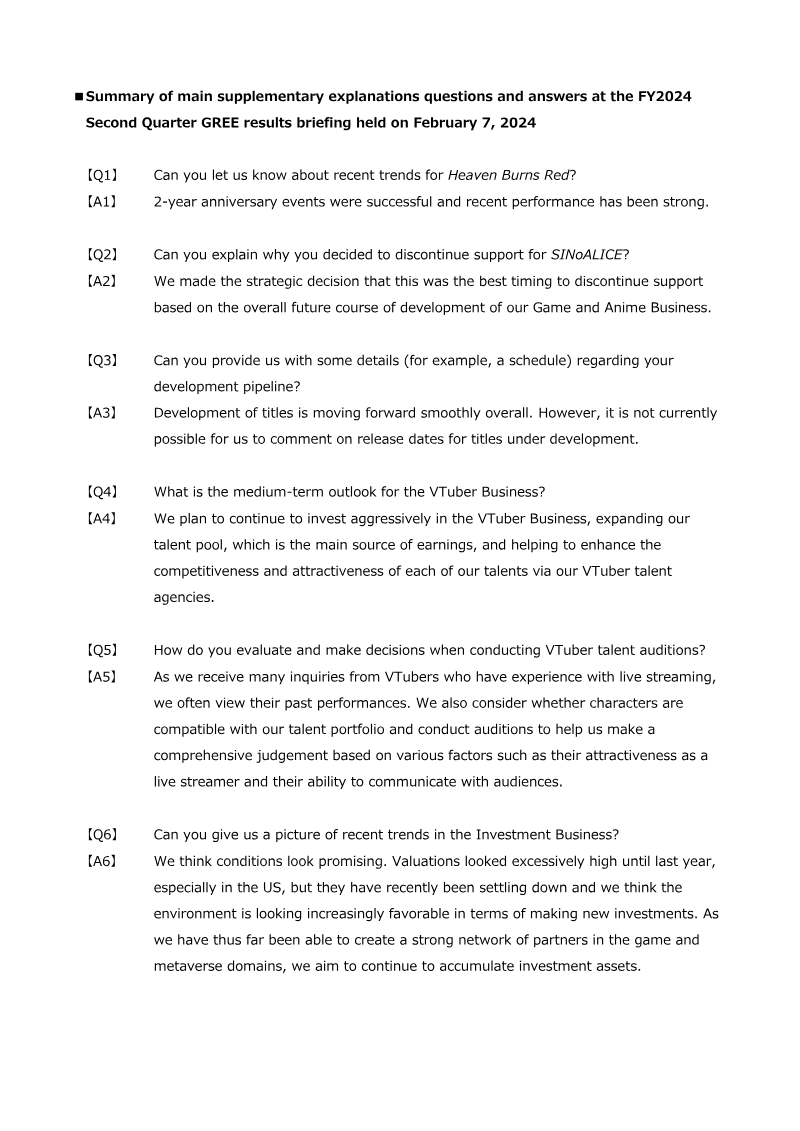
Summary of Main Supplementary Explanations Questions and Answers: FY2024 Second Quarter
GREE forecasts consolidated operating income of approximately ¥1.5 billion for Q3 and ¥5.0 billion for the full fiscal year FY2024, excluding the Investment Business.
The company is shifting its Game and Anime Business strategy by discontinuing support for SINoALICE to prioritize more promising development projects.
Heaven Burns Red remains a core performance driver, with its two-year anniversary events contributing to strong financial results.
Market Analysis
Game Development
Mobile
+3
GREE
Report
1 pages
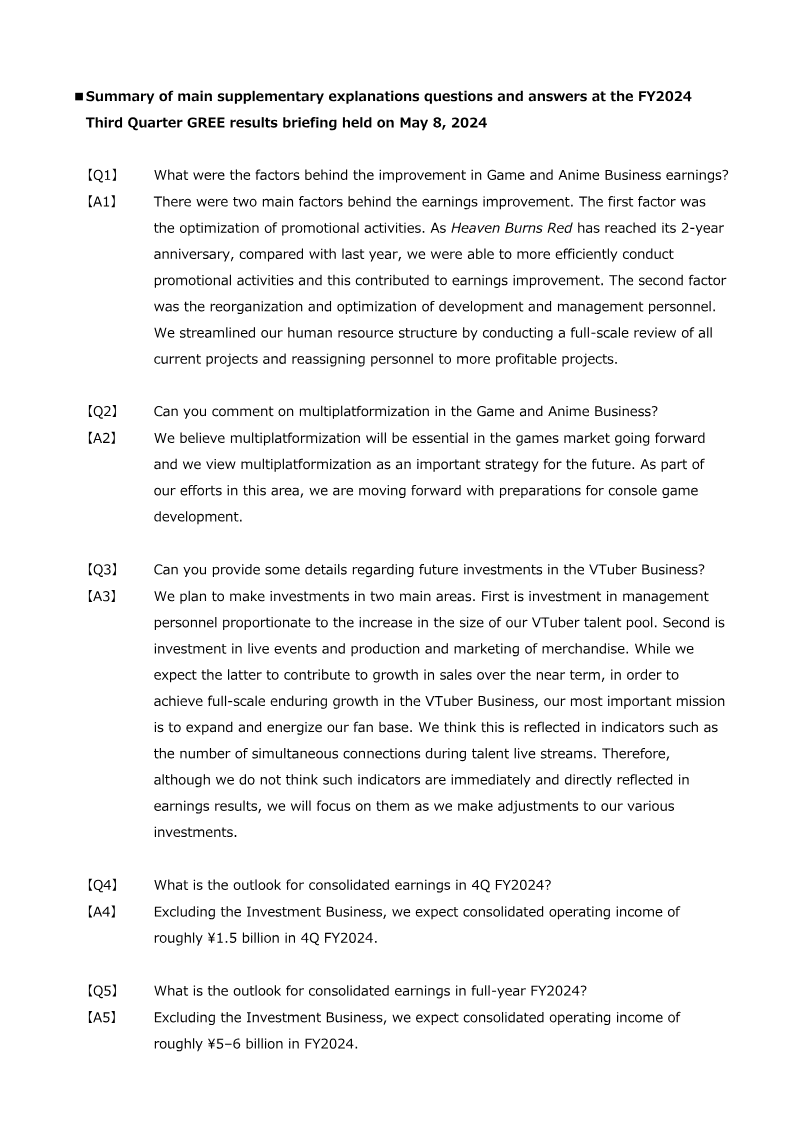
Summary of Main Supplementary Explanations Questions and Answers: FY2024 Third Quarter Results Briefing
GREE projects a full-year FY2024 consolidated operating income between ¥5 billion and ¥6 billion.
The company forecasts a consolidated operating income of approximately ¥1.5 billion for the fourth quarter of FY2024.
Earnings growth in the Game and Anime Business was driven by optimized promotional spending for 'Heaven Burns Red' and the reallocation of staff to higher-margin projects.
Market Analysis
Game Development
Monetization
+2
GREE
Report
1 pages
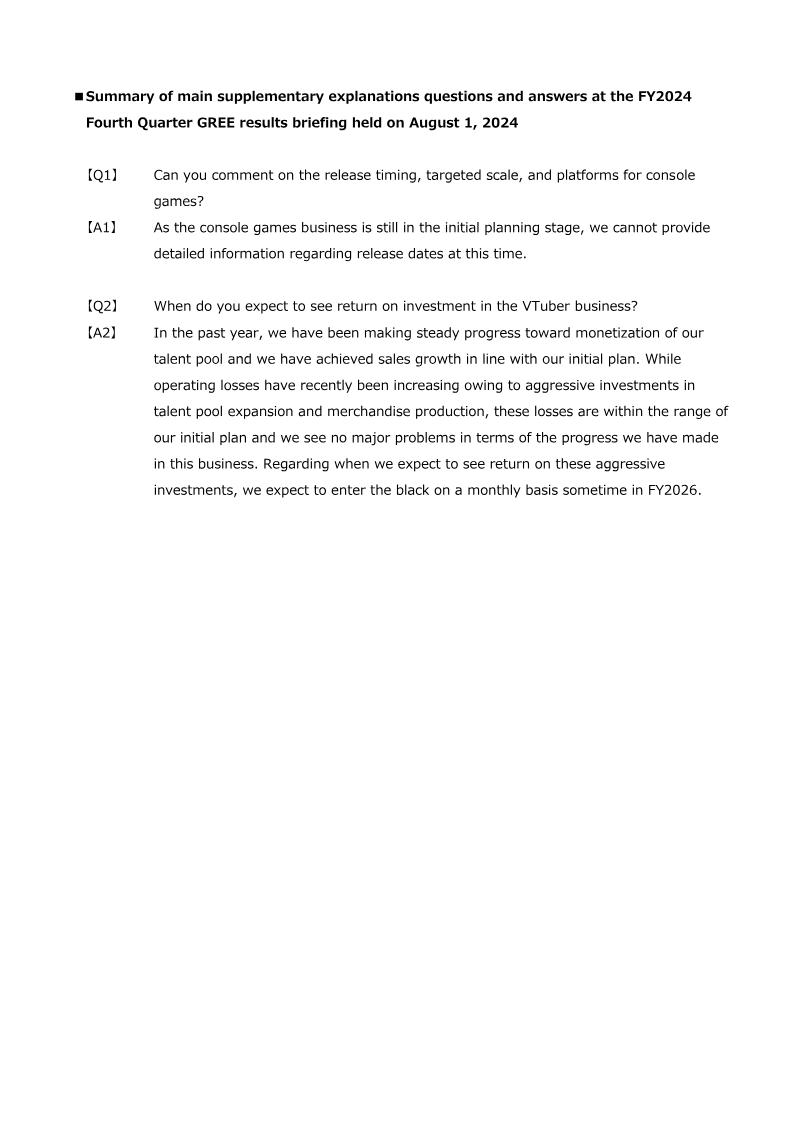
Summary of Main Supplementary Explanations Questions and Answers: FY2024 Fourth Quarter GREE Results Briefing
GREE targets a break-even point for its VTuber business by the middle of FY2026, with monthly operating losses expected to be eliminated by that time.
The VTuber segment is currently experiencing rising operating losses due to aggressive investments in talent acquisition and merchandise production, though these costs remain within the company's planned budget.
GREE’s console game development remains in the early planning stages, with no confirmed release dates, platforms, or resource commitments disclosed.
Market Analysis
Monetization
Investment
+2
GREE
Report
1 pages
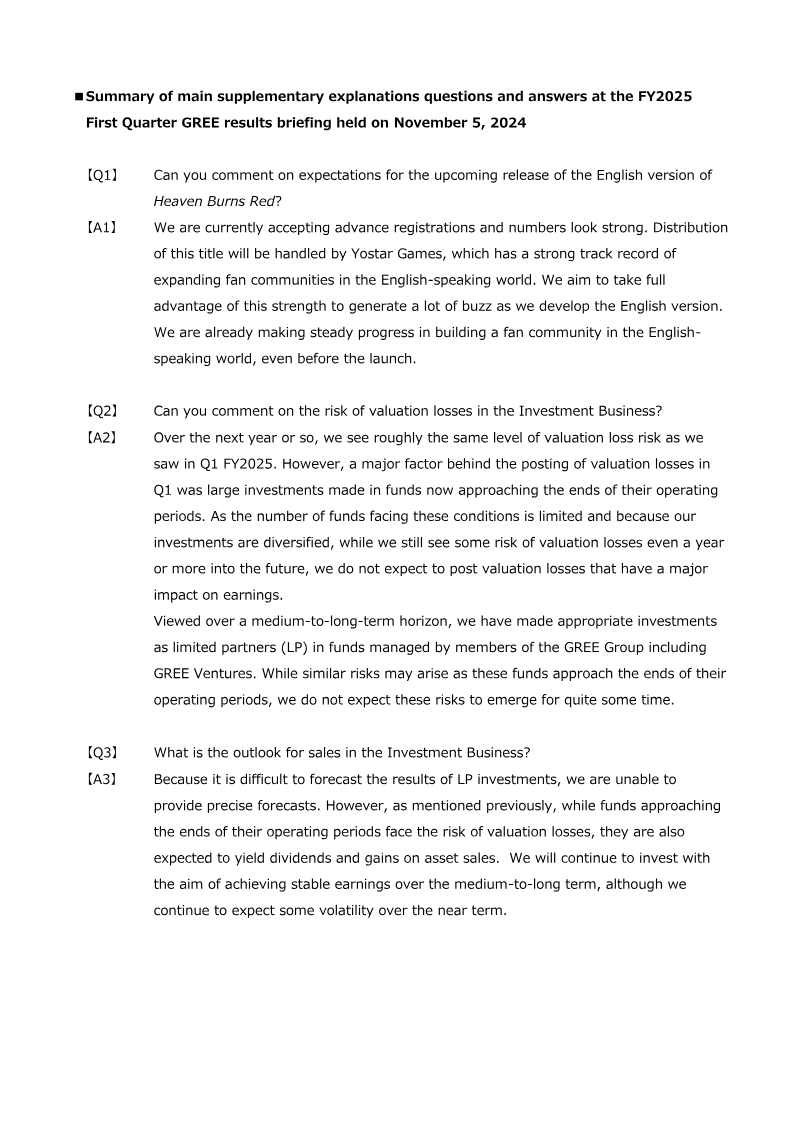
Summary of main supplementary explanations questions and answers at the FY2025 First Quarter GREE results briefing held on November 5, 2024
GREE is launching the English version of 'Heaven Burns Red' in partnership with Yostar Games, leveraging the publisher's expertise in growing English-speaking fan communities.
The company is prioritizing proactive community building and marketing efforts ahead of the 'Heaven Burns Red' English launch to drive engagement.
Management expects valuation-loss risks in the investment segment to remain consistent with Q1 FY2025 levels in the near term.
Market Analysis
Game Publishing
Investment
+3
GREE
Report
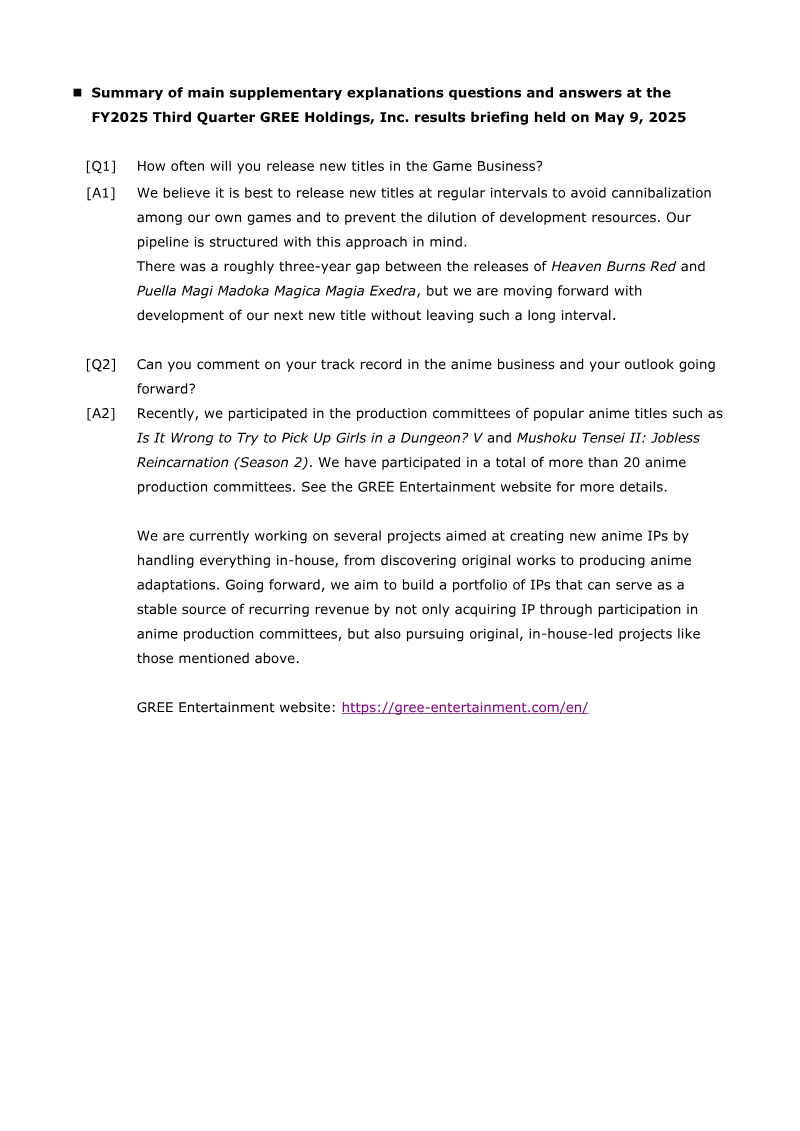
1 pages
Summary of Main Supplementary Explanations Questions and Answers: FY2025 Third Quarter Results Briefing
GREE is accelerating its game development pipeline to reduce the three-year release gap previously observed between major titles like Heaven Burns Red and Puella Magi Madoka Magica: Magia Exedra.
The company is shifting toward a more frequent, disciplined game release cadence to optimize development resources and prevent internal product cannibalization.
GREE has expanded its anime business by joining more than 20 production committees, including high-profile series such as Is It Wrong to Try to Pick Up Girls in a Dungeon? V and Mushoku Tensei II: Jobless Reincarnation (Season 2).
Market Analysis
Game Development
Mobile
+1
GREE
Report
2 pages
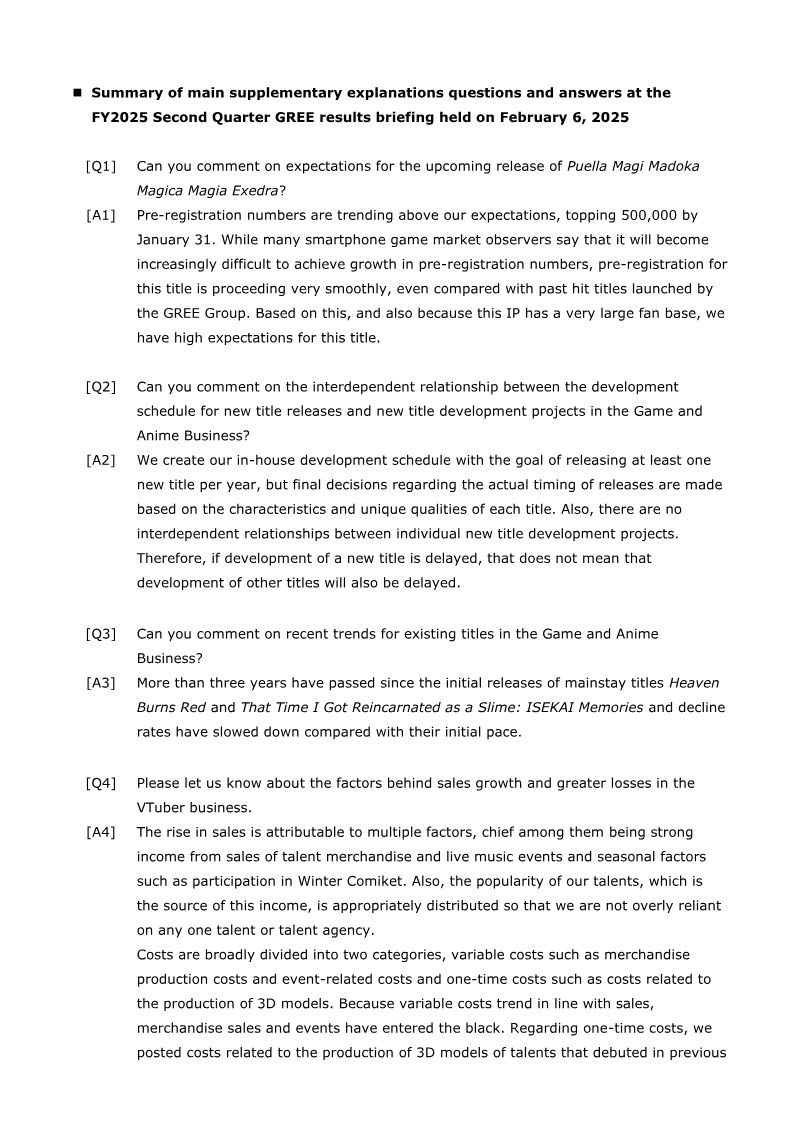
Summary of Main Supplementary Explanations Questions and Answers: FY2025 Second Quarter GREE Results Briefing
GREE targets monthly profitability for its VTuber segment in FY2026, with annual sales projected to reach approximately ¥3.0 billion.
Pre-registration for the upcoming title 'Puella Magi Madoka Magica Magia Exedra' exceeded 500,000 by January 31, signaling strong market interest.
Flagship games 'Heaven Burns Red' and 'That Time I Got Reincarnated as a Slime: ISEKAI Memories' have stabilized, showing a deceleration in decline rates after three years of operation.
Market Analysis
Game Publishing
User Acquisition
+2
GREE
Report
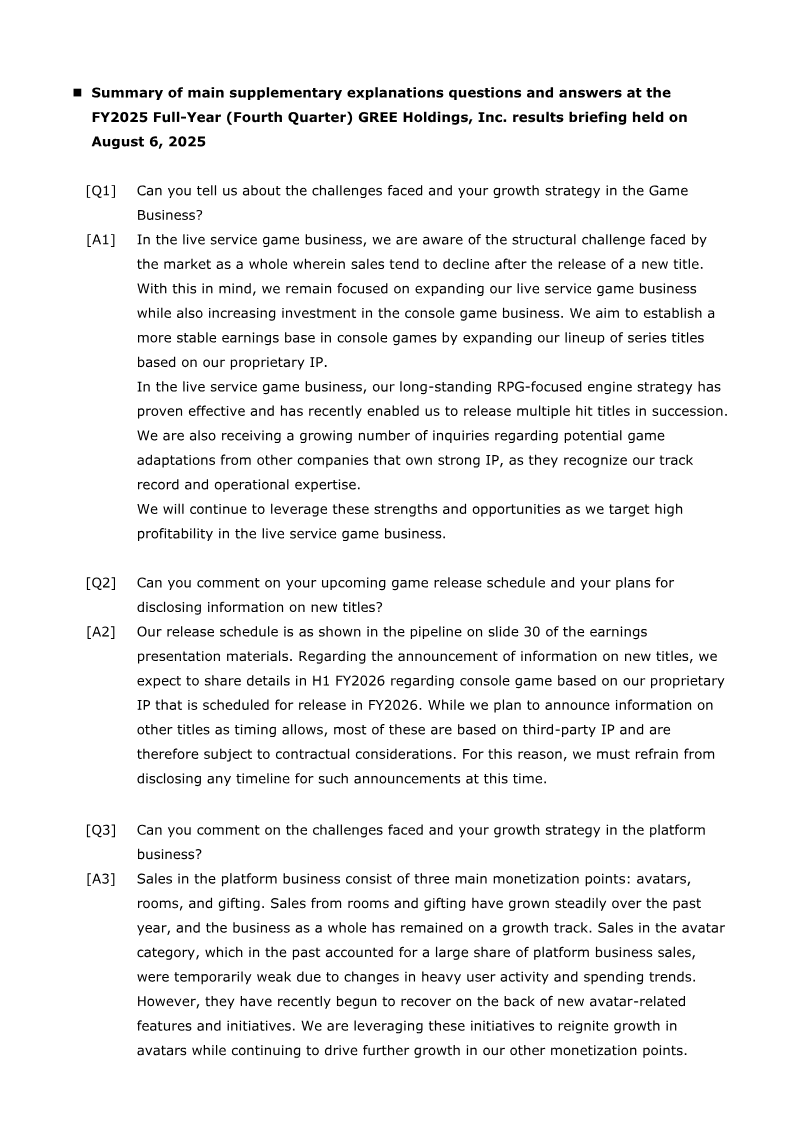
3 pages
Summary of Main Supplementary Explanations Questions and Answers: FY2025 Full-Year Results
GREE is shifting its game division strategy to balance post-launch live-service volatility by investing in console titles built on proprietary IP.
The VTuber business has doubled sales per talent since FY2024, supported by a roster of approximately 90 talents and expanded merchandise and advertising channels.
The DX business is transitioning from a one-time project sales model to a recurring revenue structure, with modest growth expected through FY2026.
Market Analysis
Live Ops
Investment
+4
GREE
Report
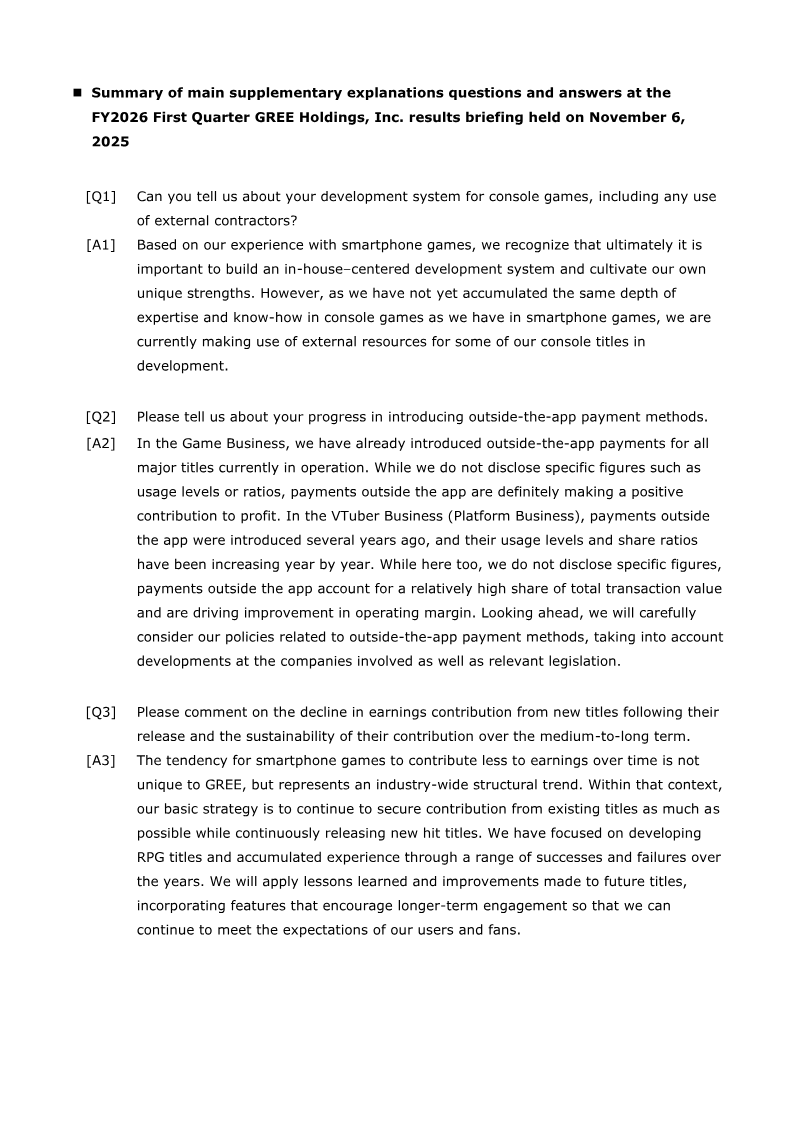
3 pages
Summary of main supplementary explanations questions and answers at the FY2026 First Quarter GREE Holdings, Inc. results briefing held on November 6, 2025
GREE is transitioning to an in-house development model for console titles, utilizing external contractors to address current expertise gaps while focusing on long-term IP cultivation.
Outside-app payment methods have been fully implemented across all major mobile titles and the VTuber platform, directly contributing to improved operating margins.
The VTuber production arm is projected to reach full-year profitability by FY2027 as high-margin merchandise and live events offset initial talent acquisition costs.
Market Analysis
Game Development
Monetization
+3
GREE
Previous
1
…
6
7
8
…
12
Next