ReportAkatsuki
Consolidated Financial Statements for the Third Quarter of Fiscal Year Ending March 31, 2026
11 pages~24 min full read
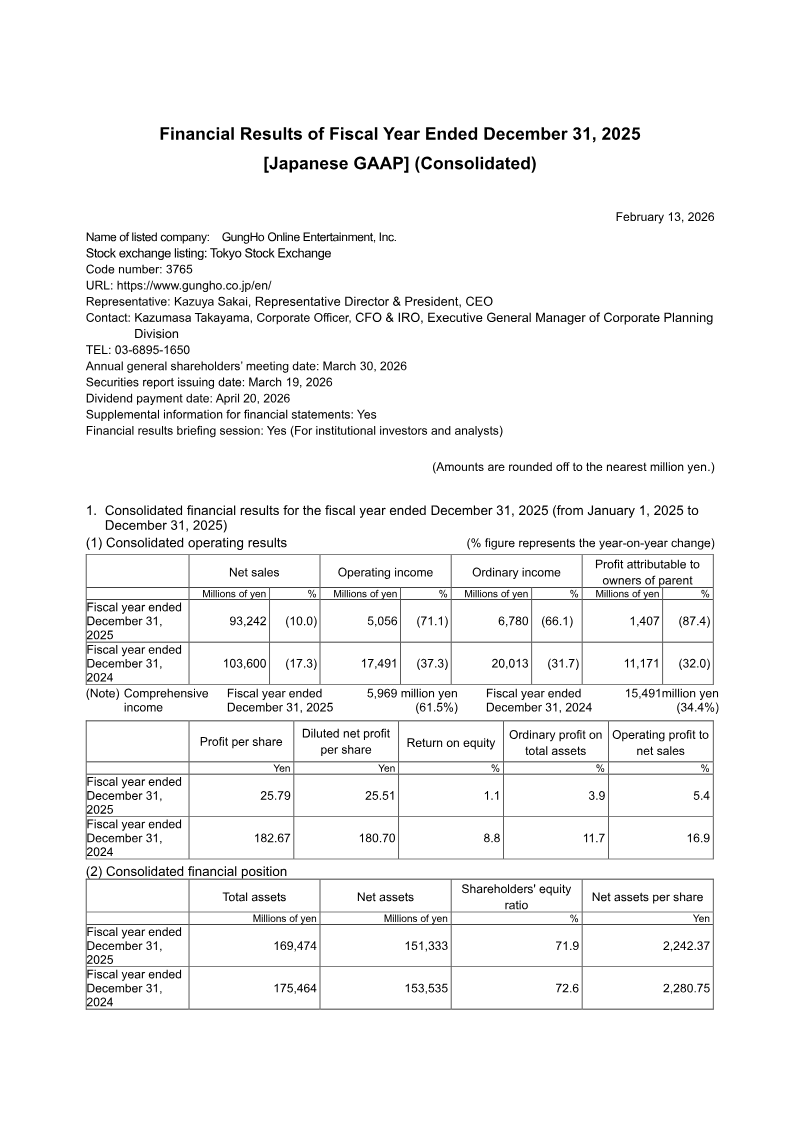
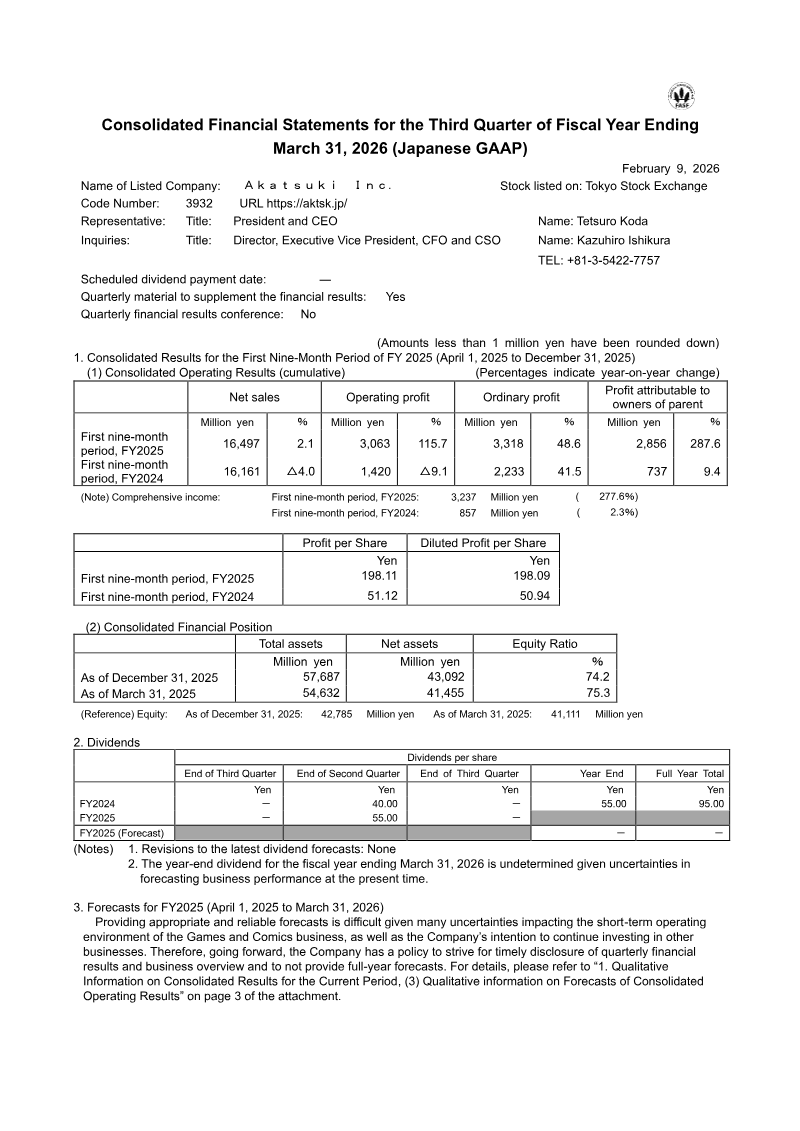
Akatsuki Inc. reported a significant surge in profitability for the first nine months of FY2025, with operating profit rising 115.7% to ¥3,063 million and net profit attributable to parent shareholders climbing 287.6% to ¥2,856 million.
See it on page 1Net sales grew modestly by 2.1% to ¥16,497 million, while diluted earnings per share increased substantially to ¥198.11 compared to ¥51.12 in the prior year.
See it on page 7The core Games and Comics business experienced a 5.3% decline in sales but successfully doubled its operating profit through effective cost-reduction measures.
See it on page 4The Entertainment and Lifestyle segment achieved strong growth with a 76.1% sales increase to ¥1,400 million, though this was accompanied by a modest decline in profit.
See it on page 4The company launched a new AI/DX Solutions segment, which generated ¥600 million in sales but incurred an operating loss of ¥112 million.
See it on page 10The company maintains a strong balance sheet with an equity ratio of 74.2%, total assets of ¥57,687 million, and cash and deposits totaling ¥28,377 million.
See it on page 6Management has withheld FY2026 forecasts and maintains a policy of not providing full-year guidance due to ongoing market uncertainties.
See it on page 5Akatsuki Inc. reports consolidated financial results for the first nine months of fiscal year 2025, ending December 31 2025. Net sales rose modestly by 2.1 % to ¥16,497 million, while operating profit surged 115.7 % to ¥3,063 million and ordinary profit increased 48.6 % to ¥3,318 million. Net profit attributable to parent shareholders climbed 287.6 % to ¥2,856 million, yielding diluted earnings per share of ¥198.11 versus ¥51.12 in the prior year. Total assets reached ¥57,687 million, up ¥3,054 million from March 31 2025, with net assets at ¥43,092 million and an equity ratio of 74.2 %. The company’s liquidity remained solid, with cash and deposits at ¥28,377 million and current liabilities down to ¥4,462 million.
Segment performance varied: the Games and Comics business posted a 5.3 % decline in sales but doubled operating profit through cost reductions; Entertainment and Lifestyle achieved a 76.1 % sales increase to ¥1,400 million but saw a modest profit decline; the newly reported AI/DX Solutions segment generated ¥600 million in sales and incurred a ¥112 million loss. The Others segment recorded a sharp 83.1 % sales drop and a ¥51 million loss.
The company added five subsidiaries to its consolidation scope, including CRAYON Inc. and PAPABUBBLE, while excluding Akatsuki Fukuoka after liquidation. No changes to accounting policies were noted. Forecasts for FY 2026 are withheld due to market uncertainties, and the company maintains a policy of not providing full‑year guidance.