Financial Reports·Updated Apr 8, 2026 by GDEU
What can I help with?
AI-powered answers with citations from the library.
What can I help with?
AI-powered answers with citations from the library.
Financial · January 1, 2024
Published by GDEU
The presentation reports the company’s financial performance for 2024, focusing on revenue growth, cost structure, and profitability metrics. Revenue increased from $420 million in 2023 to $480 million in 2024, driven by higher bookings and a broader user base across mobile and PC platforms. Platform commissions rose from $91 million to $130 million, while game operation costs grew modestly. Selling and marketing expenses fell from $209 million to $153 million, reflecting a shift toward more efficient customer acquisition. Net income before tax surged from $30 million to $50 million, and adjusted EBITDA rose from $42 million to $49 million after excluding non‑core items such as goodwill impairments, share‑based payments, and fair‑value adjustments. Key operating metrics show monthly paying users at 359 k in Q4 2023, rising to 381 k by Q4 2024, with average bookings per paying user declining slightly from $294 to $278. Bookings grew from $106 million to $109 million, while average bookings per user fell by 3 %. Geographic diversification is evident, with Asia contributing 15 % of bookings and the US 13 %. The company’s balance sheet reflects a reduction in total assets from $321 million to $272 million, largely due to lower deferred revenue and a decline in trade receivables. Cash and cash equivalents rose from $72 million to $111 million, supported by strong operating cash flow of $28.5 million in 2024. The methodology relies on unaudited IFRS‑compliant financial statements and a non‑IFRS Adjusted EBITDA measure that excludes items deemed non‑representative of core operations. The report covers the full 2024 fiscal year, with quarterly comparisons to 2023, and provides reconciliations between net income and Adjusted EBITDA.
Disclaimer Forward-looking statements Certain statements in this presentation may constitute “forward-looking statements” for purposes of U.S. federal securities laws. Such statements are based on current expectations that are subject to risks and uncertainties. In addition, any statements that refer to projections, forecasts or other characterizations of future events or circumstances, including any underlying assumptions, are forward-looking statements. The forward-looking statements contained in this presentation are based on the Company’s current expectations and beliefs concerning future developments and their potential effects on the Company. There can be no assurance that future developments affecting the Company will be those that the Company has anticipated. Forward-looking statements involve a number of risks, uncertainties (some of which are beyond the Company’s control) or other assumptions. You should carefully consider the risks and uncertainties described in the “Risk Factors” section of the Company’s 2024 Annual Report in Form 20-F, filed by the Company on March 31, 2025, and other documents filed by the Company from time to time with the Securities and Exchange Commission. Should one or more of these risks or uncertainties materialize, or should any of the Company’s assumptions prove incorrect, actual results may vary in material respects from those projected in these forward-looking statements. Forward-looking statements speak only as of the date they are made.
ion. Should one or more of these risks or uncertainties materialize, or should any of the Company’s assumptions prove incorrect, actual results may vary in material respects from those projected in these forward-looking statements. Forward-looking statements speak only as of the date they are made. Readers are cautioned not to put undue reliance on forward-looking statements, and the Company undertakes no obligation to update or revise any forward-looking statements, whether as a result of new information, future events or otherwise, except as may be required under applicable securities laws. Presentation of Non-IFRS Financial Measures In addition to the results provided in accordance with IFRS throughout this presentation, the Company has provided the non-IFRS financial measure “Adjusted EBITDA” (the “Non-IFRS Financial Measure”). The Company defines Adjusted EBITDA as the profit/loss for the period, net of tax as presented in the Company's financial statements in accordance with IFRS, adjusted to exclude (i) goodwill and investments in equity accounted associates' impairment, (ii) loss on disposal of subsidiaries, (iii) income tax expense, (iv) other financial income, finance income and expenses other than foreign exchange gains and losses and bank charges, (v) change in fair value of share warrant obligations and other financial instruments, (vi) share of loss of equity-accounted associates, (vii) depreciation and amortization, (viii) share-based payments expense and (ix) certain non-cash or other special items that we do not consider indicative of our ongoing operating performance.
warrant obligations and other financial instruments, (vi) share of loss of equity-accounted associates, (vii) depreciation and amortization, (viii) share-based payments expense and (ix) certain non-cash or other special items that we do not consider indicative of our ongoing operating performance. The Company uses this Non-IFRS Financial Measure for business planning purposes and in measuring its performance relative to that of its competitors. The Company believes that this Non-IFRS Financial Measure is a useful financial metric to assess its operating performance from period-to-period by excluding certain items that the Company believes are not representative of its core business. This Non-IFRS Financial Measure is not intended to replace, and should not be considered superior to, the presentation of the Company’s financial results in accordance with IFRS. The use of the Non-IFRS Financial Measure terms may differ from similar measures reported by other companies and may not be comparable to other similarly titled measures. Due to the rounding the numbers presented throughout this document may not precisely add up to the totals. The period-over-period percentage changes are based on the actual numbers and may therefore differ from the percentage changes if those would be calculated based on the rounded numbers The figures in this presentation are unaudited. FY 2024 Financial Results 2
Key operating metrics and financial measure used in the presentation Operating metrics Non-IFRS measure • Monthly Paying Users (MPUs) are the number of individuals who made a purchase Adjusted EBITDA. The Company defines Adjusted EBITDA as the profit/loss for the period, of a virtual item at least once on a particular platform in a calendar month net of tax as presented in the Company's financial statements in accordance with IFRS, • Average Bookings Per Paying User (ABPPU) is the total Bookings attributable to in- adjusted to exclude (i) goodwill and investments in equity accounted associates' impairment, (ii) loss on disposal of subsidiaries, (iii) income tax expense, (iv) other financial income, finance game purchases in a given period, divided by the number of months in that period, income and expenses other than foreign exchange gains and losses and bank charges, (v) divided by the average number of MPUs during the period change in fair value of share warrant obligations and other financial instruments, (vi) share • Bookings are sales contracts generated from in-game purchases and sales of loss of equity-accounted associates, (vii) depreciation and amortization, (viii) share-based of advertisement in a given period payments expense and (ix) certain non-cash or other special items that we do not consider indicative of our ongoing operating performance. Adjusted EBITDA is a non-IFRS financial measure and should not be construed as an alternative to net income/loss as an indicator of operating performance as determined in accordance with IFRS.
non-cash or other special items that we do not consider indicative of our ongoing operating performance. Adjusted EBITDA is a non-IFRS financial measure and should not be construed as an alternative to net income/loss as an indicator of operating performance as determined in accordance with IFRS. In this presentation, we use a number of key operating and non-IFRS financial measure which we believe accurately, in material aspects, reflect the principal parameters of our historic performance. For further information, regarding our operating metrics, see our 2024 Annual Report in Form 20-F filed with the SEC. FY 2024 Financial Results 3
> **[Chart page]** This page contains visual data — view in PDF for the best experience. Financial highlights Revenue, MLN Total costs and expenses, excl. D&A, MLN Other 10% -10% -8% -9% -11% 99 107 89 94 89 Platform commissions 21% 20% 20% Selling and 22% 22% 20% marketing 109 107 106 111 98 25% 26% 25% 25% expenses 54% 58% 53% 55% 55% 4Q23 1Q24 2Q24 3Q24 4Q24 4Q23 1Q24 2Q24 3Q24 4Q24 Profit/(loss) for the period net of tax, $MLN (1) Margin, % Adj EBITDA, $MLN Margin, % 10% -5% 14% 13% 2% 9% -3% 15% 14% 12% -2 11 15 15 10 16 16 12 -5 2 -3 4Q23 1Q24 2Q24 3Q24 4Q24 4Q23 1Q24 2Q24 3Q24 4Q24 Source: Company Information (unaudited) FY 2024 Financial Results (1) See slide #3 for definition and slide #11 for reconciliation to profit/(loss) for the period, net of tax
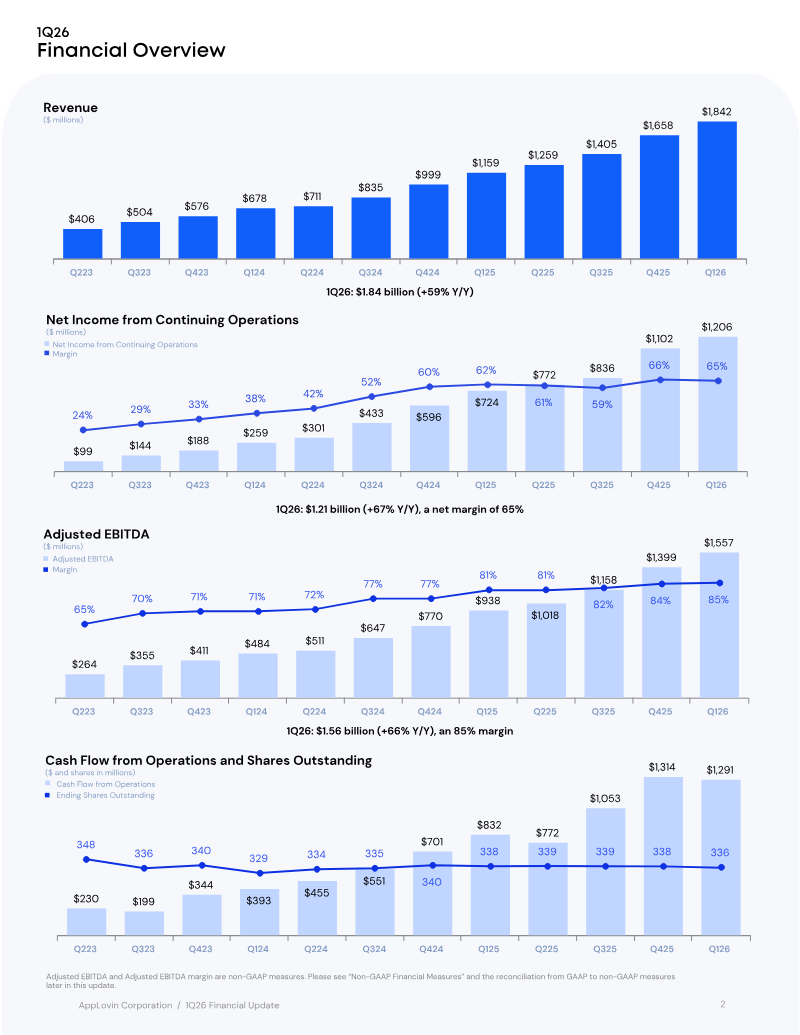
AppLovin’s Q1 2026 financial update reports a revenue of $1.842 billion, up 59% year‑over‑year, and net income from continuing operations of $1.206 billion, a 66% increase to a net margin of 65%. Adjusted EBITDA reached $1.557 billion, an 85% margin, reflecting a 66% rise from the prior year. Cash flow from operations matched Adjusted EBITDA at $1.556 billion, underscoring strong operating liquidity. Shares outstanding averaged 1.053 million, with diluted earnings per share of $3.56. The company’s balance sheet shows cash and equivalents at $2.759 billion, up from $2.487 billion, and total assets of $7.708 billion versus $7.260 billion a year earlier. Long‑term debt remained stable at $3.514 billion, while equity rose to $2.363 billion from $2.135 billion. Operating expenses grew modestly, with research and development increasing to $94 million from $56 million, while sales and marketing rose slightly to $60.8 million. Methodologically, the update presents both GAAP and non‑GAAP measures; Adjusted EBITDA is defined by excluding items such as stock‑based compensation, restructuring costs, and goodwill impairment. The reconciliation table shows cumulative Adjusted EBITDA margins climbing from 65% in Q1 2025 to 85% in Q1 2026, driven by revenue growth and controlled cost expansion. The update covers the United States market for Q1 2026, with data drawn from audited financial statements and internal reconciliations.
The 2026 State of Gaming analysis demonstrates a shifting landscape in which mobile gaming remains the largest driver of downloads—approximately 50 billion in 2025—but its growth rate is slowing. Revenue, however, continues to climb as monetization models mature and lifetime value deepens, especially within hybrid‑casual titles that now generate the most incremental income. In contrast, PC and console platforms experience record revenue growth, with Steam’s premium segment up 32 % and blockbuster releases such as Battlefield 6 capturing significant market share from incumbents. Shooter downloads on these platforms have plateaued, suggesting new titles are primarily cannibalizing existing audiences rather than expanding the category. Genre‑specific dynamics reveal that strategy games are the only mobile genre to grow in downloads, driven by 4X titles from Eastern developers. Action and shooter games dominate PC/console gains, while hyper‑casual remains the largest download engine but shows a notable lift in time spent, particularly in Tier 2 markets. Casual titles face declining day‑7 retention, indicating a stickiness challenge that could erode long‑term player value. Live‑ops and acquisition strategies have evolved toward retention‑focused events, multi‑tier season passes, and expedition‑style rewards. These mechanisms now represent the most reliable revenue drivers across competitive genres such as RPG, action, and simulation. Advertising spend remains concentrated on social channels—YouTube, Facebook/Instagram—and high‑attention formats like video, playable, and rewarded ads. Battlefield 6’s pre‑launch spend surpassed Call of Duty titles, leveraging Facebook, Reddit, and desktop display, while its post‑launch strategy pivoted to YouTube with cinematic, celebrity‑hook creatives. Geographically, the U.S. market shows a skew toward lifestyle and puzzle categories despite lower IAP shares, whereas casino titles exhibit higher spend‑to‑revenue efficiency. Overall, the industry is moving from acquisition toward deeper monetization per user, with indie shooters and simulation titles gaining traction amid intense competition in the shooter segment.
The report argues that non‑gaming mobile applications are experiencing accelerated growth driven by AI integration, short‑form content, and intensified user acquisition competition. Key findings show that Android dominates download volume—particularly in Utilities (79 % of installs) and Life Services (58 %)—while iOS generates a higher share of revenue, especially in Finance & Business (56 % of iOS revenue) and Life Services (57 %). In 2025, AI‑focused apps such as ChatGPT (+1,340 %) and Perplexity (+3,613 %) achieved the highest year‑over‑year download growth, and Short Drama titles like Kuku TV (+45 % k) and RapidTV (+498 %) recorded explosive revenue increases, with AI Social apps (e.g., Character AI +918 %) also driving significant monetization. User acquisition activity expanded across all major categories, with Life Services (+42 %) and Finance & Business (+43.5 %) leading the rise in app counts. Smart bidding adoption surged, with Target ROAS spend increasing by 50 % and Target CPE spending up 57 %, particularly in Utilities and Entertainment. Cost‑per‑install (CPI) analysis revealed that E‑Commerce on Android commands a 3× premium, while Finance & Business on iOS reaches 4.6×, underscoring high competition for transactional users. Monetization patterns shift toward in‑app advertising (IAA), dominating across Education, Utilities, and Entertainment. Video formats—rewarded and interstitial—outperform banner ads by 128–165× eCPM, with North America delivering the highest rewarded video eCPMs (up to 11.8× in Short Drama). The report covers global markets excluding Mainland China from January to December 2025, drawing on anonymized data from Mintegral and Insightrackr across 100+ key app categories.
The 2026 State of Mobile report demonstrates that the global mobile ecosystem remains mature yet increasingly monetized, with 2025 in‑app purchase (IAP) revenue reaching $85.6 billion—a 21 % year‑over‑year rise that now places non‑game apps ahead of games for the first time. Generative AI and short‑form drama have become the fastest‑growing subgenres, driving double‑digit IAP growth; AI assistants such as ChatGPT alone generated $3.4 billion in 2025, while short‑drama apps captured more than ten percent of global video‑entertainment time. These categories also show a shift from acquisition to retention, with session volumes outpacing downloads and time spent tripling in AI apps. Hybrid‑casual and hyper‑casual games continue to lead revenue growth, especially in Tier 2 markets where downloads are falling but engagement is surging. Publishers targeting these segments can capture higher revenue per user, though they face tighter ad‑spend competition and a move toward high‑attention formats. In the gaming web arena, Roblox dominates with 74 % of game‑publisher site visits in 2025, underscoring the importance of product‑centric web design. Beyond entertainment, general‑shopping apps such as Temu and Amazon maintain massive download volumes, with grocery and buy‑and‑sell subgenres growing 5 % and 4 % YoY, respectively. Food & drink apps hit a record 2.4 billion downloads in 2025, driven largely by emerging markets like India and the Middle East. Mobility and sports apps also show notable shifts: Waymo’s standalone app captured 15 % of rideshare MAUs in key U.S. metros, while DFS‑style sports betting apps now command 80 % of the betting‑app MAU share, reflecting regulatory impacts and new market entrants. Overall, the report covers a global geographic scope with particular emphasis on the U.S., India, Western Europe, and emerging Tier 2 markets. It spans 2025 data with forward‑looking insights for 2026, highlighting AI’s transformative role across monetization, user engagement, and competitive dynamics in the mobile industry.