Financialmixi
Consolidated Financial Results: Three Months Ended June 30, 2022
11 pages~19 min full read
Key insights
6 takeaways · ~2 min read- 01
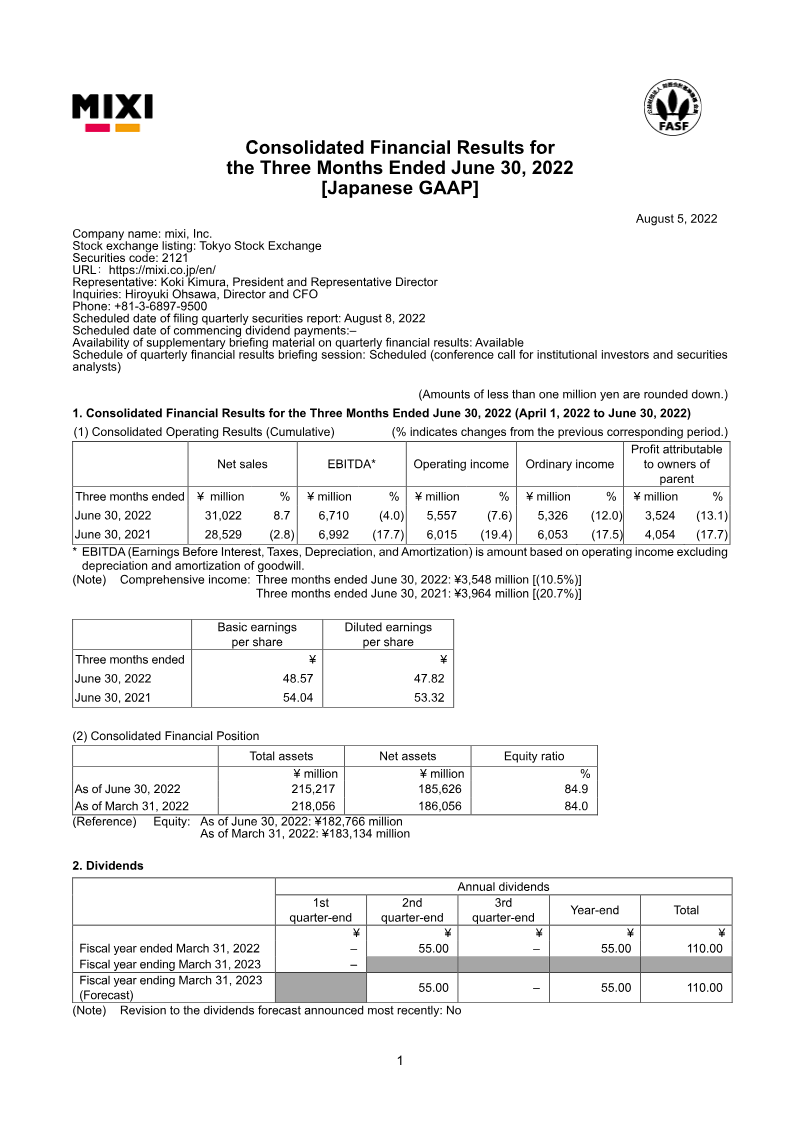
Mixi, Inc. reported a 8.7% year-over-year increase in net sales to ¥31,022 million for the quarter ending June 30, 2022, driven primarily by the Digital Entertainment segment and Monster Strike.
See it on page 10 - 02
Operating income declined 7.6% to ¥5,557 million, while ordinary income attributable to owners of the parent fell 12% to ¥5,326 million due to rising operating expenses and shifts in investment revenue recognition.
See it on page 5 - 03
The company projects a significant full-year 2023 profit contraction, forecasting a 38.5% drop in operating income to ¥12,500 million and a 47.1% drop in ordinary income to ¥8,500 million.
See it on page 2 - 04
Basic earnings per share decreased from ¥54.04 to ¥48.57 compared to the same period in the previous year.
See it on page 1 - 05
Cash and cash equivalents decreased as the company utilized ¥2.3 billion for treasury share repurchases and ¥3.7 billion for dividend payments.
See it on page 7 - 06
Despite profit declines, the company maintains a strong financial position with total assets of ¥215,217 million and an equity ratio of approximately 85%.
See it on page 1
Summary
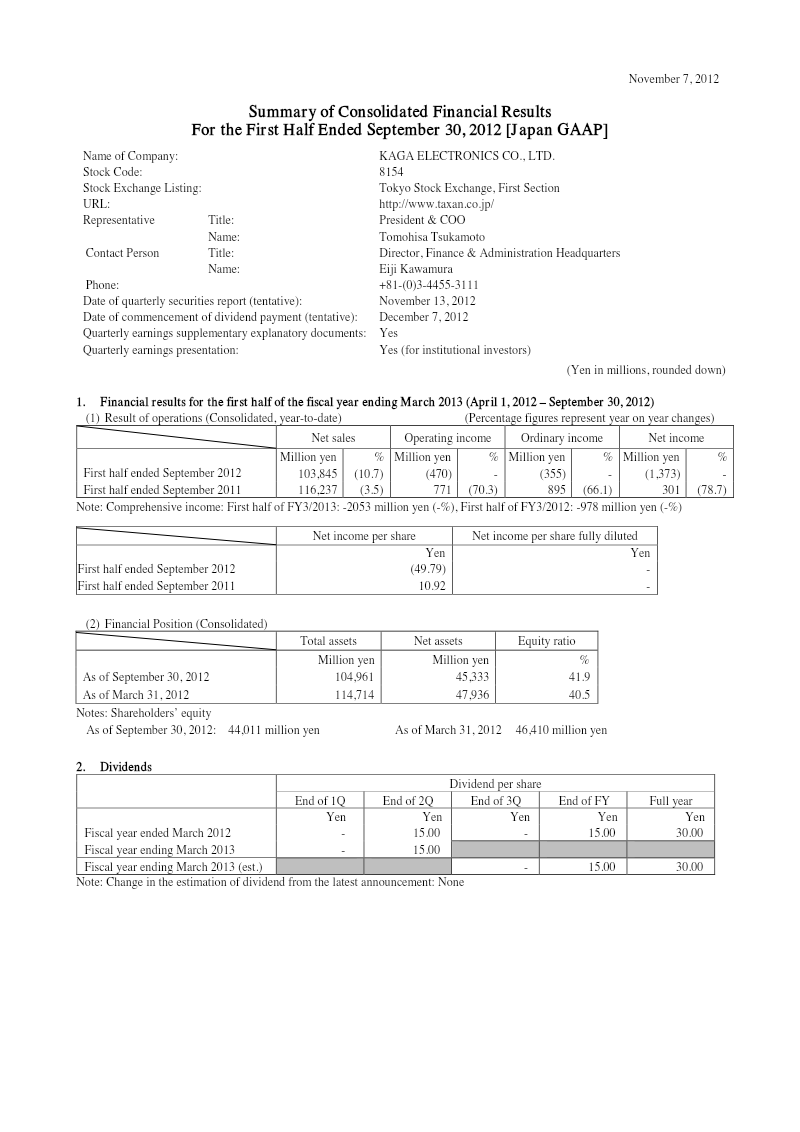
The quarterly consolidated financial results for mixi, Inc. cover the three‑month period ending June 30 2022 under Japanese GAAP. Net sales rose to ¥31,022 million from ¥28,529 million in the same period a year earlier, reflecting an 8.7 % increase driven primarily by the Digital Entertainment segment, notably Monster Strike. Operating income fell to ¥5,557 million from ¥6,015 million, a 7.6 % decline, largely due to higher operating expenses and a shift in revenue recognition for investment activities. Ordinary income attributable to owners of the parent decreased by 12 % to ¥5,326 million, while comprehensive income contracted to ¥3,548 million (10.5 % of sales). Earnings per share declined from ¥54.04 to ¥48.57 (basic) and from ¥53.32 to ¥47.82 (diluted). Total assets were ¥215,217 million with net assets of ¥185,626 million, maintaining an equity ratio near 85 %. Cash and cash equivalents fell to ¥116,117 million, largely due to significant treasury share repurchases of ¥2.3 billion and dividend payments totaling ¥3.7 billion.
The company forecasts full‑year 2023 sales of ¥120,000 million (up 1.6 %) but expects operating income to decline by 38.5 % to ¥12,500 million and ordinary income to drop 47.1 % to ¥8,500 million, reflecting continued investment‑related restructuring and higher cost bases. No revisions to the forecast were announced.
Methodologically, the report relies on quarterly consolidation of all subsidiaries, with no changes in significant subsidiaries or accounting policies except for the adoption of fair‑value measurement guidance. The data are presented in Japanese yen, rounded to the nearest million, and include detailed segment disclosures for Digital Entertainment, Adjustment, Quarterly Entertainment, Sports, Lifestyle, and Investment businesses. The report is intended for Tokyo Stock Exchange investors and analysts, with a scheduled conference call on August 5 2022.
Cite this report
Citation
Generating citation...