Related Documents

Financial
Fiscal Year Ended March 2026: Results Presentation
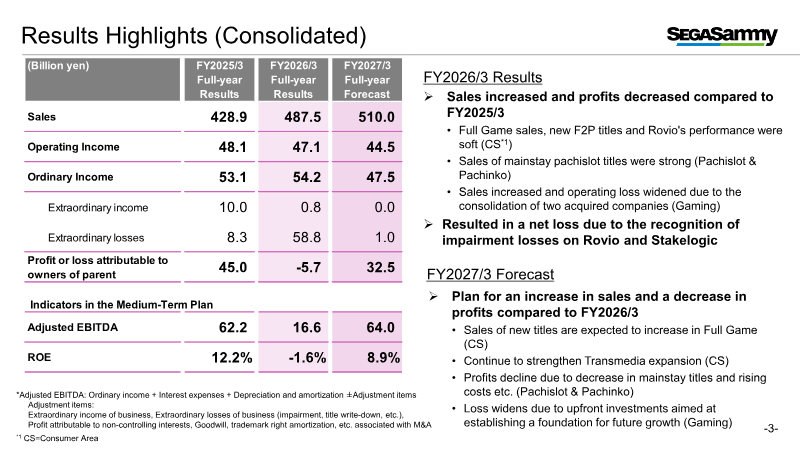
Fiscal year 2026 ended with a 13 % rise in sales to ¥487.5 bn, yet operating income swung from a ¥48.1 bn profit in FY2025 to a ¥5.7 bn loss, driven by significant goodwill impairments on Rovio and Stakelogic and a widening deficit in the Gaming segment. Adjusted EBITDA fell to ¥16.6 bn, reflecting heavy upfront development costs and impairment charges, while net equity contracted by ¥48.7 bn as cash balances were depleted following the acquisitions of GAN and Stakelogic. Within Entertainment Contents, sales edged up to ¥326.6 bn from ¥321.5 bn, but operating income declined from ¥40.8 bn to ¥32.4 bn because new Full‑Game and F2P titles underperformed, despite steady growth in licensing revenue. Forecasts for FY2027 project sales of ¥357 bn and operating income of ¥42.5 bn, contingent on successful new IP launches, repeat sales, and a planned lift in licensing income. Margin erosion from title underperformance remains a key risk. Capital allocation for FY2026/3 was restructured to focus on ¥190 bn of cumulative investment over FY2025–FY2027, allocating ¥80 bn to development, ¥120 bn to strategic acquisitions, and planning ¥70 bn in share buybacks while pausing large‑scale M&A. Shareholder returns are expected to rise sharply, with FY2026/3 projected at ¥31.5 bn (≈¥11.7 bn in dividends) and FY2027/3 potentially reaching ¥16.2 bn under a 50 % total‑return ratio applied to projected net income. Pachislot sales showed modest growth, buoyed by new titles and strong first‑week performance of flagship IPs such as “Hokuto No Ken” and “Kabaneri of the Iron Fortress.” Pachinko sales declined as the temporary lift from Lucky Trigger 3.0 Plus faded and hall utilization softened. The group plans to introduce reel‑exchangeable cabinets, expected to account for roughly 20 % of pachislot revenue, and is positioning the gaming business for a J‑curve bottom in FY2027 through intensive lease sales and B2B platform upgrades. The release schedule for FY2026/3 emphasizes a concentrated push of multi‑platform titles, including the Nintendo Switch 2 launch in March 2026 and a slate of global releases across consoles, PC, and mobile from late 2025 to mid‑2026. Key animation properties such as *Detective Conan* and *Lupin the Third* are slated for April–June 2025, with several new IPs and Netflix exclusives planned for early 2026. Pachislot and pachinko product launches are detailed with projected unit sales ranging from 8,000 to 49,000 units across varying gambling‑specification tiers.
SegaSammyMay 2026

Financial
FY2025 Consolidated Financial Results
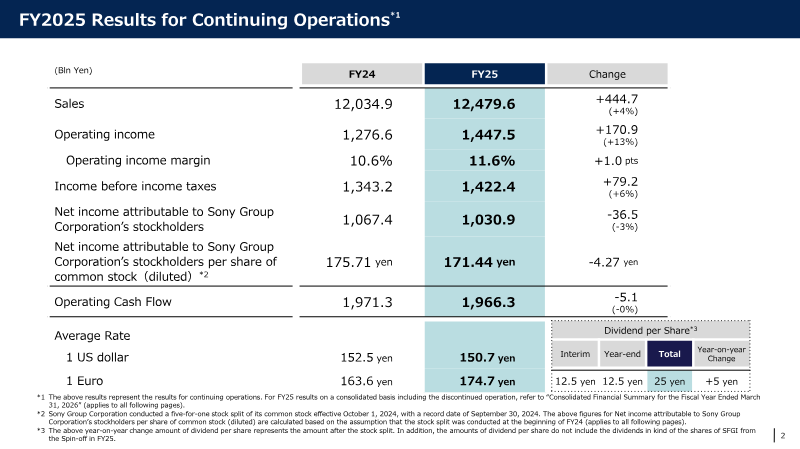
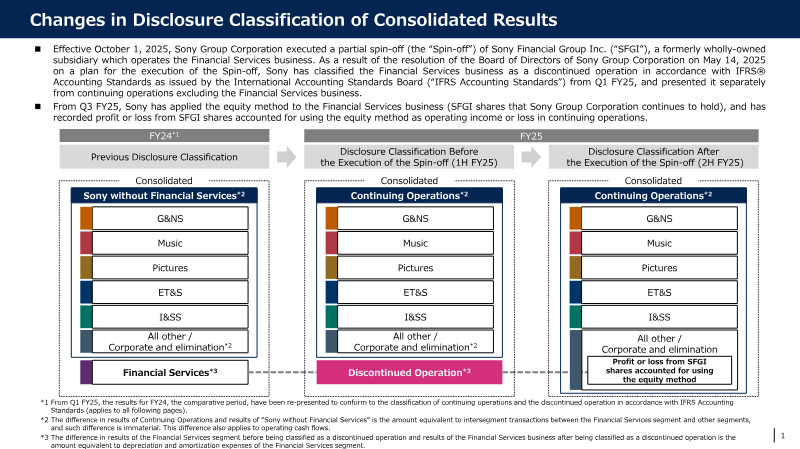
Sony Group’s FY2025 consolidated results demonstrate modest revenue growth and a mixed profitability profile across its core business units. Total sales increased 4 % to ¥12.48 trn, largely driven by higher operating income in the Imaging & Sensing Solutions (I&SS) and Music segments. Operating income rose 13 % to ¥1.45 trn, while net income attributable to shareholders fell 3 % to ¥1.03 trn because of a larger equity‑method loss in the Financial Services arm and higher impairment charges. Operating cash flow remained flat at ¥1.97 trn, and the spin‑off of Sony Financial Group was treated as a discontinued operation from Q1 FY25 onward. Within the Music division, sales climbed 15 % to ¥277.5 billion, propelled by growth in Recorded Music and Music Publishing streaming revenues (+9 % and +14 % respectively), live‑event income, and a strong contribution from the Demon Slayer franchise. Operating income in this segment surged 25 % to ¥89.7 billion, reaching a record high even after excluding one‑time items. Sony projects flat sales for FY2026, with operating income expected to decline 11 % to ¥47 billion as streaming gains are offset by the loss of Demon Slayer’s impact. The company consolidates its Pictures and Music results on a U.S. dollar basis, translating foreign‑currency sales and costs using weighted average exchange rates while accounting for hedging transactions. Foreign‑exchange fluctuations affect both sales and operating income, with I&SS hedging gains or losses incorporated into these calculations. These disclosures supplement, but do not replace, Sony’s IFRS‑compliant consolidated financial statements.
Sony Group CorporationMay 2026

Financial
Bandai Namco Group: Third Quarter Results Presentation FY2026
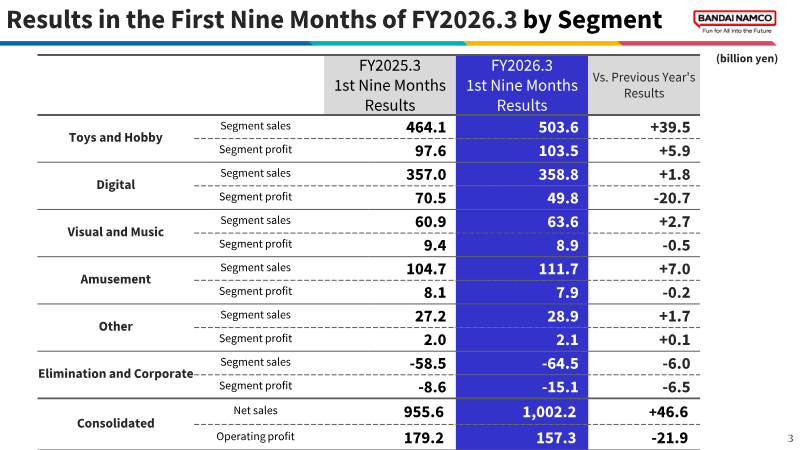
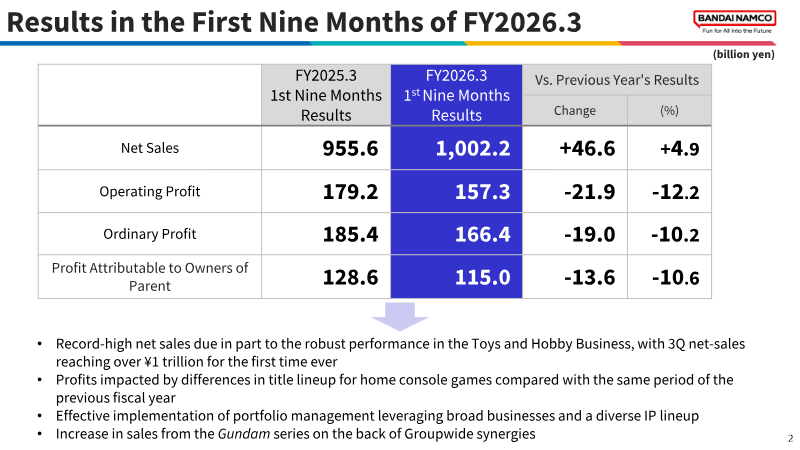
Bandai Namco Group reported record‑high net sales of ¥1,002.2 billion for the first nine months of FY2026, up 4.9 % from ¥955.6 billion in the same period of FY2025, driven primarily by robust performance in the Toys and Hobby segment. That segment achieved ¥503.6 billion in sales, a 9.5 % increase, and contributed ¥103.5 billion in profit, up 6.0 %. Digital sales rose modestly to ¥358.8 billion, while Visual and Music and Amusement segments saw slight declines in profitability due to shifts in title mix and product launches. Operating profit fell 12.2 % to ¥157.3 billion, largely attributed to a less favorable home‑console game lineup compared with the prior year. Full‑year forecasts were revised upward: net sales are now projected at ¥1,300.0 billion (a 4.0 % increase over the previous forecast), operating profit at ¥181.0 billion (up 9.7 %), and ordinary profit at ¥190.0 billion (up 10.5 %). The company maintains a shareholder‑return policy targeting a total return ratio of at least 50 %, with FY2026 dividends set at ¥73 billion (base ¥46 billion plus performance‑based ¥27 billion) and a treasury‑share purchase program of up to 6 million shares, worth up to ¥30 billion. Geographically the results reflect strong North American sales responsiveness and global licensing from flagship IPs such as Gundam, Dragon Ball, and One Piece. Methodologically, the figures derive from consolidated financial statements covering all operating segments, with segment‑level data presented for Toys and Hobby, Digital, Visual and Music, Amusement, Other, and Elimination/Corporate units. The presentation also outlines strategic initiatives for FY2027, emphasizing balanced title portfolios in Digital and continued expansion of experiential amusement facilities.
Bandai NamcoFeb 2026

Report
Square Enix Next: That Excitement Once Again
Square Enix’s recent performance review exposes a persistent decline in revenue growth and profitability over the past three years, with operating income falling 32 % and ROE dropping 61 %. The downturn is driven primarily by weak margins in both high‑definition (HD) and small‑dungeon (SD) game segments, excessive portfolio fragmentation, sub‑optimal product design and promotion, and escalating development costs. While the MMO licensing arm remains the sole growth driver (+11 %), overall gaming revenue has slipped, with HD and SD titles declining 4 % and 5 % respectively. Operating margins for these segments hover around 35–40 %, noticeably higher than the industry average of 28 % but still lagging behind competitors, indicating inefficiencies that are not being adequately addressed. The company’s medium‑term “Reboots” plan offers only high‑level directions without concrete key performance indicators or quantitative targets. Critical gaps include a lack of clear business‑portfolio strategy, insufficient disclosure on non‑core business rationales, and no defined mechanisms for monitoring progress or maximizing shareholder value. Capital allocation disclosures are similarly weak: cost‑of‑capital calculations, ROE and ROIC targets, and hurdle rates are absent, while share‑buyback authorization remains unused despite a sharp price decline. SG&A costs exceed peer norms by 5–6 ppt, driven largely by an oversized sales force, further eroding profit margins. Geographically, SD game revenue is almost entirely domestic; the Japanese market has contracted 2 % annually since 2020, and overseas growth remains only 3 %. The company’s global SD strategy is inert, with a 7 % overseas expansion rate falling short of projected growth and flagship titles such as *FFVII Ever Crisis* deriving 70 % of revenue from Japan. Non‑core Amusement and Publishing businesses are undervalued, with a significant conglomerate discount relative to peers and declining sales and margins. Limited cross‑synergy between game and publishing arms further hampers value creation. In summary, Square Enix faces a multifaceted challenge: declining core game performance, weak strategic direction and KPI setting, high SG&A costs, and an underperforming non‑core portfolio. Addressing these issues through tighter cost control, clearer performance metrics, aggressive overseas expansion, and potential portfolio optimization is essential to restore corporate value and achieve sustainable growth.
InvestGameDec 2025