Related Documents
Financial
Nintendo Q1 FY2024 Financial Results (English)
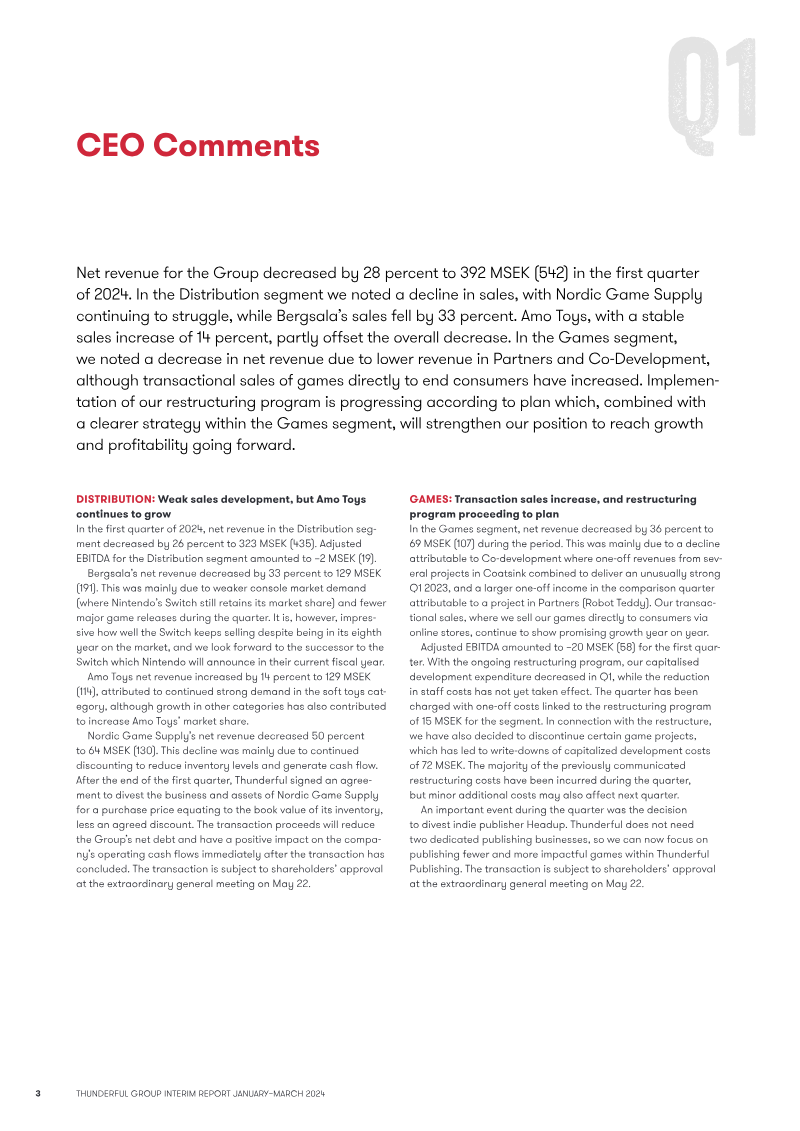
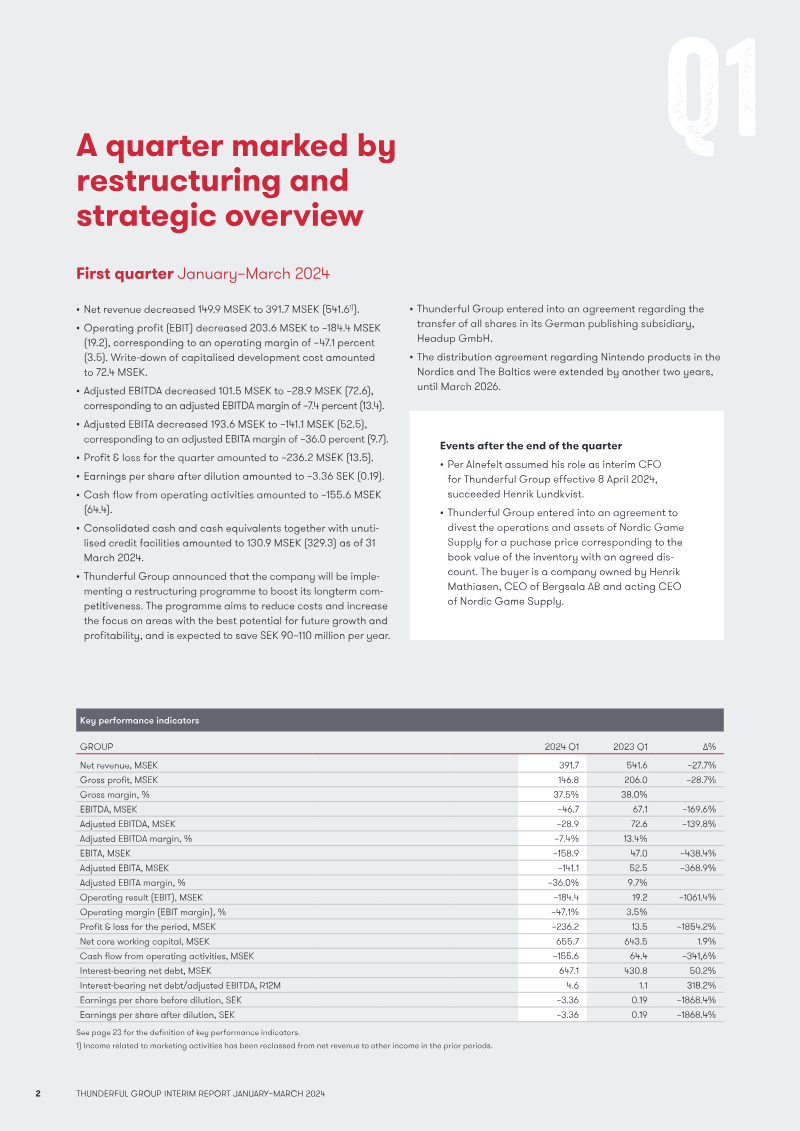
Thunderful Group’s interim report for the first quarter of 2024 details a period of significant financial decline and aggressive corporate restructuring. Net revenue fell 27.7 percent to 391.7 MSEK, while the group recorded an operating loss (EBIT) of 184.4 MSEK, a sharp reversal from the 19.2 MSEK profit reported in the same period the previous year. This downturn was driven by a 35.5 percent revenue drop in the Games segment and a 25.7 percent decrease in Distribution, largely due to weaker market demand for Nintendo Switch products and the underperformance of the internal title SteamWorld Build. To address these challenges, the group initiated a restructuring program aimed at annual cost savings of 90–110 MSEK. This process involved a 72.4 MSEK write-down of capitalized development costs following the cancellation or divestment of twelve game projects. Strategic shifts include the divestment of the German publishing subsidiary Headup GmbH and the sale of Nordic Game Supply’s assets to reduce net debt. Despite these pressures, the group successfully extended its Nintendo distribution agreement for the Nordics and Baltics through March 2026 and reported 13.9 percent growth in its Amo Toys division. The report covers the group’s global operations with a focus on European and Nordic markets for the period of January to March 2024. Financial data indicates a strained liquidity position, with cash and credit facilities dropping to 130.9 MSEK from 329.3 MSEK year-over-year. Management secured a bank waiver conditional on asset divestments and maintains that current funds are sufficient for continued operations. The overarching strategy moving forward emphasizes a simplified games portfolio, more rigorous project validation, and a balanced risk profile across internal and external development.
NintendoJan 2024
Financial
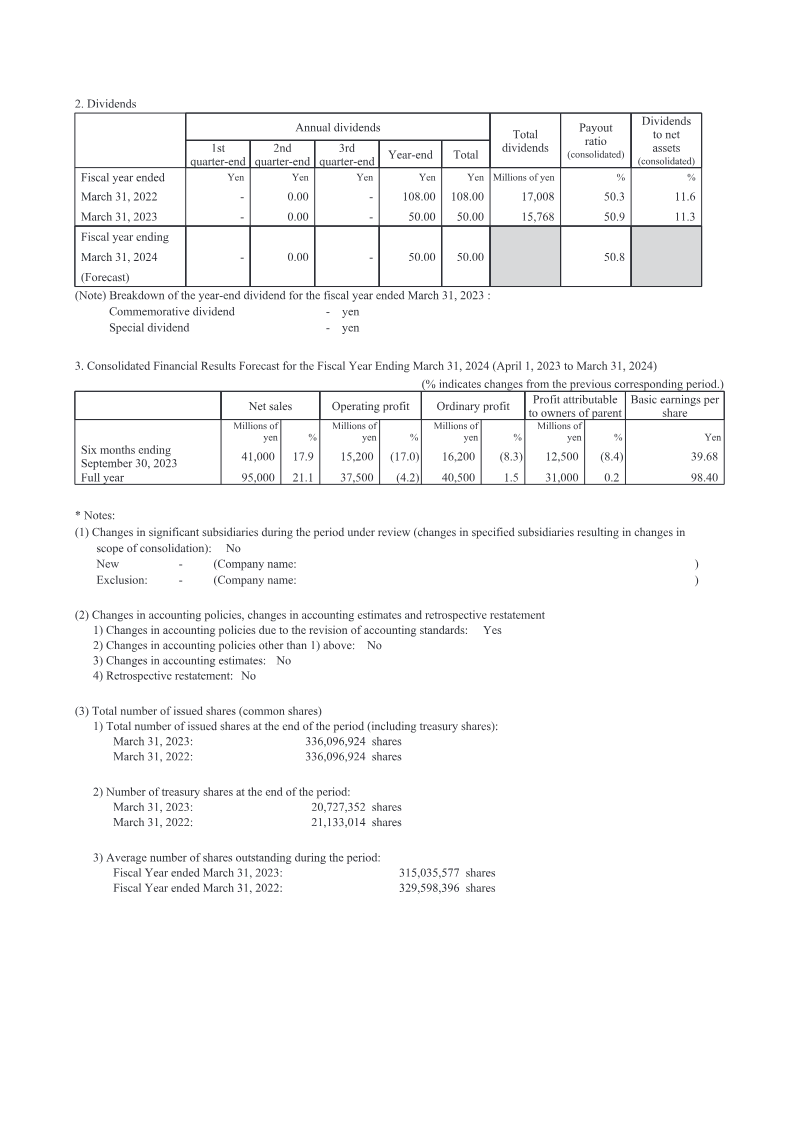
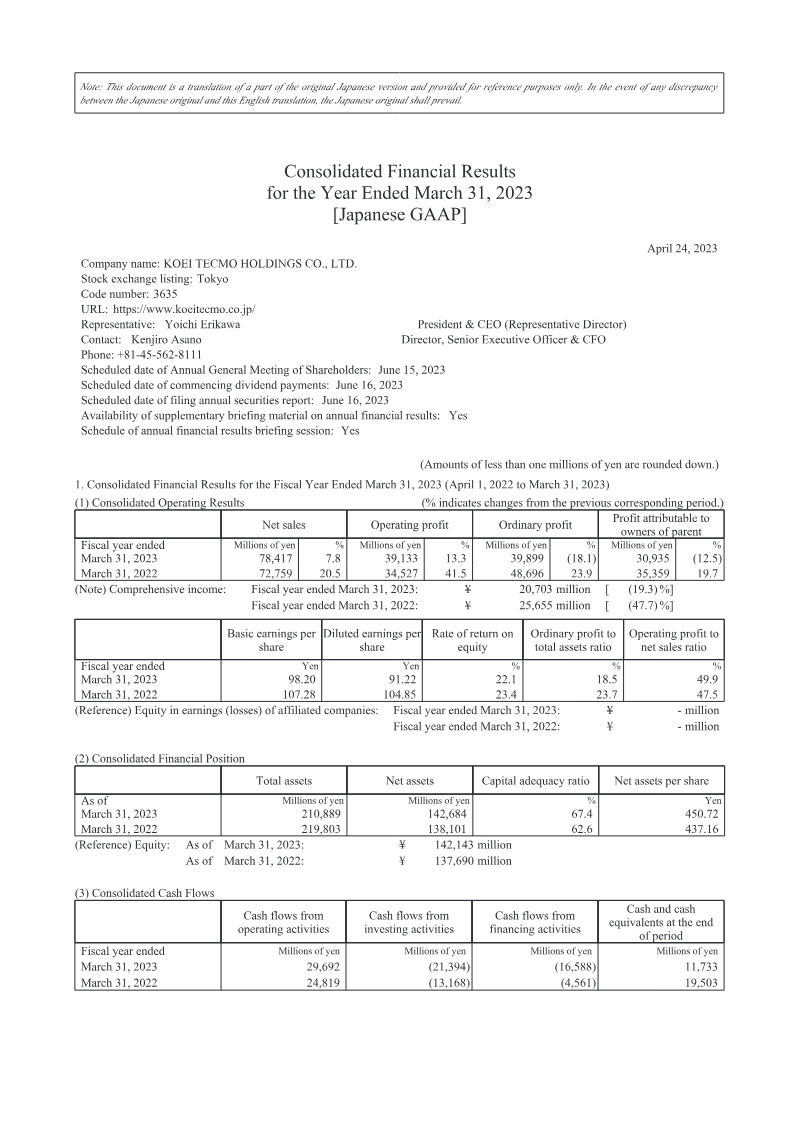
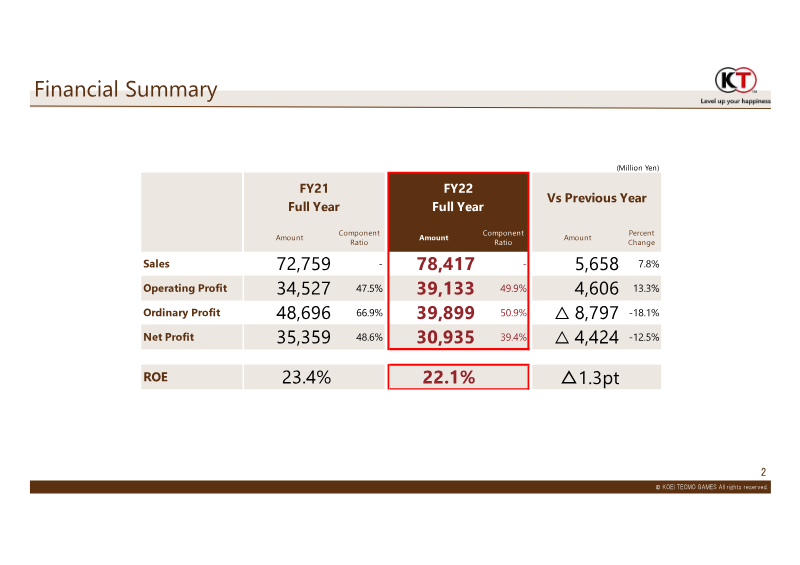
Consolidated Financial Results: Year Ended March 31, 2023
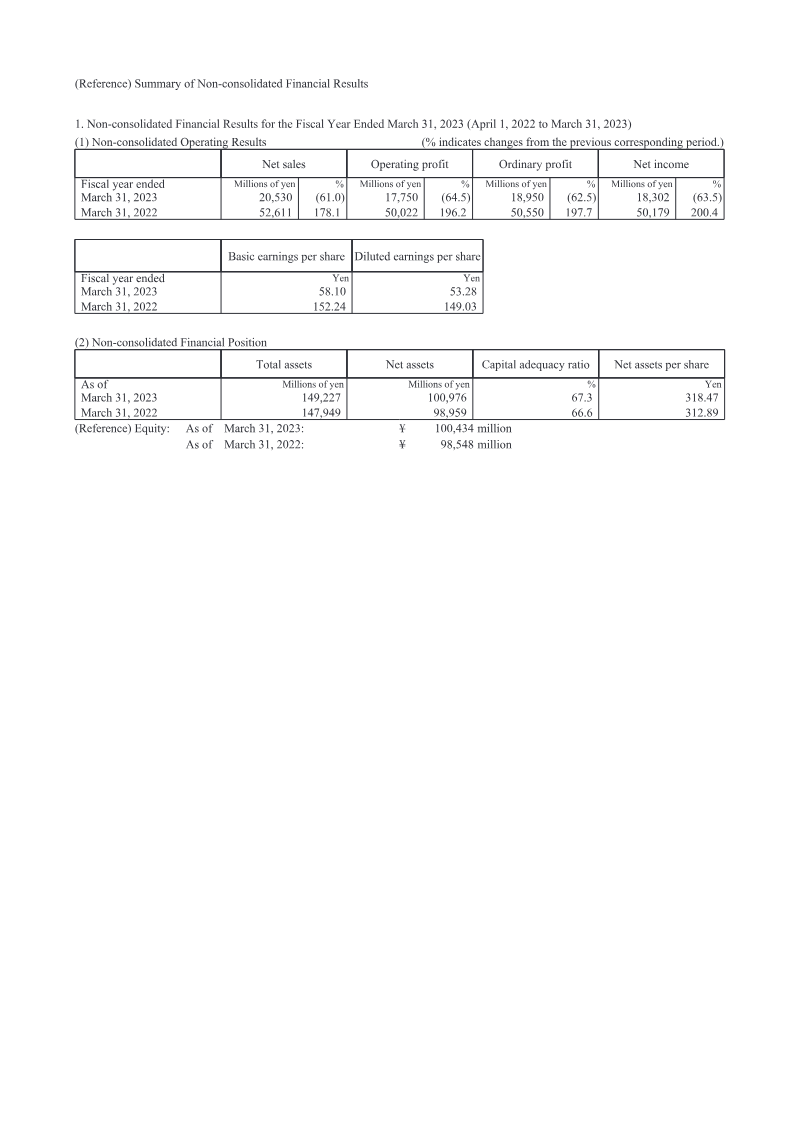
The consolidated financial results for Koei Tecmo Holdings Co., Ltd. cover the fiscal year ending March 31, 2023 (April 1, 2022‑March 31, 2023). Net sales rose to ¥78.4 billion from ¥72.8 billion, a 7.8 % increase, while operating profit climbed to ¥39.1 billion, up 13.3 %. Ordinary profit fell by 18.1 % to ¥39.9 billion, and profit attributable to owners of the parent decreased 12.5 % to ¥30.9 billion, reflecting higher operating costs and a decline in non‑operating income. Comprehensive income for the year was ¥20.7 billion, down 19.3 % from ¥25.7 billion the prior year. Total assets declined to ¥210.9 billion from ¥219.8 billion, while net assets increased to ¥142.7 billion, improving the capital adequacy ratio from 62.6 % to 67.4 %. Cash and cash equivalents fell by ¥7.9 billion, largely due to significant treasury share repurchases and a shift in investment strategy. Operating cash flow rose to ¥29.7 billion, driven by higher operating profit and improved working‑capital management, but investing cash flow remained negative at ¥21.4 billion due to continued investment in securities and property. Dividend policy remained consistent, with a total payout of ¥15.8 billion (50.9 % of net sales) and a year‑end dividend of ¥50 million per share. Forecasts for the 2024 fiscal year project net sales of ¥95 billion and operating profit of ¥21.1 billion, indicating a modest growth outlook amid ongoing market consolidation and regulatory changes. The company’s financial position remains solid, with a stable equity base and manageable debt levels, positioning it to navigate the evolving gaming industry landscape.
Koei Tecmo
Financial
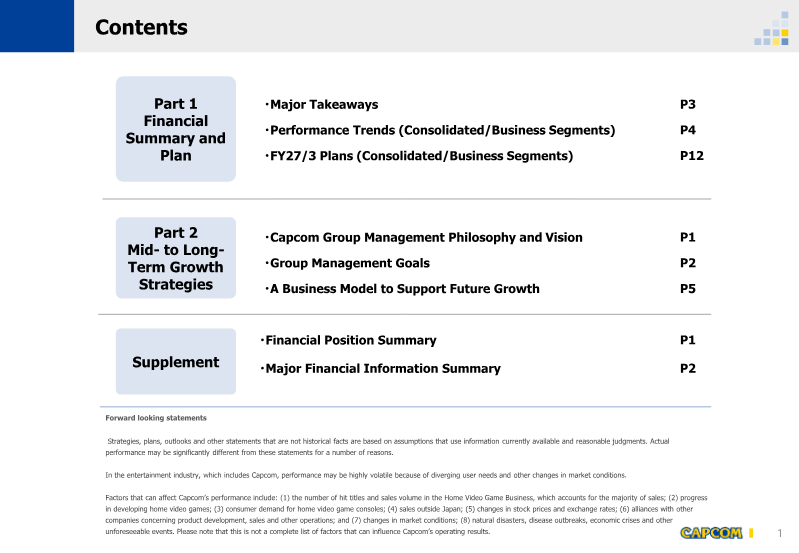
FY26/3 Earnings Summary and Mid- to Long-Term Growth Strategies
Capcom’s FY26/3 earnings marked the company’s strongest performance to date, with net sales reaching ¥1.95 bn and operating profit up 15 % year‑over‑year to ¥752 m. The growth stemmed from a “flywheel” effect: new IP releases, catalog sales, and digital distribution channels all contributed to a record 5.907 million cumulative units sold, up 13.9 % in volume. The company’s strategy for FY27/3 is to sustain this momentum, targeting a 10 %+ operating‑profit increase and expanding its retail footprint to 70 stores. Sales are projected at ¥2.09 bn, driven by quarterly releases of new IP titles and a focus on high‑margin franchises such as Resident Evil, Monster Hunter, and Street Fighter. A key pillar of the plan is a multi‑channel IP exploitation model that includes character licensing, media tie‑ins, eSports, and mobile extensions, with particular emphasis on emerging markets to push long‑term unit volumes toward 100 million. Operationally, Capcom has broadened its development workforce from 2,842 in FY23 to an anticipated 3,180 by FY27, leveraging cross‑generational teams and a proprietary engine to enhance productivity. AI tools have reduced routine task time, freeing developers for creative work. Workforce diversity has improved, with female core‑role representation at 15.7 % and paternity leave uptake at 79.7 %. Capital allocation remains balanced, returning 30 % of cash to shareholders while investing heavily in R&D. The company’s projected operating margin for FY27/3 is 49.8 %, with a shift toward higher digital and online revenue streams, underscoring its commitment to sustainable growth across global markets.
Capcom

Financial
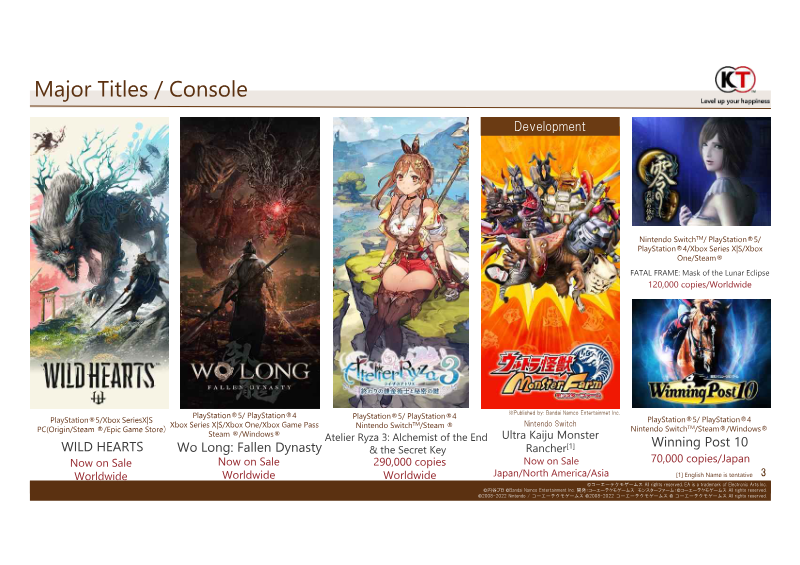
FY2022 Financial Results: Koei Tecmo Holdings
Koei Tecmo Holdings reports FY2022 financial results, emphasizing continued growth in its core gaming segment while expanding into ancillary IP‑licensing and merchandise ventures. Revenue rose 12 % year‑over‑year to ¥45.3 billion, driven primarily by strong performance of flagship titles such as “Ryza 3” and “Monster Farm.” Net income increased to ¥8.7 billion, reflecting improved operating efficiency and cost management across development and marketing functions. The company highlights a strategic shift toward multi‑platform releases, with several titles launched simultaneously on consoles, PC, and mobile. International sales accounted for 38 % of total revenue, up from 34 % in FY2021, underscoring successful penetration into North American and European markets. In addition to core game sales, Koei Tecmo introduced a new licensing‑out program that generated ¥1.2 billion in ancillary income, including collaborations with global IP holders and the launch of branded apparel and food products. Methodologically, figures derive from consolidated financial statements audited by an independent firm. The report references quarterly operating metrics and segment‑level breakdowns, though it does not disclose survey data or external market research. Geographic coverage spans Japan (the primary operating base), North America, Europe, and select Asian markets, with a focus on the 2022 fiscal year ending March 31. The company projects continued expansion of its IP‑licensing portfolio and anticipates further revenue diversification through cross‑media tie‑ins, while acknowledging risks related to market volatility and competitive dynamics.
Koei Tecmo