Related Documents
Financial
FY2025 First Quarter Financial Results Briefing
The briefing presents FY2025 first‑quarter results for GREE, Inc., highlighting a net sales figure of ¥12.9 billion and an operating loss of ¥0.1 billion, largely driven by valuation losses in the Investment Business and foreign‑exchange impacts from yen appreciation. While Game and Anime, Metaverse, and DX segments exceeded forecasts—thanks to strong performance of the Chinese version of *Heaven Burns Red*, continued growth in platform and VTuber services, and solid DX profitability—the Investment Business posted a ¥0.8 billion operating loss due to crypto‑asset valuation declines and write‑downs on maturing funds. Variable costs rose from advertising spend and investment losses, whereas fixed costs remained relatively stable. Geographically, the company operates globally with significant overseas assets; the report notes a ¥1.4 billion FX loss affecting ordinary and net profit. The management plan positions Metaverse and DX as continuous‑growth businesses targeting a 120–140 % CAGR in operating profit, while Game and Anime are treated as long‑term investment assets. Medium‑term targets emphasize aggressive investment in VTuber talent and DX product development, with expectations of profitability from the VTuber segment by FY2026 and accelerated growth in DX by FY2027. Methodologically, the briefing relies on quarterly financial statements, segment‑level performance data, and investment portfolio valuations. The Investment Business’s dual GP/LP structure is explained to contextualize volatility, with an emphasis on long‑term stability despite short‑term losses. Overall, the company projects FY2025 results in line with prior forecasts but anticipates slightly lower Game and Anime sales, offset by higher operating profit from continuous‑growth segments.
GREE
Financial
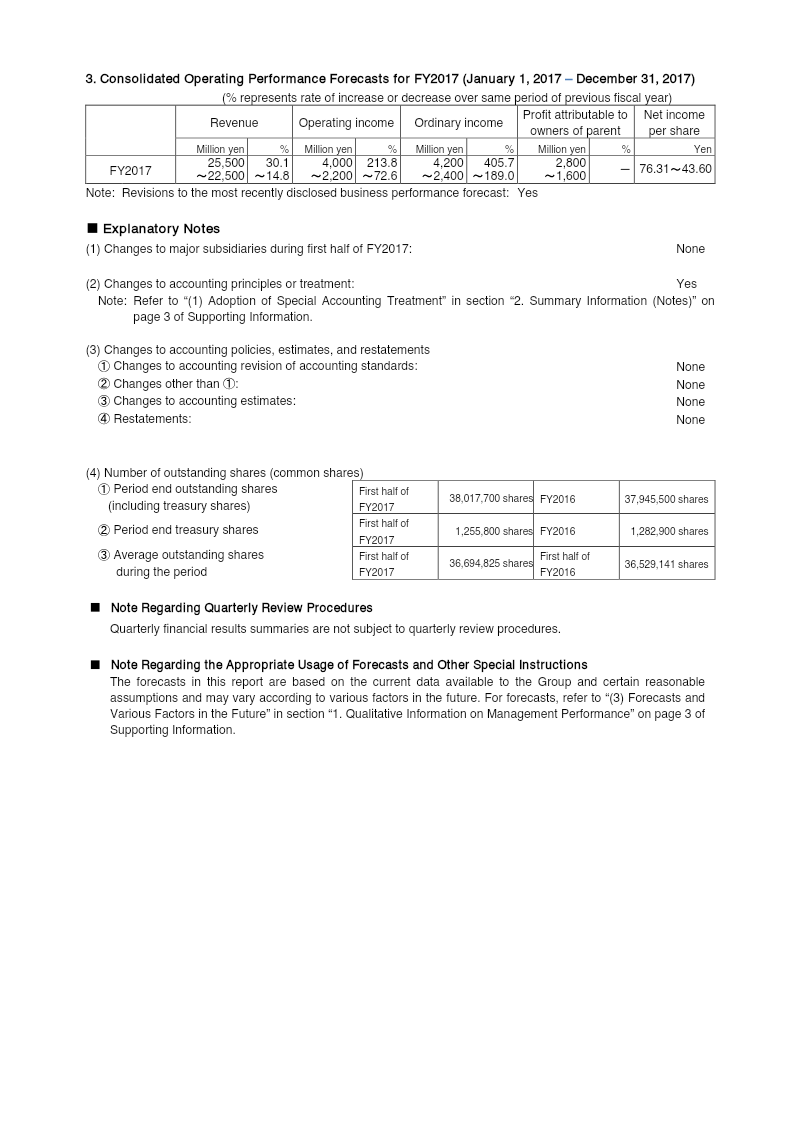
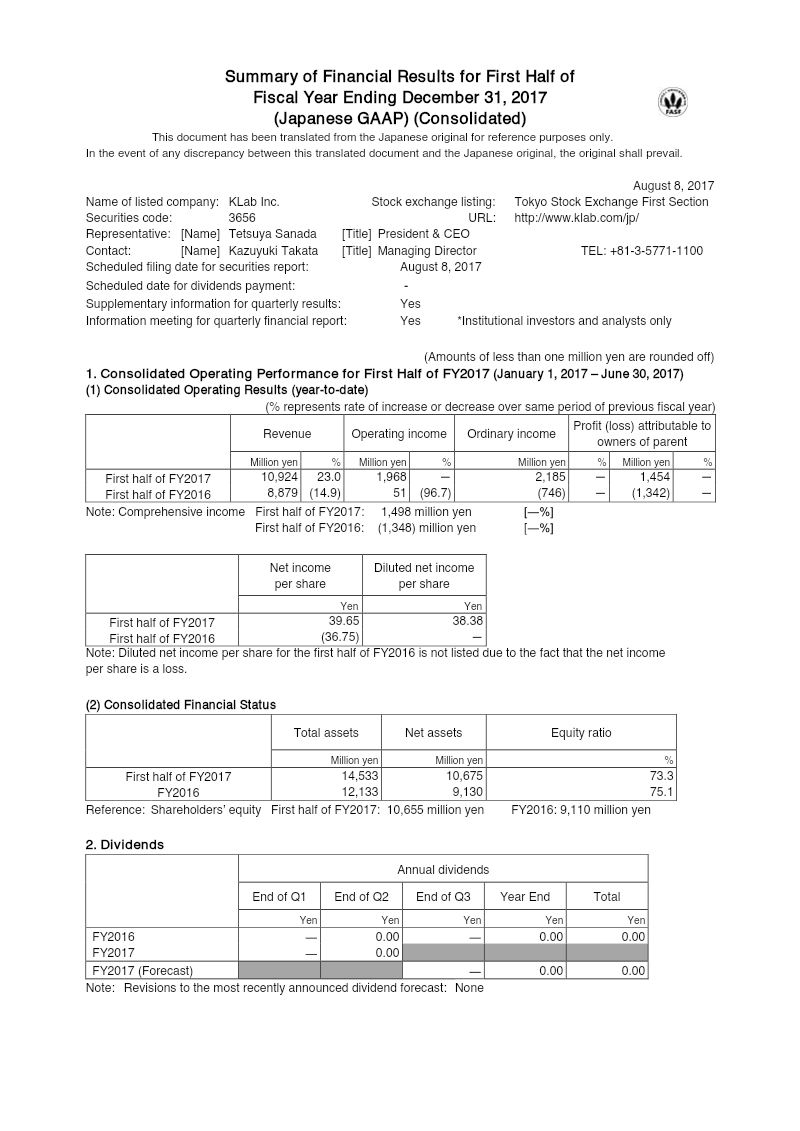
Summary of Financial Results: First Half 2017
KLab Inc. reported a strong first‑half fiscal 2017 performance, with consolidated revenue rising 23 % to ¥10.92 billion compared to ¥8.88 billion in the same period of FY2016. Operating income increased markedly to ¥1.97 billion, up from a loss of ¥51 million the previous year, driven by robust sales of core mobile games and the launch of “Captain Tsubasa ~Tatakae Dream Team~” in mid‑June. Cost of sales grew modestly by 3.9 % to ¥7.02 billion, largely reflecting higher royalty and commission expenses linked to revenue growth. Selling, general and administrative costs fell 6.6 % to ¥1.93 billion due to reduced advertising and outsourcing spend, while non‑operating income of ¥217 million—primarily foreign‑exchange gains—offsets a non‑operating expense of ¥647 million, resulting in ordinary profit of ¥2.19 billion and net income attributable to owners of parent of ¥1.45 billion. Total assets reached ¥14.53 billion, up ¥2.40 billion from FY2016, with net assets increasing to ¥10.68 billion and an equity ratio of 73.3 %. The company maintained a healthy liquidity position, with current assets at ¥9.10 billion and current liabilities at ¥3.85 billion, while retained earnings grew by ¥1.54 billion. KLab revised its FY2017 forecasts upward, projecting revenue of ¥22.5–25.5 billion, operating income of ¥2.20–4.00 billion, ordinary profit of ¥2.40–4.20 billion, and net income attributable to owners of parent between ¥1.60–2.80 billion, reflecting favorable market trends and recent game releases. During the period, KLab acquired ABASEA Inc., making it a 100 % subsidiary and adding Spicemart Inc. as a sub‑subsidiary, with the acquisition cost recorded at ¥1 billion cash. This strategic move aims to enhance data‑analysis capabilities for mobile game operations and expand cross‑border market presence.
KLab
Financial
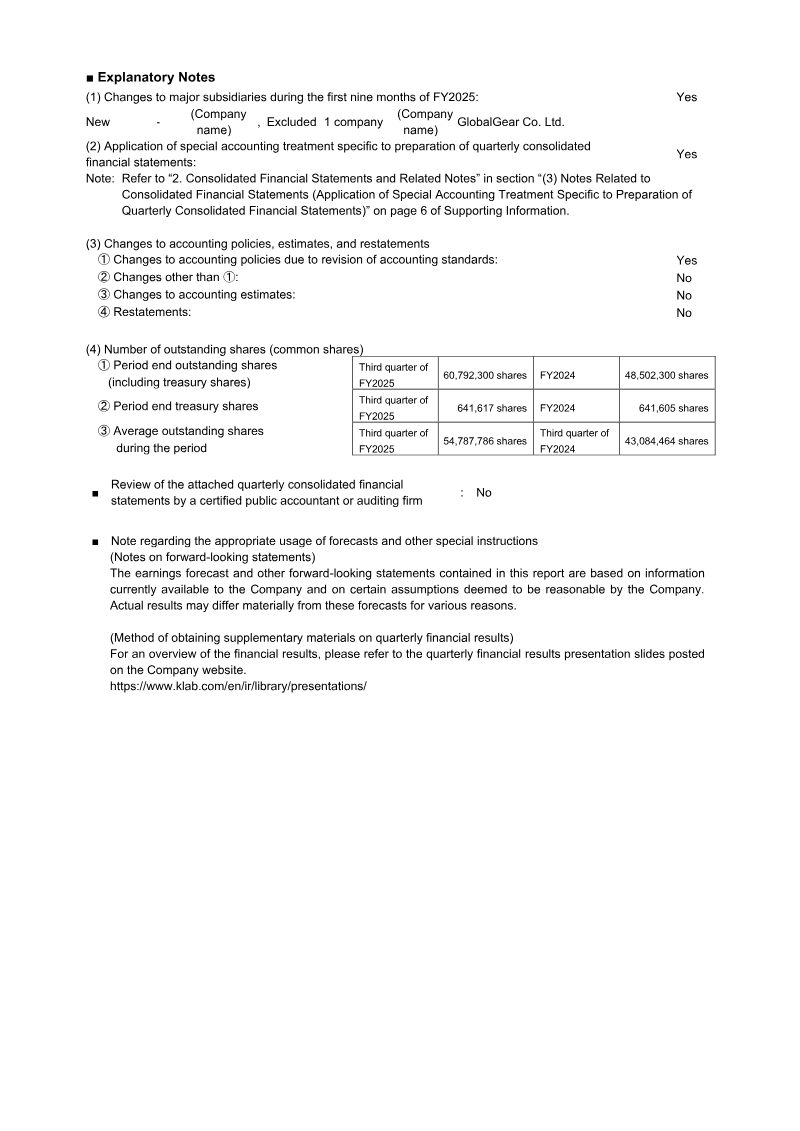
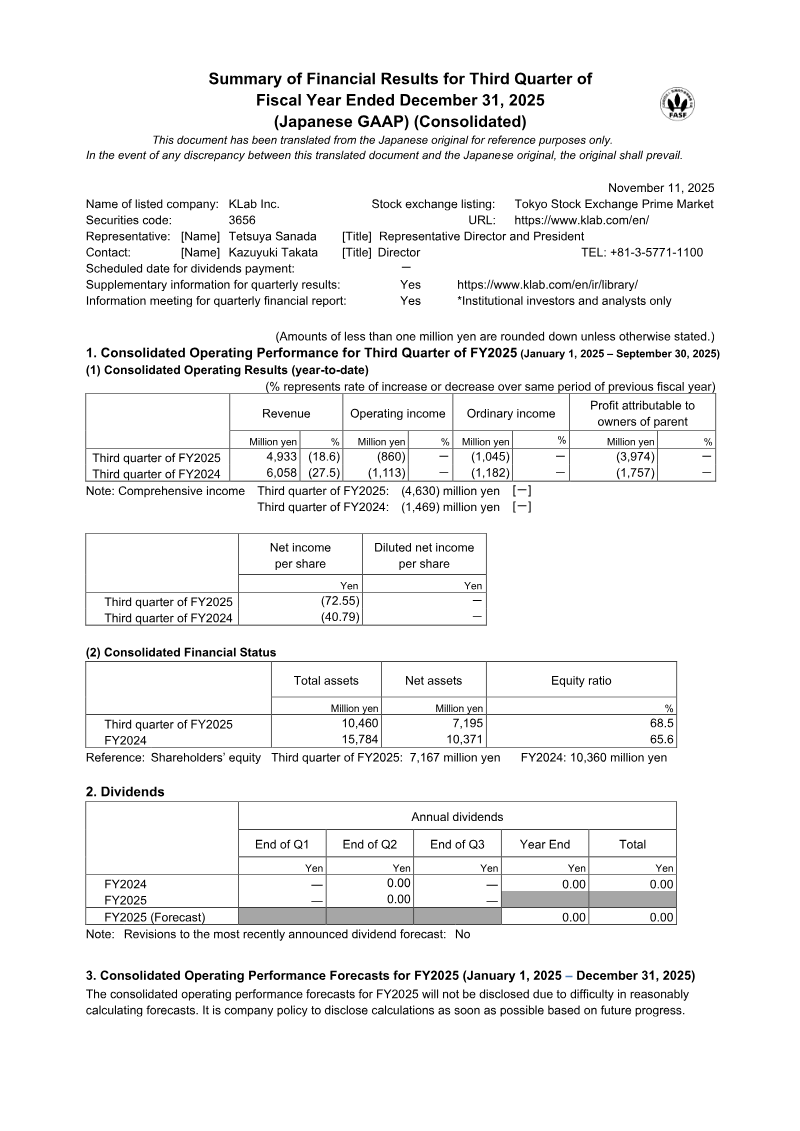
Summary of Financial Results for Third Quarter of Fiscal Year Ended December 31, 2025
KLab Inc. experienced a significant downturn during the third quarter of fiscal year 2025, characterized by an 18.6% year-over-year revenue decline to ¥4.93 billion. This contraction was primarily driven by weakening performance in established titles such as Captain Tsubasa: Dream Team and a general decrease in income from paid users within the game business. Despite aggressive cost-cutting measures and a ¥1.57 billion gain from the sale of investment securities, the company recorded a substantial net loss of ¥3.97 billion. This loss was largely precipitated by a massive ¥4.42 billion impairment charge on software assets related to EA SPORTS FC™ TACTICAL and a reduction in goodwill following the divestment of GlobalGear Co. Ltd. The financial strain resulted in a decrease of over ¥3.1 billion in total net assets, though the company mitigated some impact by raising approximately ¥719 million through the exercise of stock acquisition rights. While four consecutive years of operating deficits have prompted scrutiny regarding the company’s status as a going concern, management asserts that no material uncertainty exists. This confidence is based on steady progress with major intellectual properties, including Dragon Quest and My Hero Academia, alongside a strategic pivot toward generative AI and blockchain ventures to diversify future revenue streams. Operating within the Japanese market during a period of rapid industry volatility, the company has withheld future performance forecasts. The current strategy focuses on maintaining liquidity through strict cost controls and asset sales while transitioning the business model to leverage emerging technologies. Despite the current net losses and the impairment of software in progress, the segment profit of ¥592 million suggests that core operations remain functional as the group attempts to stabilize its capital position and return to long-term profitability.
KLabNov 2025
Financial
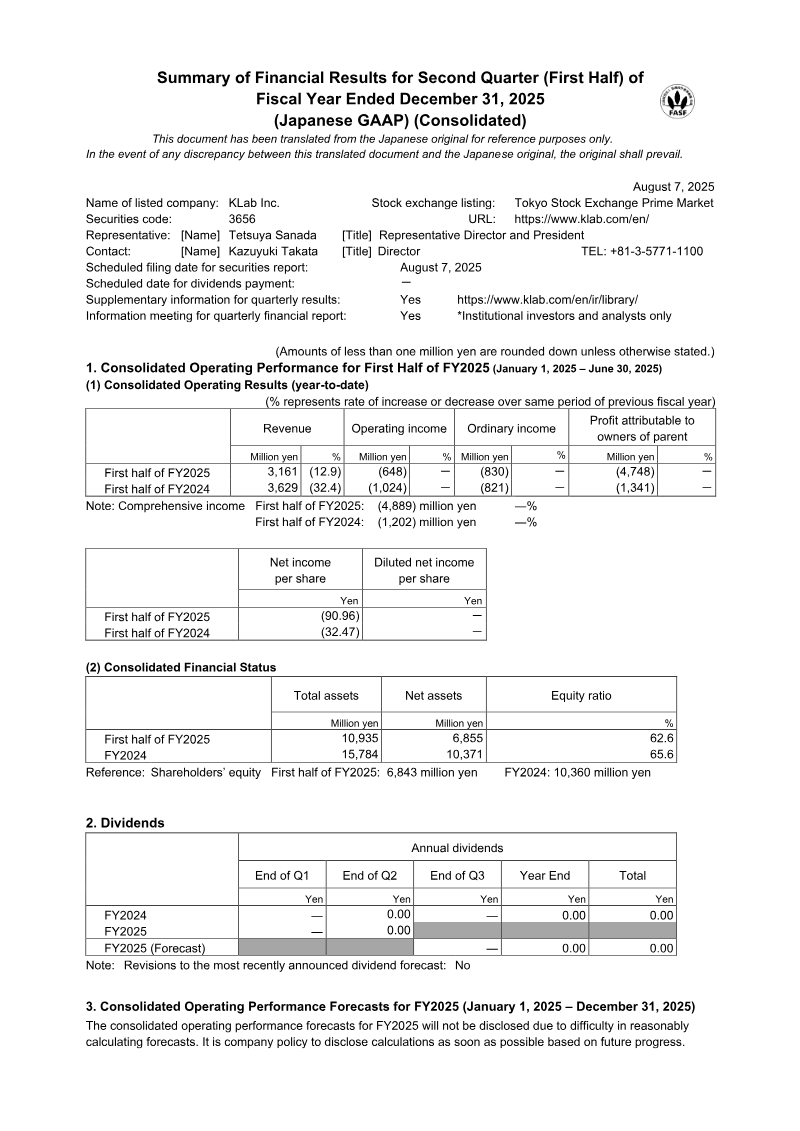
Summary of Financial Results for Second Quarter (First Half) of Fiscal Year Ended December 31, 2025
KLab Inc. experienced a challenging first half of the fiscal year ending December 31, 2025, characterized by a 12.9% year-over-year revenue decline to 3,161 million yen and a substantial net loss of 4,748 million yen. This loss was primarily driven by a 4.43 billion yen impairment on software in progress, which contributed to a sharp reduction in total assets from 15.7 billion yen to 10.9 billion yen. Despite these pressures, the game business segment achieved a profit of 313 million yen, and operating losses showed slight improvement compared to the previous year. Due to ongoing volatility and the difficulty of projecting future performance, no full-year forecast has been provided, and interim dividends have been suspended. To stabilize its financial position and pivot its corporate strategy, the firm executed several capital-raising and restructuring initiatives. These included the sale of the subsidiary GlobalGear for 1.1 billion yen and the issuance of new stock acquisition rights. These rights are tied to rigorous performance hurdles, requiring the company to achieve over 1,000 million yen in non-game revenue and a market capitalization exceeding 10 billion yen before they can be exercised. These measures are designed to incentivize a recovery in market value and diversify revenue streams beyond traditional mobile gaming. Management remains focused on achieving profitability through aggressive cost-cutting, workforce optimization, and a refined development pipeline. While the company has faced four consecutive years of operating deficits and delays in the release of EA SPORTS FC™ TACTICAL, it maintains that there is no material uncertainty regarding its status as a going concern. Future growth is predicated on the successful launch of new projects, including a My Hero Academia title and an expansion into the hybrid casual gaming market. This strategic shift aims to balance the high-risk nature of major game development with more sustainable, diversified business operations.
KLabAug 2025