Key insights
6 takeaways · ~2 min read- 01
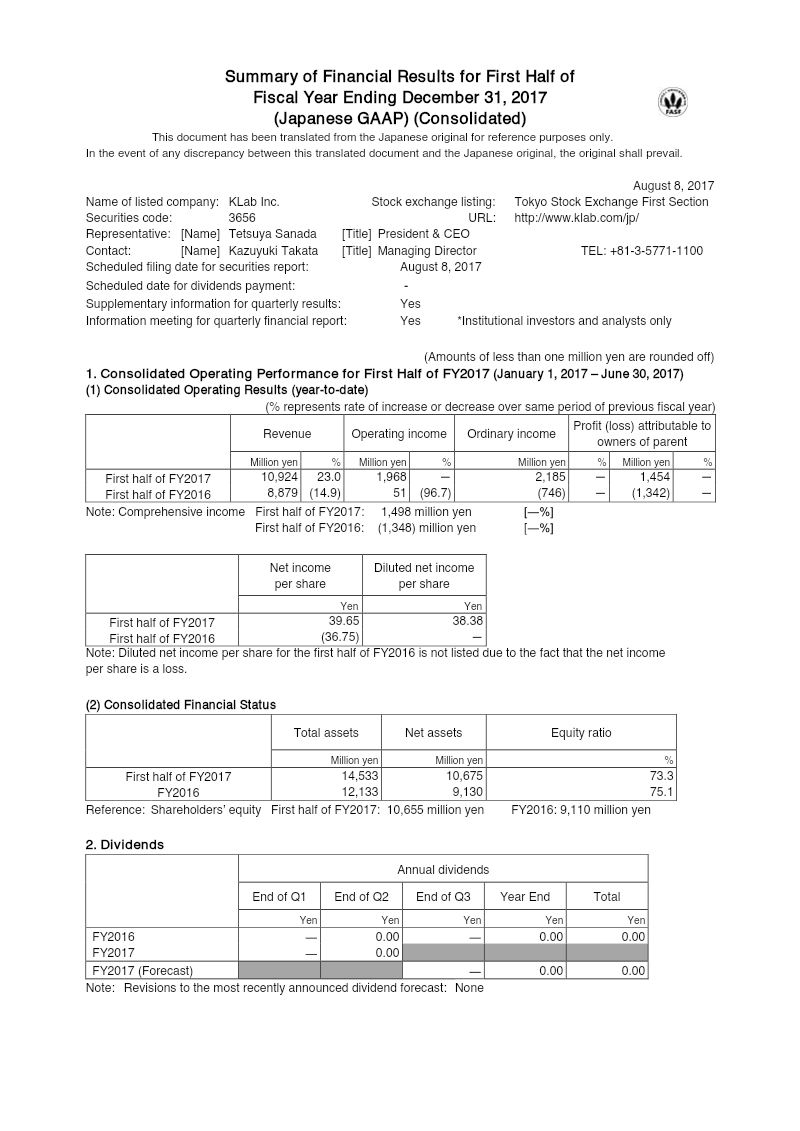
KLab Inc. reported a strong H1 2017 turnaround, with consolidated revenue rising 23% to ¥10.92 billion and operating income reaching ¥1.97 billion, compared to a ¥51 million loss in the same period of 2016.
See it on page 1 - 02
The company upwardly revised its full-year 2017 forecasts, now projecting annual revenue between ¥22.5 billion and ¥25.5 billion and net income between ¥1.60 billion and ¥2.80 billion.
See it on page 2 - 03
Performance was driven by strong sales of core mobile titles and the mid-June launch of 'Captain Tsubasa ~Tatakae Dream Team~'.
See it on page 4 - 04
KLab acquired ABASEA Inc. for ¥1 billion in cash to bolster data-analysis capabilities and expand its cross-border market presence.
See it on page 12 - 05
Operational efficiency improved as selling, general, and administrative costs decreased by 6.6% to ¥1.93 billion, despite a 3.9% increase in cost of sales.
See it on page 4 - 06
The company maintains a strong balance sheet with total assets of ¥14.53 billion and an equity ratio of 73.3%.
See it on page 6