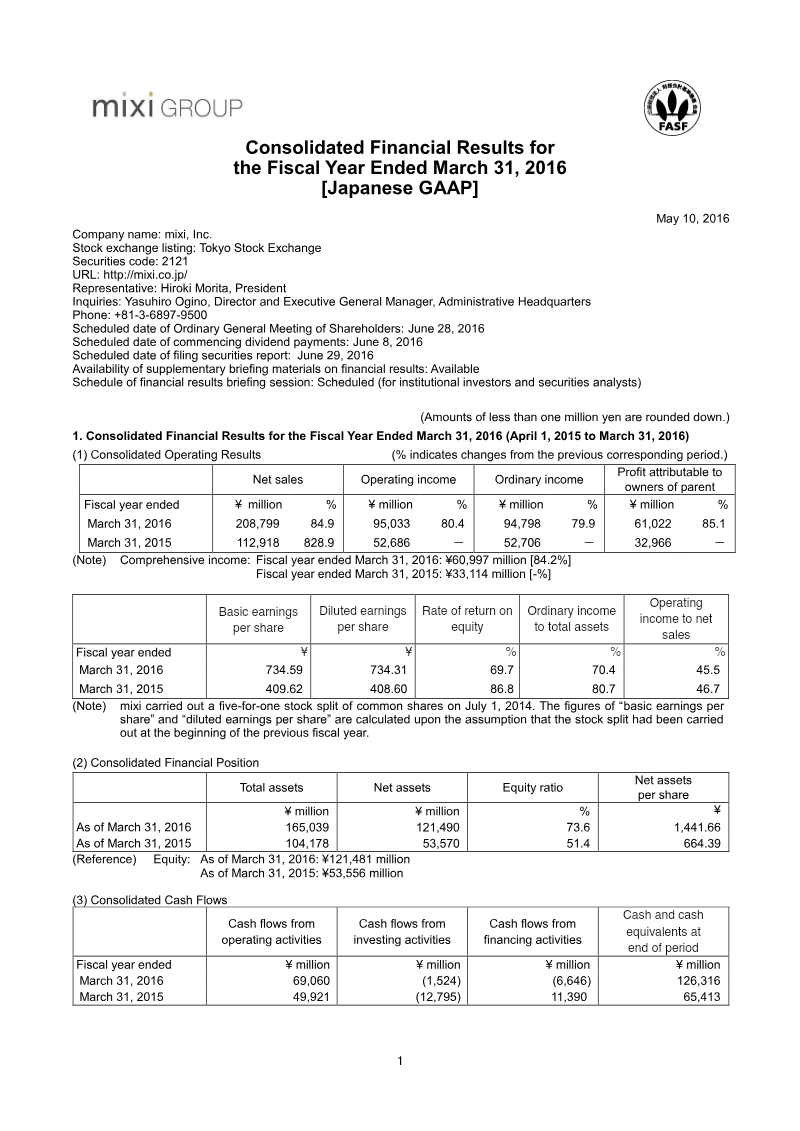
Updated Mar 21, 2026 by mixi
Financial
Published by mixi
Consolidated Financial Results for the Fiscal Year Ended March 31, 2016 Stock exchange listing: Tokyo Stock Exchange Representative: Hiroki Morita, President Inquiries: Yasuhiro Ogino, Director and Executive General Manager, Administrative Headquarters Scheduled date of Ordinary General Meeting of Shareholders: June 28, 2016 Scheduled date of commencing dividend payments: June 8, 2016 Scheduled date of filing securities report: June 29, 2016 Availability of supplementary briefing materials on fi...
FASF Consolidated Financial Results for the Fiscal Year Ended March 31, 2016 [Japanese GAAP] May 10, 2016 Company name: mixi, Inc. Stock exchange listing: Tokyo Stock Exchange Securities code: 2121 URL: http://mixi.co.jp/ Representative: Hiroki Morita, President Inquiries: Yasuhiro Ogino, Director and Executive General Manager, Administrative Headquarters Phone: +81-3-6897-9500 Scheduled date of Ordinary General Meeting of Shareholders: June 28, 2016 Scheduled date of commencing dividend payments: June 8, 2016 Scheduled date of filing securities report: June 29, 2016 Availability of supplementary briefing materials on financial results: Available Schedule of financial results briefing session: Scheduled (for institutional investors and securities analysts) (Amounts of less than one million yen are rounded down.) 1. Consolidated Financial Results for the Fiscal Year Ended March 31, 2016 (April 1, 2015 to March 31, 2016) (1) Consolidated Operating Results (% indicates changes from the previous corresponding period.) Net sales Operating income Ordinary income Profit attributable to owners of parent Fiscal year ended ¥ million % ¥ million % ¥ million % ¥ million % March 31, 2016 208,799 84.9 95,033 80.4 94,798 79.9 61,022 85.1 March 31, 2015 112,918 828.9 52,686 - 52,706 - 32,966 - (Note) Comprehensive income: Fiscal year ended March 31, 2016: ¥60,997 million [84.2%] Fiscal year ended March 31, 2015: ¥33,114 million [-%]
¥ million % ¥ million % ¥ million % March 31, 2016 208,799 84.9 95,033 80.4 94,798 79.9 61,022 85.1 March 31, 2015 112,918 828.9 52,686 - 52,706 - 32,966 - (Note) Comprehensive income: Fiscal year ended March 31, 2016: ¥60,997 million [84.2%] Fiscal year ended March 31, 2015: ¥33,114 million [-%] Basic earnings Diluted earnings Rate of return on Ordinary income Operating per share per share equity to total assets income to net sales Fiscal year ended ¥ ¥ % % % March 31, 2016 734.59 734.31 69.7 70.4 45.5 March 31, 2015 409.62 408.60 86.8 80.7 46.7 (Note) mixi carried out a five-for-one stock split of common shares on July 1, 2014. The figures of “basic earnings per share” and “diluted earnings per share” are calculated upon the assumption that the stock split had been carried out at the beginning of the previous fiscal year. (2) Consolidated Financial Position Total assets Net assets Equity ratio Net assets per share ¥ million ¥ million % ¥ As of March 31, 2016 165,039 121,490 73.6 1,441.66 As of March 31, 2015 104,178 53,570 51.4 664.39 (Reference) Equity: As of March 31, 2016: ¥121,481 million As of March 31, 2015: ¥53,556 million (3) Consolidated Cash Flows Cash flows from Cash flows from Cash flows from Cash and cash operating activities investing activities financing activities equivalents at end of period Fiscal year ended ¥ million ¥ million ¥ million ¥ million March 31, 2016 69,060 (1,524) (6,646) 126,316 March 31, 2015 49,921 (12,795) 11,390 65,413
2. Dividends 1st 2ndAnnual dividends Total Payout ratio Dividends to quarter- quarter- 3rd Year-end Total dividends paid (consolidated) equity end end quarter- (annual) (consolidated) end ¥ ¥ ¥ ¥ ¥ ¥ million % % Fiscal year ended - 23.00 - 59.00 82.00 6,605 20.0 17.4 March 31, 2015 Fiscal year ended - 70.00 - 77.00 147.00 12,386 20.0 14.0 March 31, 2016 Fiscal year ending March 31, 2017 - - - - 129.00 20.0 (Forecast) (Note) mixi presents only the total amount of dividends for the forecast of dividends to be paid for the fiscal year ending March 31, 2017 based on the consolidated financial results forecast for the full year. The dividends to be paid at the second quarter-end and the year-end have yet to be determined. 3. Consolidated Financial Results Forecast for the Fiscal Year Ending March 31, 2017 (April 1, 2016 to March 31, 2017) (% indicates changes from the previous corresponding period.) Net sales Operating income Ordinary income Profit attributable Basic earnings per to owners of parent share ¥ million % ¥ million % ¥ million % ¥ million % ¥ Full year 218,000 4.4 80,000 (15.8) 80,000 (15.6) 54,000 (11.5) 640.84 * Notes: (1) Changes in significant subsidiaries during the fiscal year ended March 31, 2016 (changes in specified subsidiaries resulting in change in scope of consolidation): No (2) Changes in accounting policies, changes in accounting estimates and retrospective restatement 1) Changes in accounting policies due to the revision of accounting standards: Yes 2) Changes in accounting policies other than 1) above: No 3) Changes in accounting estimates: No 4) Retrospective restatement: No Please refer to Notes to Consolidated Financial Statements.
retrospective restatement 1) Changes in accounting policies due to the revision of accounting standards: Yes 2) Changes in accounting policies other than 1) above: No 3) Changes in accounting estimates: No 4) Retrospective restatement: No Please refer to Notes to Consolidated Financial Statements. (3) Total number of issued shares (common shares) 1) Total number of issued shares at the end of the period (including treasury shares): March 31, 2016: 84,295,500 shares March 31, 2015: 83,203,000 shares 2) Total number of treasury shares at the end of the period: March 31, 2016: 30,500 shares March 31, 2015: 2,592,500 shares 3) Average number of shares during the period: Fiscal year ended March 31, 2016: 83,069,669 shares Fiscal year ended March 31, 2015: 80,480,786 shares (Note) mixi carried out a five-for-one stock split of common shares on July 1, 2014. Therefore, the figures of “Average number of shares” are calculated upon the assumption that the stock split had been carried out at the beginning of the fiscal year ended March 31, 2015.
(Reference) Outline of Non-consolidated Financial Results 1. Non-consolidated Financial Results for the Fiscal Year Ended March 31, 2016 (April 1, 2015 to March 31, 2016) (1) Non-consolidated Operating Results (% indicates changes from the previous corresponding period.) Net sales Operating income Ordinary income Profit Fiscal year ended ¥ million % ¥ million % ¥ million % ¥ million % March 31, 2016 199,025 86.0 96,432 85.4 96,657 85.3 61,959 88.2 March 31, 2015 106,990 - 52,003 - 52,169 - 32,919 - Basic earnings per Diluted earnings per share share Fiscal year ended ¥ ¥ March 31, 2016 745.87 745.59 March 31, 2015 409.04 408.02 (Note) mixi carried out a five-for-one stock split of common shares on July 1, 2014. The figures of “Basic earnings per share” and “Diluted earnings per share” are calculated upon the assumption that the stock split had been carried out at the beginning of the fiscal year ended March 31, 2015. (2) Non-consolidated Financial Position Total assets Net assets Equity ratio Net assets per share ¥ million ¥ million % ¥ As of March 31, 2016 161,949 121,656 75.1 1,443.70 As of March 31, 2015 101,181 52,775 52.2 654.59 (Reference) Equity: As of March 31, 2016: ¥121,653 million As of March 31, 2015: ¥52,766 million * Presentation regarding the implementation status of audit procedures At the time of disclosure of these financial results, the audit procedures for these financial statements under the Financial Instruments and Exchange Act have not been completed.
million As of March 31, 2015: ¥52,766 million * Presentation regarding the implementation status of audit procedures At the time of disclosure of these financial results, the audit procedures for these financial statements under the Financial Instruments and Exchange Act have not been completed. * Explanation of the proper use of financial results forecast and other notes 1. The financial results forecasts of this document are judgments made by mixi based on information currently available which include latent risks and uncertainties. Please be acknowledged that actual results may differ from these forecasts due to changes in various factors when making investment decisions. 2. mixi has scheduled a financial results briefing session for institutional investors and securities analysts on May 10, 2016. Financial results briefing material for the session will be posted on mixi’s website shortly.
The 2021 Fact Book presents a comprehensive overview of Bandai Namco Holdings’ strategic direction, emphasizing its transformation into a globally integrated entertainment conglomerate and its commitment to corporate social responsibility. Central to the narrative is the thesis that sustained growth across toys, video games, animation and amusement can be achieved through diversified product portfolios, expansive international operations, and proactive sustainability initiatives. The company’s evolution is traced from a collection of independent toy, arcade‑machine and media firms to a unified group after the 2005‑2007 merger of Bandai and Namco. Key milestones include the launch of flagship lines such as Gundam models (over 500 million units shipped), Tamagotchi (exceeding 20 million units), and Zatchbell Battle (300 million units), as well as the development of major video‑game franchises—TEKKEN, DARK SOULS III and Tales—collectively surpassing 50 million sales. International expansion is evident through subsidiaries and regional headquarters in North America, Europe and Asia, reinforced by repeated listings on the Tokyo Stock Exchange and industry recognitions such as Cannes Best Actor and TSE awards. Environmental and social performance data for fiscal year 2021 highlight a suite of CSR actions, including CO₂ reduction targets, supply‑chain safety measures and work‑life‑balance programmes, all framed within the “NEXT STAGE” mid‑term plan aimed at deepening engagement with a mature fan base and broadening cross‑media offerings. The Fact Book thus underscores Bandai Namco’s dual focus on market leadership and sustainable corporate practices across a worldwide footprint and multiple entertainment segments.
KLab Inc. reported consolidated financial results for the first half of fiscal year 2020, covering the period from January 1 to June 30, 2020. The data reveals a divergence between top-line growth and bottom-line profitability. Revenue increased by 7.7% year-over-year to 15.9 billion yen, driven primarily by the core Game Business segment, which accounted for 15.8 billion yen of total turnover. Despite this growth, operating income fell by 42.2% to 753 million yen, and profit attributable to owners of the parent plummeted by 98% to just 16 million yen. The sharp decline in profitability is attributed to rising costs and significant non-operating and extraordinary items. The cost of sales rose from 10.9 billion yen to 12.8 billion yen, while ordinary income was pressured by 243 million yen in foreign exchange losses. Furthermore, the company recorded a substantial extraordinary impairment loss of 498.8 million yen related to goodwill in its Research and Consulting Business, after determining that the segment lacked its initially anticipated profitability. Geographically focused on the Japanese market but with international exposure, the company maintained a stable equity ratio of 66.2% with total assets valued at 23.3 billion yen. Looking ahead, the full-year forecast for 2020 suggests significant volatility, with revenue projected between 33 billion and 36 billion yen. While the company anticipates a potential recovery in net income, the wide forecast range reflects ongoing uncertainty in the operating environment. No dividends were paid during the period, consistent with previous fiscal cycles.
This financial presentation details GREE, Inc.’s performance for the third quarter of fiscal year 2018, ending March 31, 2018. The primary thesis centers on a strategic transition toward a three-pillar business model comprising mobile gaming, advertising and media, and a newly established live entertainment segment. Geographically, the report covers the Japanese domestic market and ongoing expansion efforts into North America, with future plans for Asia and Europe. Financial results for the quarter show net sales of ¥17.9 billion and operating income of ¥2.8 billion. While the company missed its revenue targets due to delays in title launches and business acquisitions, it exceeded profit expectations through aggressive cost reductions. Fixed costs were reduced by ¥500 million, and advertising spending was optimized, resulting in a 15% operating margin. For the fourth quarter, the company forecasts a slight revenue increase to ¥18.5 billion, supported by the global rollout of titles like DanMachi and the domestic performance of new releases such as In Love with News and Puchiguru Love Live!. A significant strategic shift highlighted is the entry into the live entertainment business, specifically focusing on the Virtual YouTuber (VTuber) market. GREE intends to leverage its existing 3D engineering capabilities from its gaming and VR divisions to manage production, distribution, and IP development for VTubers. Additionally, the company is diversifying its gaming portfolio by moving successful mobile IPs like Another Eden to consoles, including the Nintendo Switch. In the media segment, the travel application aumo is noted for its high category ranking, signaling steady growth in vertical media and client acquisition.
Bandai Namco’s 2017 integrated report presents a comprehensive account of the company’s financial, strategic, and governance performance, emphasizing the central role of its “IP‑axis” strategy in achieving record results. By leveraging core intellectual properties across games, toys, visual media, and music, the group generated ¥620.1 billion in net sales and ¥63.2 billion in operating profit, a 27.7 % year‑on‑year increase, while free‑cash flow rose 47.7 %. The Network Entertainment segment contributed 57.9 % of sales and 63.8 % of profit, with flagship franchises such as Mobile Suit Gundam (¥74 billion) and Dragon Ball (¥61 billion) underpinning cross‑media expansion and overseas growth in Asia, Europe, and the Americas. Strategic outlook is framed by the newly launched three‑year “NEXT STAGE” plan, which targets global IP expansion, regional autonomy, and continued innovation to meet mid‑term objectives a year ahead of schedule. Governance is reinforced through a ten‑member board—including three independent directors—and an audit‑supervisory board meeting Japanese Corporate Governance Code standards. A robust compliance and risk‑management framework, performance‑linked director compensation, and extensive investor‑relations activities underscore the company’s commitment to transparency and stakeholder trust. Corporate‑social‑responsibility initiatives achieved a 27 % reduction in CO₂ emissions since FY2012 and introduced universal‑design products and supplier audits. Financially, profit attributable to owners reached ¥44.2 billion, EPS rose to ¥201, and dividends of ¥15.4 billion were declared. Acquisitions such as