FinancialKadokawa Corporation
Summary of Consolidated Earnings Results for the Nine Months Ended December 31, 2025
15 pages~31 min full read
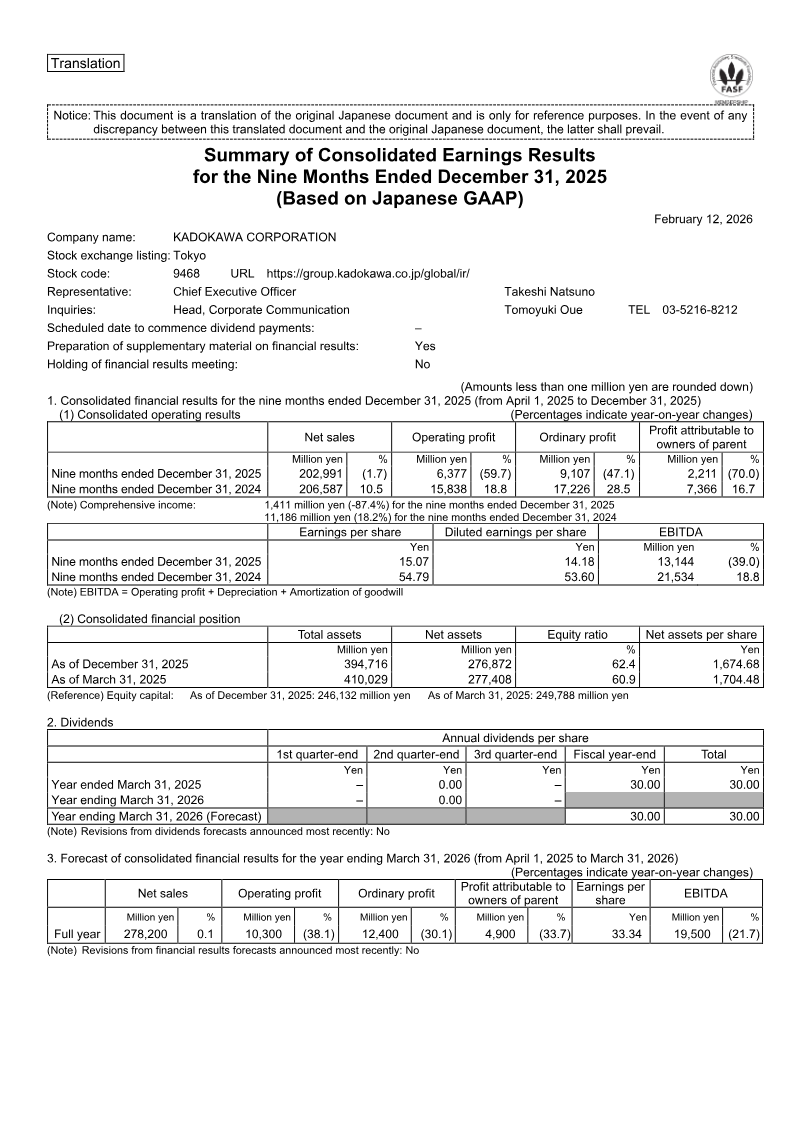
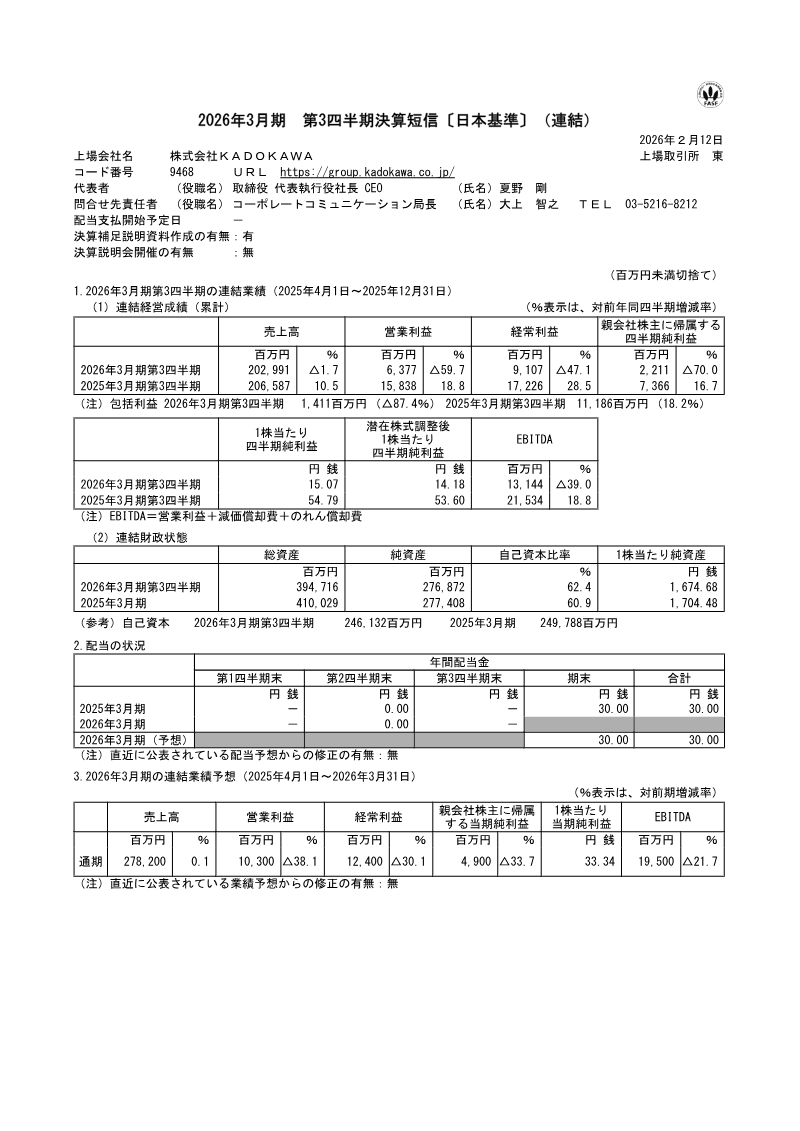
KADOKAWA CORPORATION experienced a difficult fiscal period for the nine months ending December 31, 2025, characterized by a 1.7 percent decline in net sales to 202,991 million yen and a substantial 59.7 percent drop in operating profit to 6,377 million yen. This contraction in profitability, which resulted in a 70.0 percent decrease in net income attributable to owners of the parent, stems from a lack of major hit titles across the Publication, Animation, and Gaming segments. While the Web Services and Education sectors demonstrated resilience through growth, these gains were insufficient to offset rising operational expenses and a 2,700 million yen impairment loss recorded within the Animation and Film division.
The company’s balance sheet reflects these pressures, with total assets contracting to 394,716 million yen as a result of debt repayment and reduced cash reserves. Despite these headwinds, management has opted to maintain its existing consolidated earnings forecasts for the full fiscal year ending March 31, 2026. This outlook suggests an expectation of stabilization or recovery in the final quarter, supported by ongoing strategic initiatives rather than immediate short-term gains.
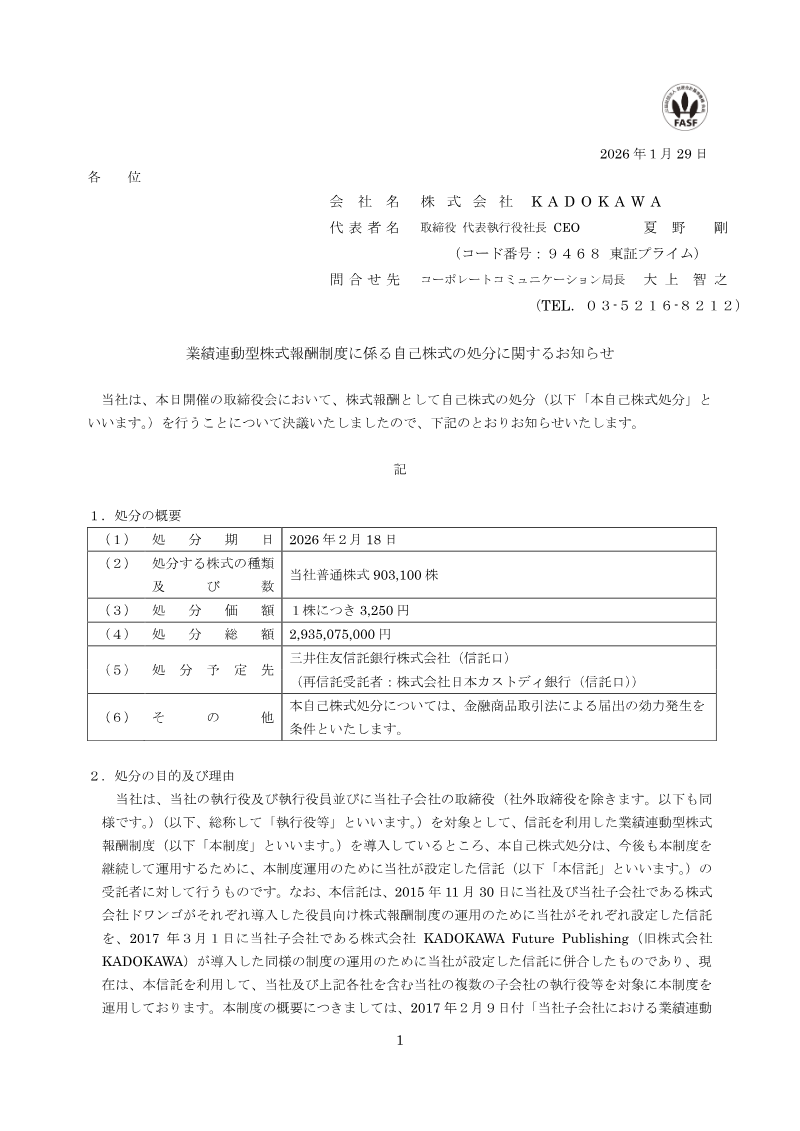
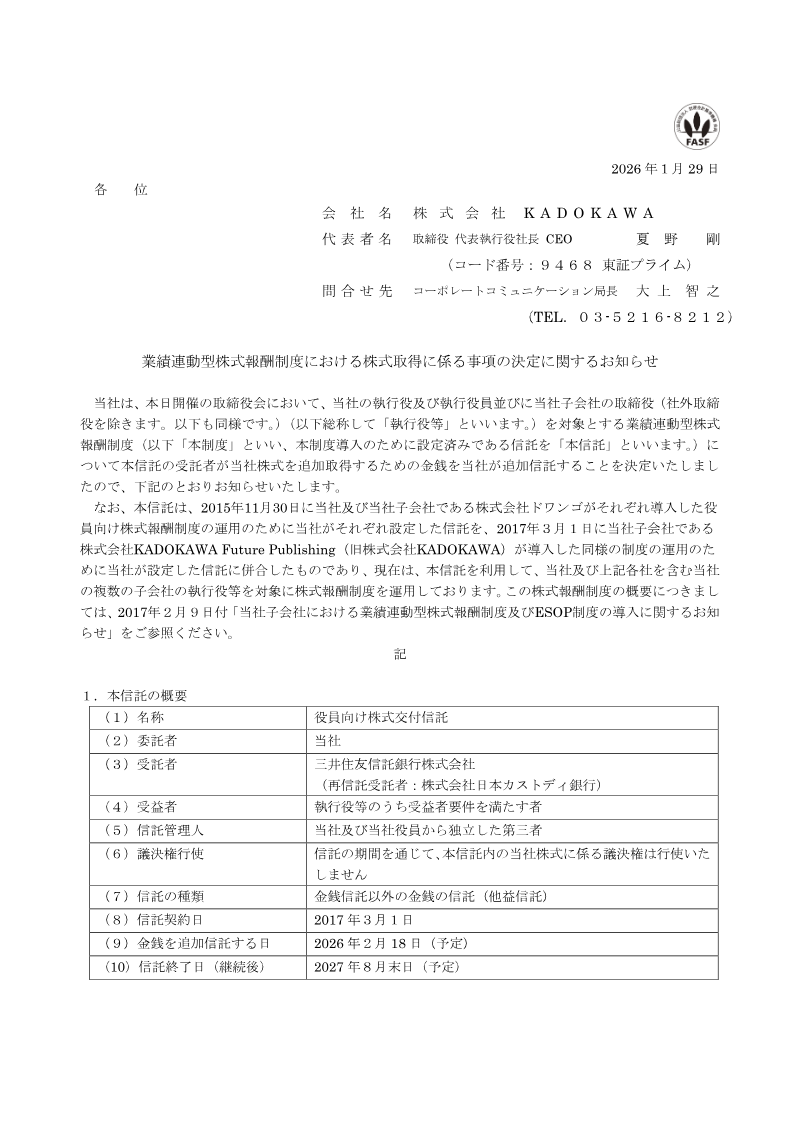
Strategic expansion remains a priority, evidenced by the acquisition of an 80 percent stake in the Singapore-based firm SOZO Pte. Ltd. for 2,299 million yen. This move is designed to bolster the company’s global media mix and secure a stronger foothold in the Southeast Asian entertainment market. Although the financial contributions of this new subsidiary were not reflected in the current nine-month results, the acquisition highlights a long-term commitment to international growth. Furthermore, the company is utilizing a performance-based stock compensation plan, involving the disposal of over 900,000 treasury shares in early 2026, to align internal incentives with future recovery efforts.

Kadokawa Corporation · 2026
Kadokawa Corporation · 2026
Kadokawa Corporation · 2026
Kadokawa Corporation · 2026
Kadokawa Corporation
Kadokawa Corporation
Kadokawa Corporation
Kadokawa Corporation
Kadokawa Corporation
Kadokawa Corporation
Kadokawa Corporation
Kadokawa Corporation
Capcom · 2026

Capcom Co. · 2026

Capcom · 2026

Sony Group Corporation · 2026
Marvelous · 2026
Square Enix · 2026
CyberAgent · 2026
Square Enix · 2026
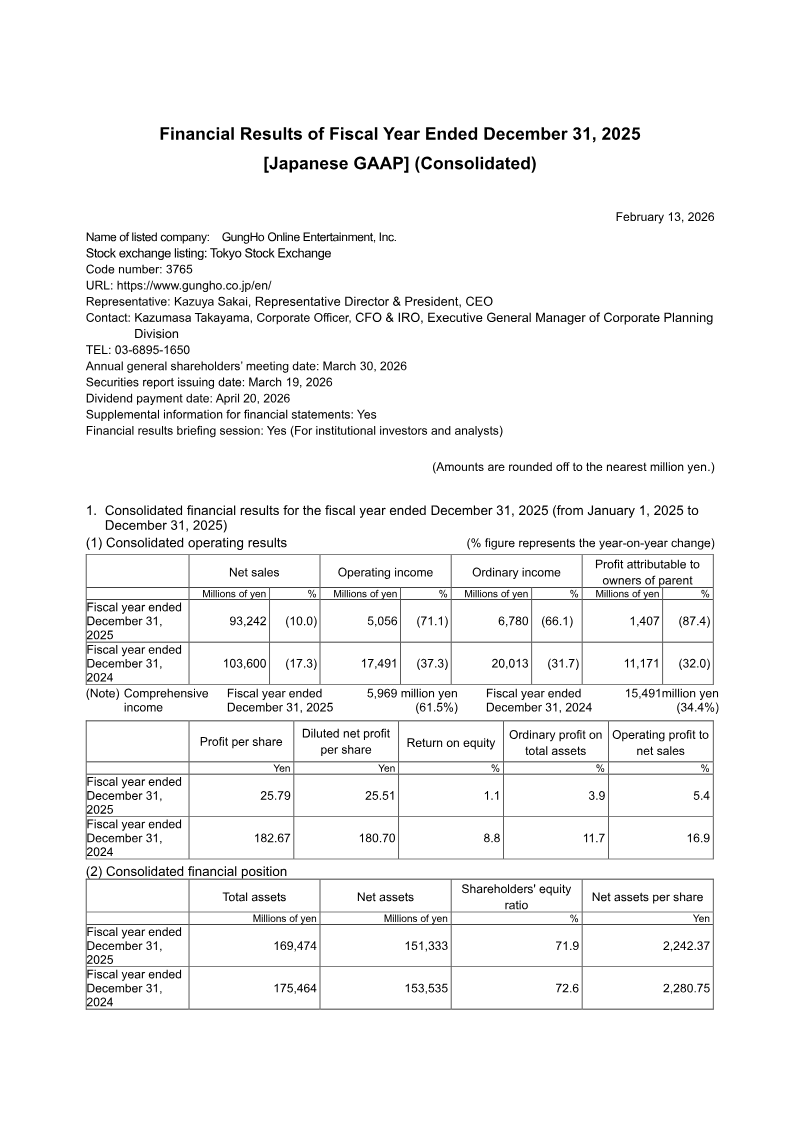
GungHo Online Entertainment · 2026
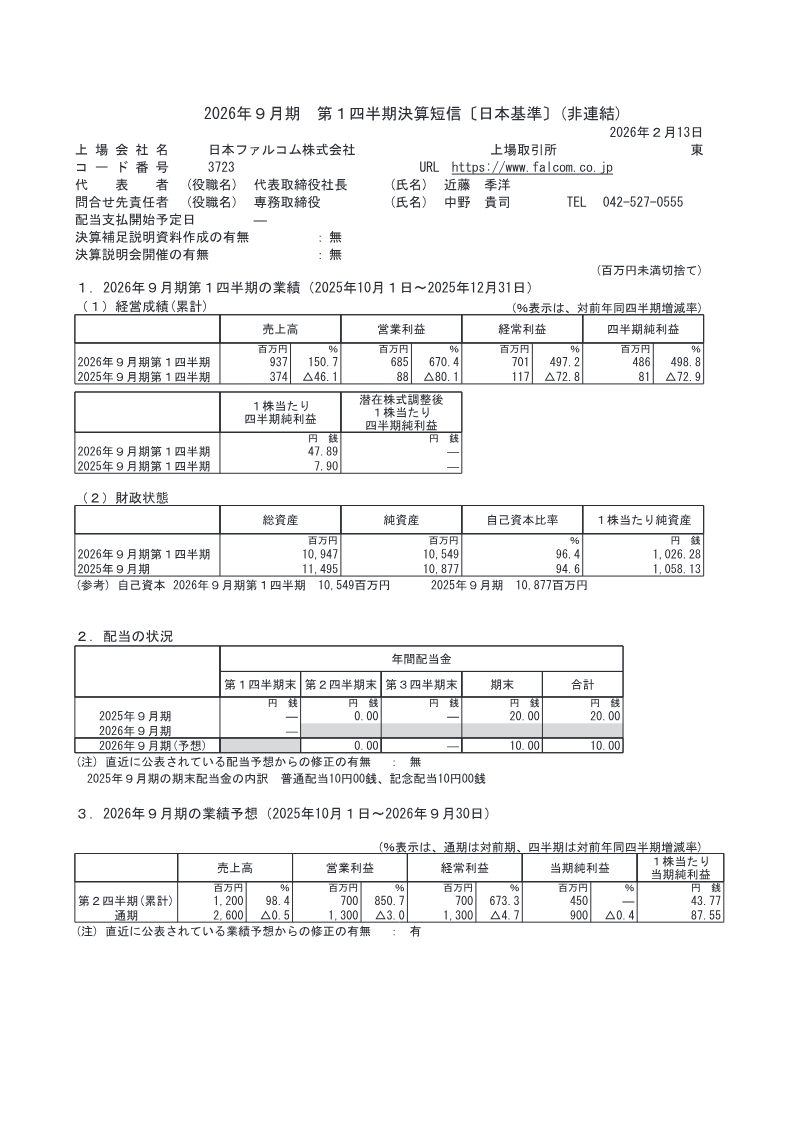
Nihon Falcom Corporation · 2026
Sega Sammy Holdings · 2026
Akatsuki · 2026