Marketing & User Acquisition
Campaigns, ad creatives, app store optimization and the cost of a player.
235 documents
Modern Times Group · 2009
ReportMTG Corporate Responsibility Report 2009
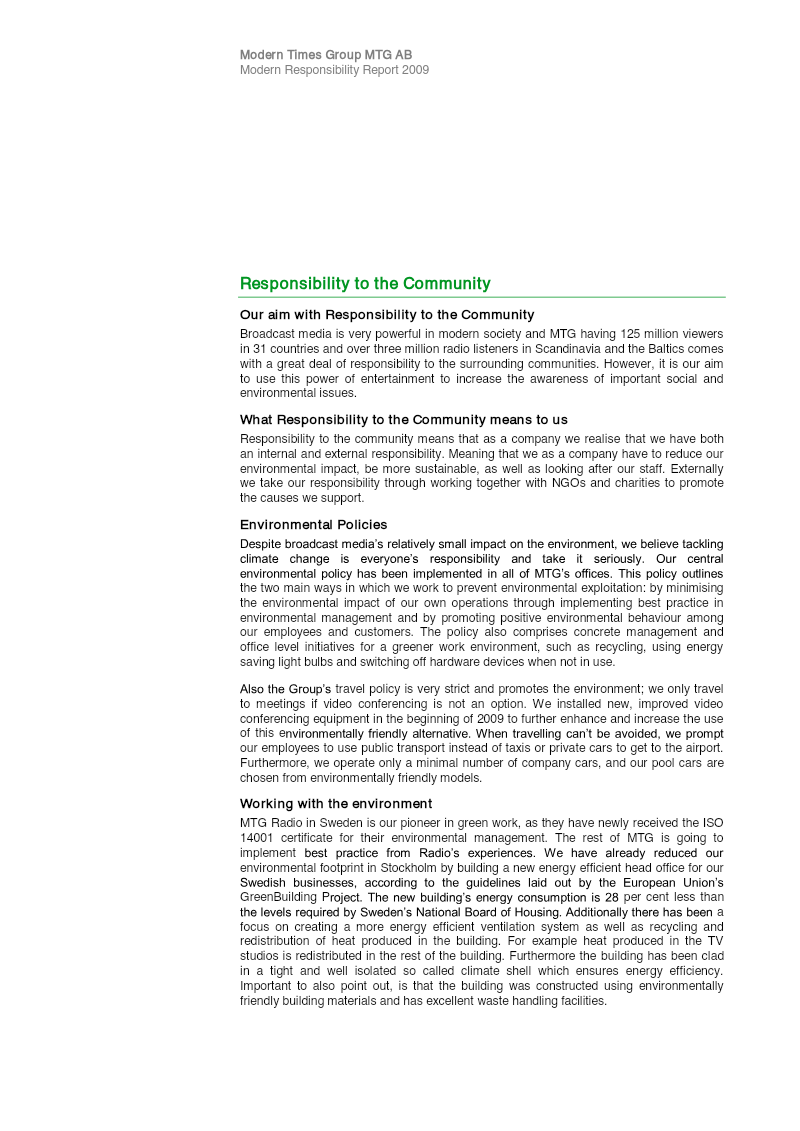
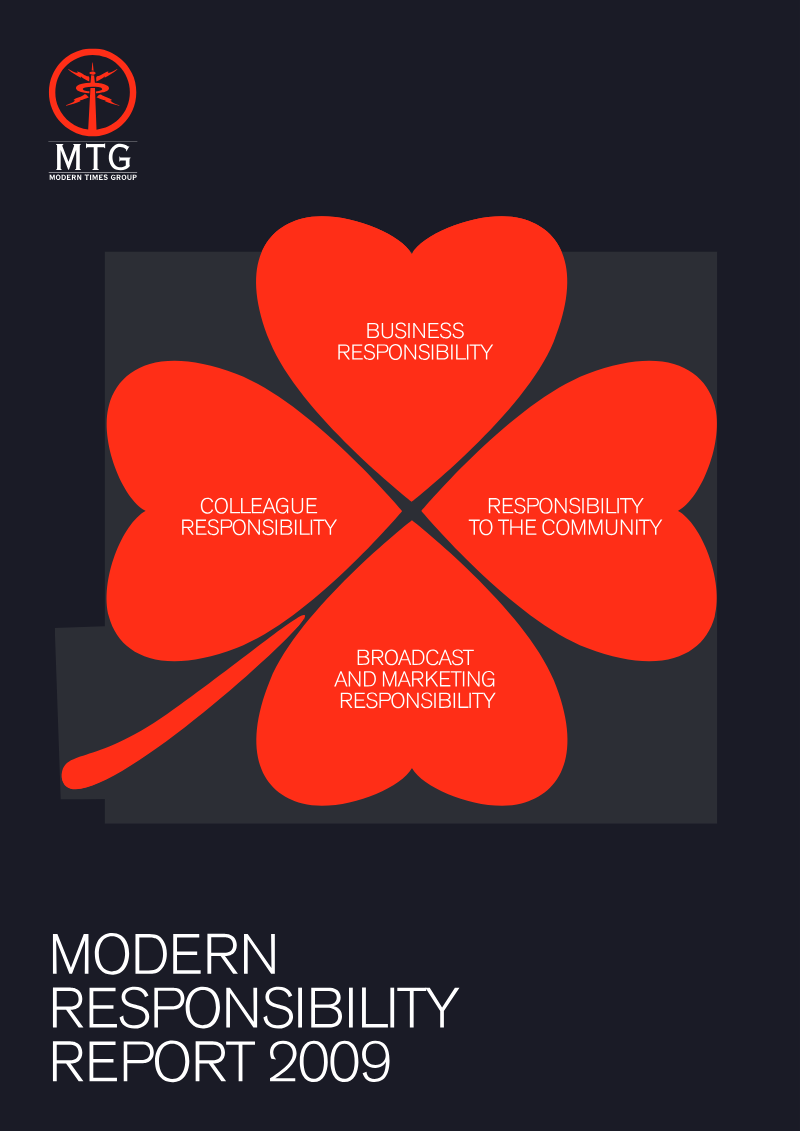
The 2009 Modern Responsibility Report presents Modern Times Group’s (MTG) effort to embed corporate responsibility across its broadcasting and media operations while navigating the aftermath of the 2008-09 financial crisis. The report’s thesis is that a structured, multi-pillar responsibility programme can coexist with commercial growth, even as the group expands its channel portfolio and geographic reach. In 2009 MTG recorded net sales of SEK 14.2 billion and launched three new channels—TV3 Puls, Prima COOL and Viasat Hockey—while completing a major restructuring of its Bulgarian assets. Despite revenue growth, operating income fell to a loss of SEK 1.4 billion and basic earnings per share turned negative at -30.86 SEK. The responsibility framework, introduced in 2004, is now governed by the CEO, board directors, a central committee and local “Green Ambassadors,” with KPIs, internal audits and external consultancy guiding progress. Targets for 2010 include broader KPI coverage, reduced carbon emissions and enhanced stakeholder communication across business, broadcast-marketing, colleague and community dimensions. Employee engagement proved strong: 86% of the 2,906 staff across 38 national markets completed the annual survey, 88% expressed enthusiasm for their work and 90% embraced the company’s three lead words. Gender balance approached parity overall (52% male, 48% female) though managerial levels remained skewed (63% male, 37% female). Internal recruitment accounted for 40% of hires. The carbon footprint for 2009 amounted to roughly 13 000 t CO₂e across 19 countries, split evenly between facilities and office-supply material use, with an intensity of 4.2 t CO₂e per employee (0.9 t per MSEK turnover). ISO 14001 certification for the Swedish radio division and energy-efficient headquarters illustrate concrete mitigation steps. Partnerships with WWF and Sweden’s BLICC, together with expanded carbon-footprint audits, underscore MTG’s commitment to environmental stewardship within the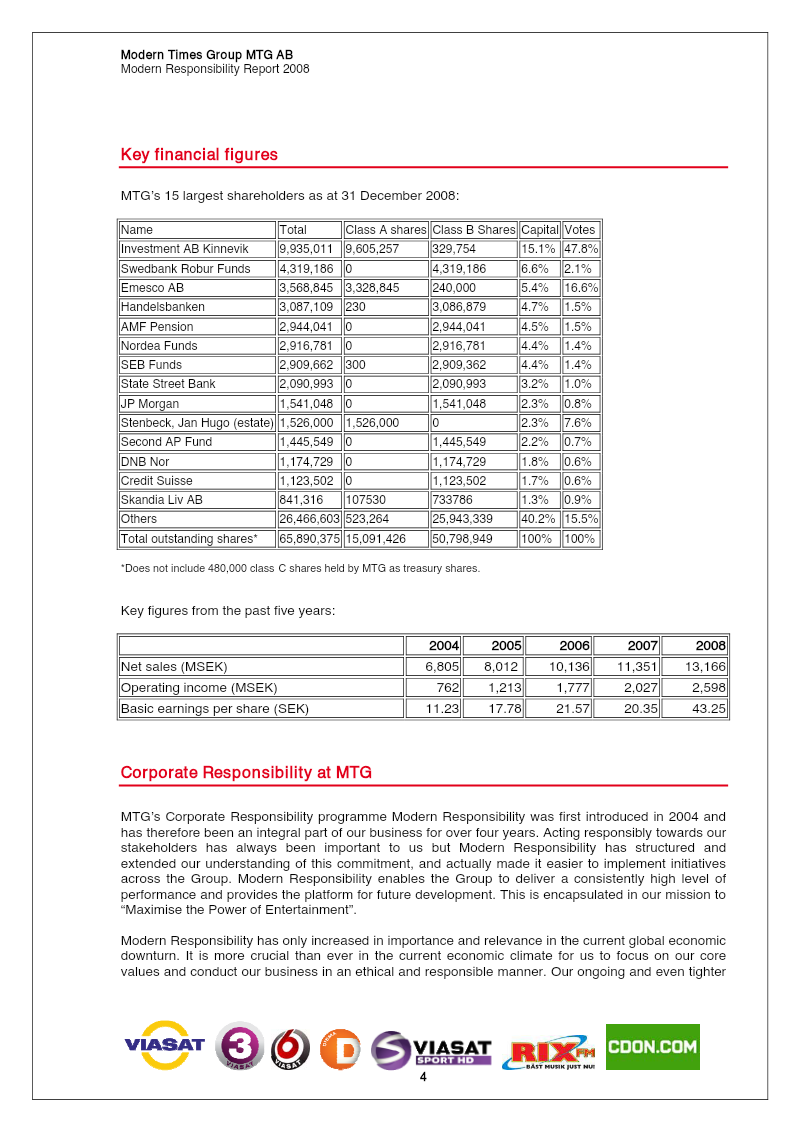
Modern Times Group · 2008
ReportMTG Corporate Responsibility Report 2008
Modern Times Group’s Modern Responsibility programme, launched in 2004, is presented as a strategic framework for leveraging entertainment to create social and environmental value across the company’s global operations. The initiative is positioned as core to MTG’s mission to “maximise the power of entertainment,” with responsibility articulated through five measurable pillars: community, environment, colleagues, broadcasting standards, and marketing. In 2008 the group reached 125 million viewers in 30 countries, operating 70 brands across television, radio, online retail and production. Financial performance showed net sales rising to SEK 13.2 billion and operating income to SEK 2.6 billion, while basic earnings per share more than doubled to SEK 43.25. Employee data indicate an average workforce of 2 810, with 35% female representation, a 22% turnover rate and 461 training days delivered to 46% of staff. Community engagement generated 78 million SEK of donated airtime and raised 56 million SEK for charities, while environmental actions reduced office energy use by 28% relative to national standards and produced a total carbon footprint of 4 223 tonnes CO₂ (3.0 t per employee), calculated under the Greenhouse Gas Protocol with external verification. Stakeholder governance is overseen by senior management, a dedicated coordinator and a Modern Responsibility Committee, supported by local ambassadors in each market. Reporting draws on internal data, carbon accounting from Tricorona Climate Partner, and regular stakeholder feedback through surveys and focus groups. The 2008 snapshot underscores MTG’s expanding footprint, its commitment to ethical broadcasting, and its ambition to deepen responsibility reporting in subsequent years.

Korea Creative Content Agency
ReportKorea's Game Exports: Reading Beyond the Aggregate Numbers
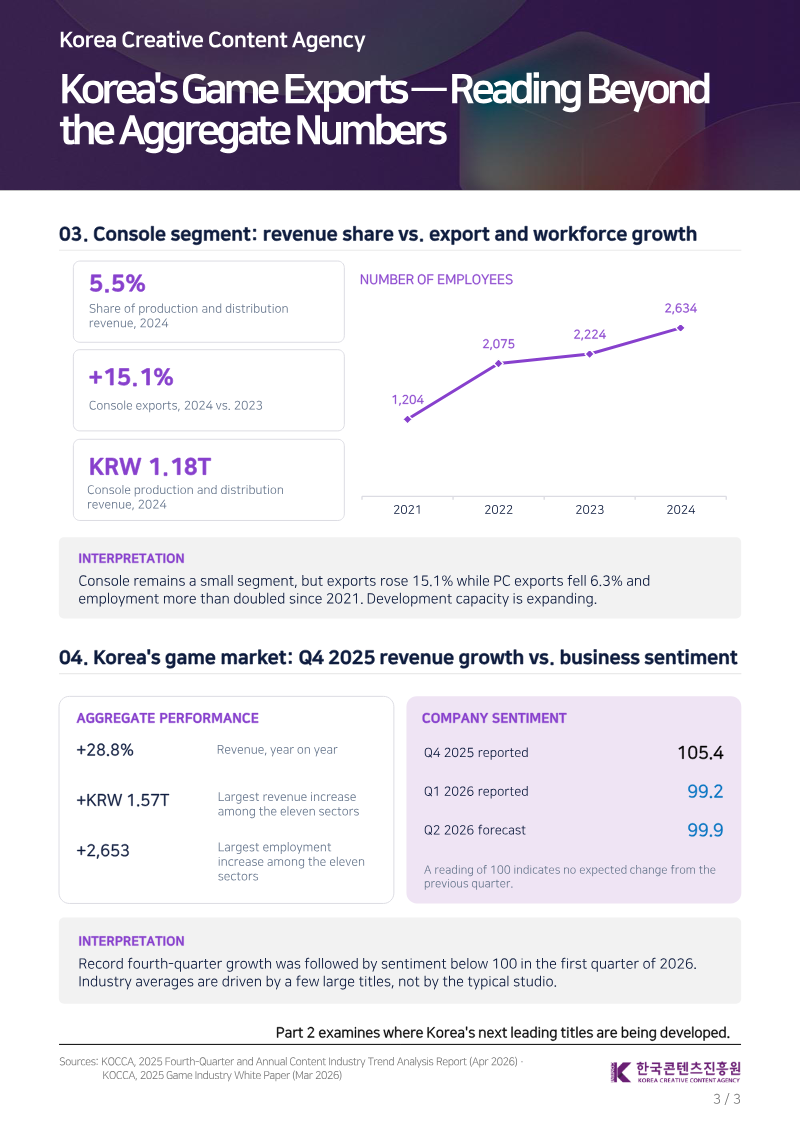
The South Korean game industry serves as the nation’s primary content export engine, generating an estimated USD 8.60 billion in 2025 and accounting for 57.7% of total content export value. While Korea ranks as the world’s fourth-largest game market, it maintains a unique position with a high concentration index and per-capita spending approximately eleven times the global average. Despite these strong aggregate figures, growth remains heavily skewed toward a small number of high-performing titles rather than reflecting broad-based success across the entire studio ecosystem. Market dynamics shifted significantly in 2024, characterized by a 1.3% rise in total export value and a notable geographic realignment. North America emerged as a growing destination, gaining 4.7 percentage points in export share, while Japan experienced a 5.4 percentage point decline. Platform trends also show internal divergence; while mobile remains the dominant revenue driver at USD 5.51 billion, the console segment is experiencing rapid expansion. Console exports grew by 15.1% in 2024, and the associated workforce has more than doubled since 2021, signaling a strategic pivot in development capacity. Data for these findings are derived from the 2025 Game Industry White Paper and the 2025 Fourth-Quarter Content Industry Trend Analysis Report, which utilize surveys of domestic production and distribution companies. Although the industry reported record revenue growth in the fourth quarter of 2025, business sentiment for early 2026 remains cautious, hovering slightly below the neutral threshold. Consequently, stakeholders are advised to look beyond industry-wide aggregates and evaluate individual studios and specific titles to accurately identify growth opportunities within the evolving Korean market.

Sensor Tower
ReportQ3 2015 Data Digest
The Q3 2015 Data Digest provides a comprehensive analysis of the iOS mobile application market, focusing on global and U.S. trends in downloads, revenue, and advertising strategies. The primary objective is to equip developers with actionable marketplace intelligence to optimize growth and monetization. The analysis utilizes proprietary Store Intelligence and Ad Intelligence data, benchmarking performance against top-tier apps to provide a clear comparative landscape of the mobile ecosystem during the third quarter of 2015. Key findings indicate that the gaming category remains the dominant force in the App Store, accounting for the highest volume of downloads and generating revenue more than 20 times greater than the next leading category. While Clash of Clans maintained its lead, Game of War demonstrated significant momentum, narrowing the revenue gap in the U.S. market. The data also highlights a strong correlation between aggressive advertising on the Facebook network and revenue performance, with gaming and lifestyle apps—specifically those from ContextLogic—leveraging high-production image and video advertisements to drive user acquisition. Geographically, the report identifies Japan as a high-value market, contributing a disproportionate number of top-grossing publishers relative to their download volume. Furthermore, the analysis reveals that while iPhone remains the primary driver for total downloads, the iPad serves as a critical platform for high-revenue entertainment and gaming consumption. The industry experienced a rebound in Q3 following a Q2 slump, with the travel category showing the most significant growth. Ultimately, the findings underscore a shift toward sophisticated monetization, particularly within music and gaming apps, which successfully increased revenue despite varying download trends.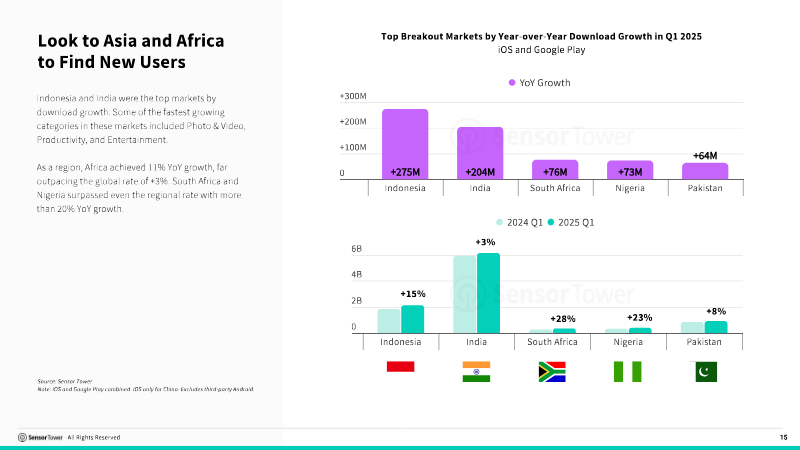
Sensor Tower
ReportDigital Market Index: Q1 2025
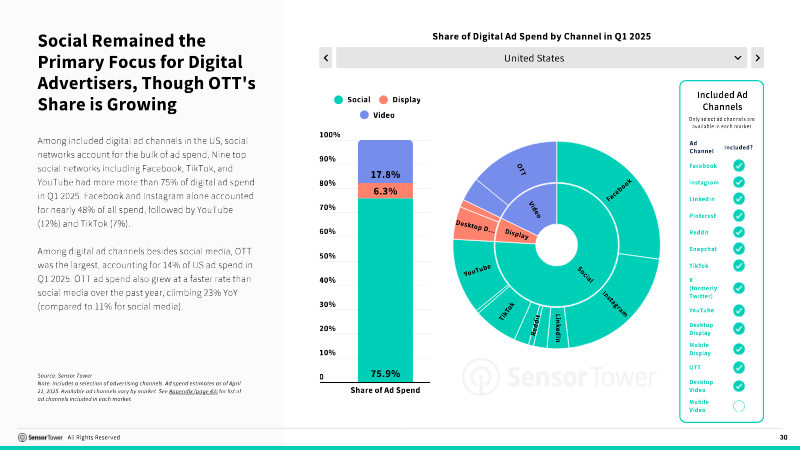
The global digital economy experienced a transformative first quarter in 2025, characterized by a shift in revenue dominance toward non-gaming applications and a strategic pivot in advertising priorities. Total in-app purchase revenue climbed to a record $40 billion, representing an 11% year-over-year increase. While mobile gaming remains a foundational pillar of the digital ecosystem, the sector is currently defined by stability rather than expansion, as established titles continue to outperform new releases. Strategy games have successfully overtaken RPGs as the leading revenue-generating genre, even as overall game downloads experienced a marginal contraction of 2.5%. The advertising landscape, particularly within the United States, reflects a broader realignment of capital toward high-growth sectors. Total digital ad spend reached $31 billion, with social media maintaining its status as the primary channel. However, the composition of this spend has shifted significantly; retail-focused advertising has cooled as major players prioritize international expansion, while financial services experienced a 43% surge driven by tax season activity and renewed interest in cryptocurrency. Simultaneously, the rise of generative AI continues to act as a primary catalyst for growth in productivity and creative application downloads. Retail media has solidified its role as a critical marketing infrastructure, with impressions rising 31% year-over-year. Platforms such as Walmart and Chewy have emerged as leaders in this space, with the food and beverage sector proving particularly effective at leveraging co-branded advertising. As the industry moves further into 2025, the data suggests a maturing market where growth is increasingly driven by specialized financial services, the integration of generative AI, and the strategic optimization of existing, high-performing digital assets rather than reliance on new user acquisition.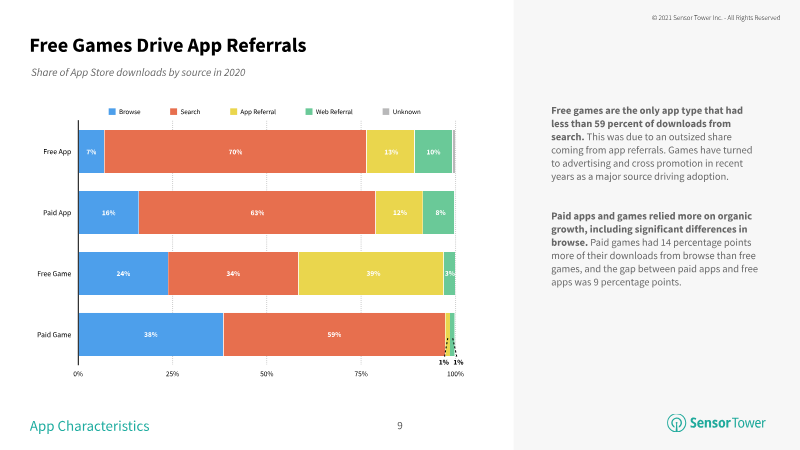
Sensor Tower
ReportAn Analysis of Download Sources on Apple's App Store 2021
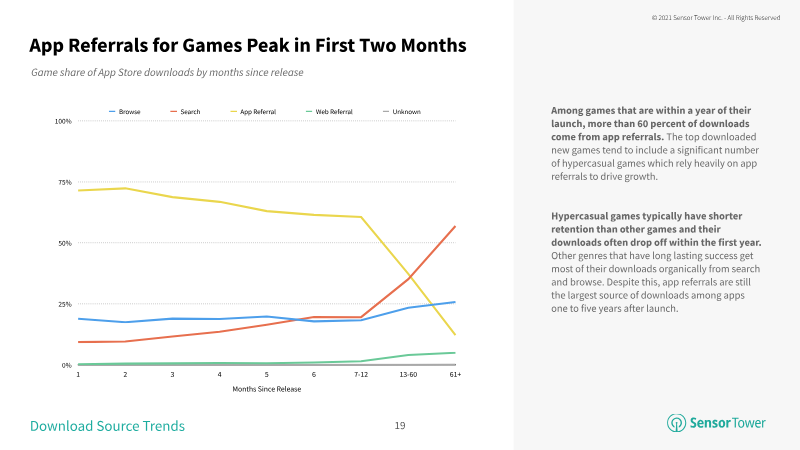
This analysis examines the primary drivers of first-time app downloads on the Apple App Store between 2018 and 2020. The study categorizes download sources into four main channels: search, browse, app referrals, and web referrals. By analyzing a sample of apps—comprising 54% games and 46% non-game applications—the research highlights how user acquisition strategies differ significantly based on app category, monetization model, and the time elapsed since an app’s initial launch. The findings indicate that search remains the dominant discovery mechanism, accounting for 59% of all App Store downloads in 2020. While non-game apps rely heavily on search—reaching 70% of their total downloads—the gaming sector shows a distinct trend toward app referrals. Specifically, the share of game downloads originating from app referrals grew from 26% in 2018 to 38% in 2020. This shift is largely attributed to the rise of the hypercasual game genre, which accounted for 63% of its own installs via app referrals in 2020, utilizing in-app advertising and cross-promotion as primary growth levers. The data further reveals that download sources evolve over an app's lifecycle. App referrals are most critical within the first six months of a launch, particularly for games. However, as apps mature beyond one year, search becomes the primary driver of new user acquisition. This suggests that while paid advertising and cross-promotion are essential for initial visibility and the hypercasual market, organic discovery through search is the most sustainable source of growth for long-term, established applications. The report concludes that while market conditions, such as the COVID-19 pandemic, can cause temporary fluctuations in these trends, the fundamental reliance on search for non-games and the increasing importance of referrals for games remain the defining characteristics of the current mobile ecosystem.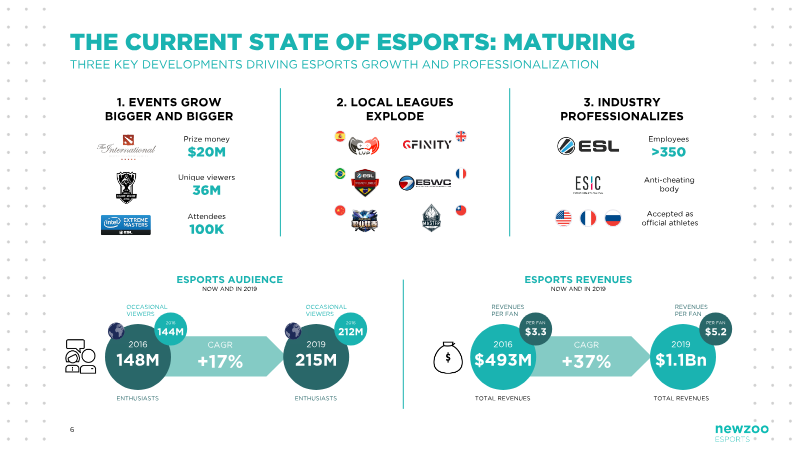

Newzoo
ReportWhy Sports and Brands Want to Be in Esports
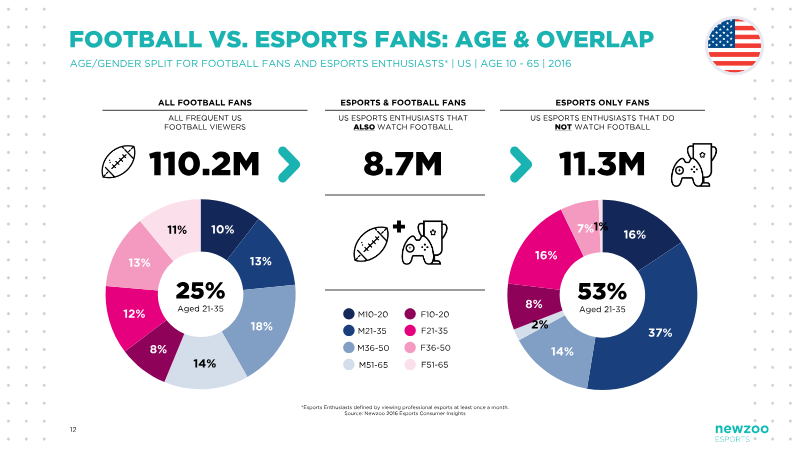
This analysis explores the strategic motivations behind the increasing integration of traditional sports organizations and global consumer brands into the esports ecosystem. The primary thesis posits that esports offers a unique, high-growth channel to engage a young, digital-native demographic that is increasingly difficult to reach through conventional media. By leveraging data from over 60,000 respondents across 27 countries, the research highlights how games have evolved into a global spectator sport, characterized by a professionalizing industry and a rapidly expanding audience. Key findings indicate that esports is achieving parity with traditional sports in terms of popularity among male millennials. In the United States, 22% of men aged 21 to 35 watch esports, a figure comparable to baseball and ice hockey viewership. Furthermore, the industry is experiencing significant financial maturation, with total revenues projected to reach $1.1 billion by 2019, representing a 37% compound annual growth rate. The data suggests that esports enthusiasts are distinct from traditional sports fans, often exhibiting higher digital engagement, such as increased usage of platforms like Twitch and Instagram, and a stronger affinity for specific technology brands. The scope of this research encompasses a global perspective, covering markets across the Americas, Europe, and Asia-Pacific. The methodology relies on extensive consumer insights, utilizing over 200 variables to profile target demographics, media behaviors, and gaming habits. By matching these insights with specific brand segmentations, the analysis provides a framework for stakeholders to quantify the value of esports involvement. Ultimately, the professionalization of leagues, the growth of large-scale events, and the influx of investment from traditional sports franchises underscore the transition of esports from a niche hobby to a multibillion-dollar pillar of the global entertainment economy.
Newzoo
ReportUnderstanding the iPhone: Current Usage and Trends
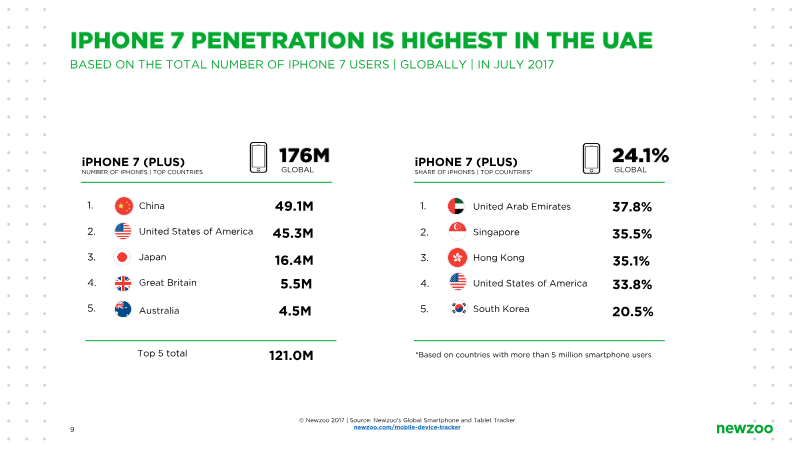
As of July 2017, the global landscape of iPhone usage reflects a decade of significant market penetration, with 730 million active devices worldwide. This figure represents approximately one-tenth of the global population. Over the ten-year period following the product's 2007 launch, Apple maintained a consistent sales velocity, averaging 323,000 units sold daily. Data indicates that 61% of all iPhones ever sold remain in active use, with a strong concentration of newer hardware; 82% of currently active devices were released in 2014 or later, underscoring a rapid upgrade cycle among the user base. Geographically, China leads the world in iPhone adoption with 243 million active users. The United States follows as a major market, while the United Arab Emirates, Singapore, and Hong Kong exhibit the highest penetration rates for the iPhone 7 series. Market trends reveal a clear consumer preference for larger screen sizes, as evidenced by the iPhone 7 Plus surpassing the iPhone 6 Plus in total active units by mid-2017. Furthermore, the ecosystem demonstrates high software engagement, with 88% of all active iOS devices running iOS 10 by July 2017. These insights are derived from the Global Smartphone and Tablet Tracker, a proprietary intelligence platform that monitors device usage, brand performance, and operating system adoption across 100 countries. By analyzing monthly device activity, the findings highlight the shifting dynamics of mobile hardware, specifically the transition toward newer, larger-screen models and the sustained loyalty of the global Apple user base. This analysis serves to quantify the scale of Apple’s influence on the mobile market and provides a benchmark for understanding consumer behavior in the smartphone sector.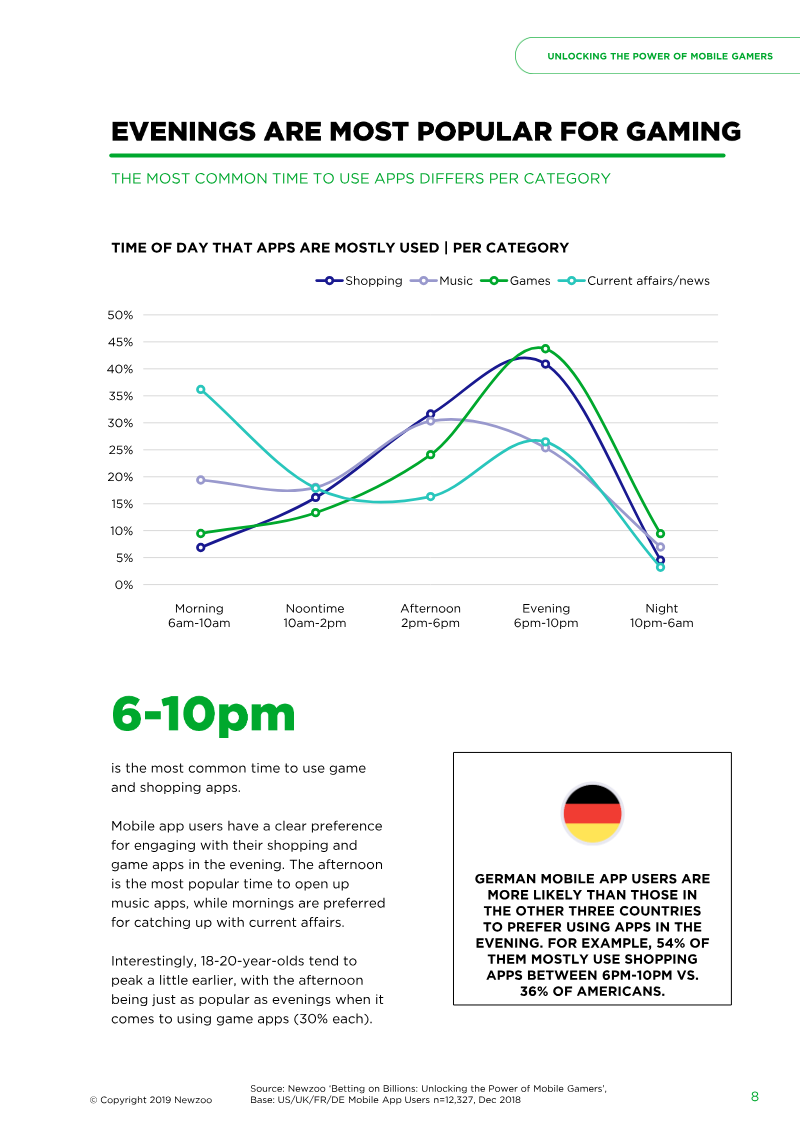

Newzoo
ReportBetting on Billions: Unlocking the Power of Mobile Gamers
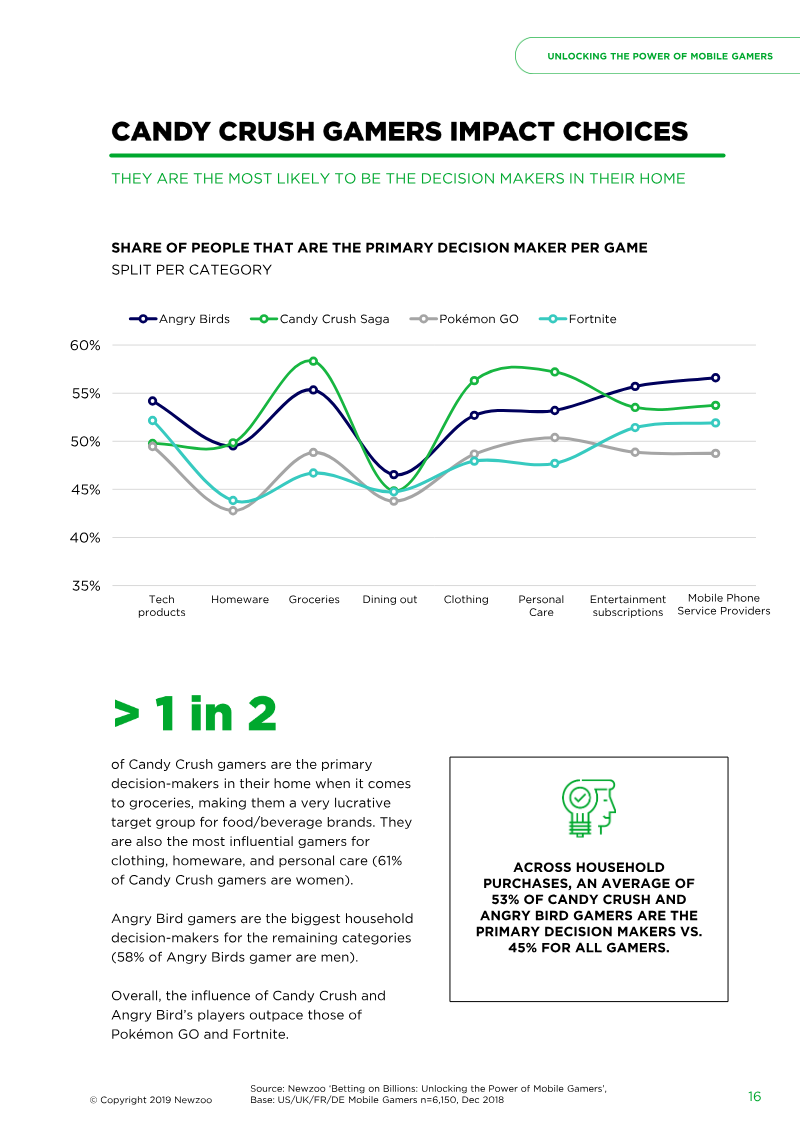
Mobile gaming represents a significant, underutilized opportunity for brands to engage a vast and influential consumer base. The primary thesis is that mobile gamers are not only a massive demographic but also possess higher purchasing influence and greater receptivity to advertising than non-gamers. By leveraging the diverse gaming landscape, brands can move beyond outdated stereotypes to reach a highly engaged audience that mirrors the broader population in terms of gender and age, while offering specific targeting potential through varied game genres. The research, conducted in late 2018, surveyed 12,327 mobile app users across the U.S., U.K., Germany, and France. Findings indicate that gaming is the third-most-popular app category, with 50% of users engaging with games weekly. Notably, mobile gamers are 23% more likely than non-gamers to influence the purchasing decisions of friends, family, and colleagues. This influence is highly segmented: female gamers often drive decisions regarding groceries and clothing, while male gamers exert more influence over technology and automotive purchases. Furthermore, gamers demonstrate a higher propensity for "splurging" and show a stronger preference for premium brands compared to non-gamers. The data also highlights that mobile gamers are more receptive to advertising, with 53% agreeing that ads help them stay informed about products and services. Because gaming apps see peak usage in the evenings, they provide a prime environment for contextual marketing. The report concludes that brands should adopt a strategic approach by aligning their messaging with specific game genres—such as puzzle games for older, female-skewing demographics or action titles for younger males—and emphasizing corporate values, which resonate strongly with this audience. By integrating these insights, brands can effectively capture the attention of a diverse, high-value consumer segment.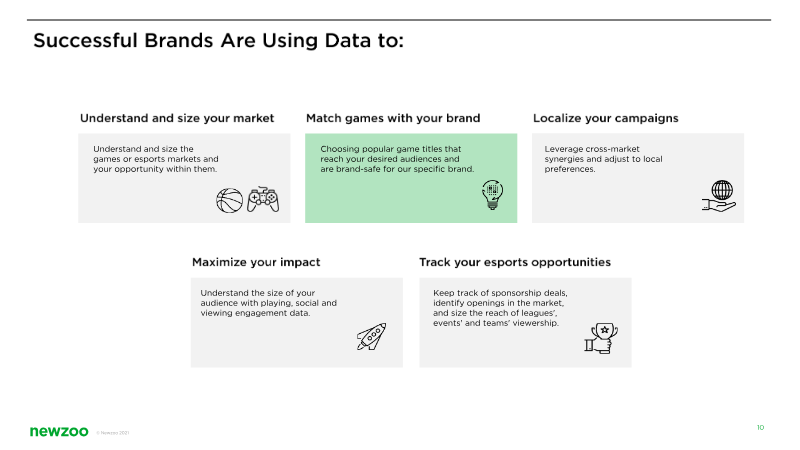
Newzoo
ReportHow Brands Can Use Data to Be Successful in Games & Esports
Brands must move beyond viewing gamers as a monolithic group, instead adopting data-driven, segmented strategies to navigate the complex gaming and esports landscape. Because the gaming audience is diverse and gender-balanced, success requires precise market sizing and the identification of specific titles that align with target demographics. By utilizing granular consumer insights and regional performance data, companies can ensure brand safety while localizing campaigns to resonate with unique cultural and interest-based preferences that traditional media often fails to capture. Effective engagement in this ecosystem extends beyond simple player counts. Brands should analyze multi-platform metrics, including viewership trends and social sentiment, to identify authentic partnership opportunities with professional teams and influencers. This analytical approach allows organizations to track competitor activity, measure the tangible impact of sponsorships, and refine their strategies in real time. By integrating syndicated consumer data, brands can transition from initial market exploration to high-impact activation, ensuring that investments are backed by empirical evidence rather than speculation. This strategic framework covers the global gaming market, providing a roadmap for brands to maximize engagement across various industry segments. By treating gaming as a sophisticated, data-rich environment, major global corporations can successfully integrate into the space, fostering long-term growth and relevance. Ultimately, the ability to synthesize complex behavioral data into actionable insights is the primary driver for brands seeking to capture the attention of younger, highly engaged audiences in an increasingly digital-first world.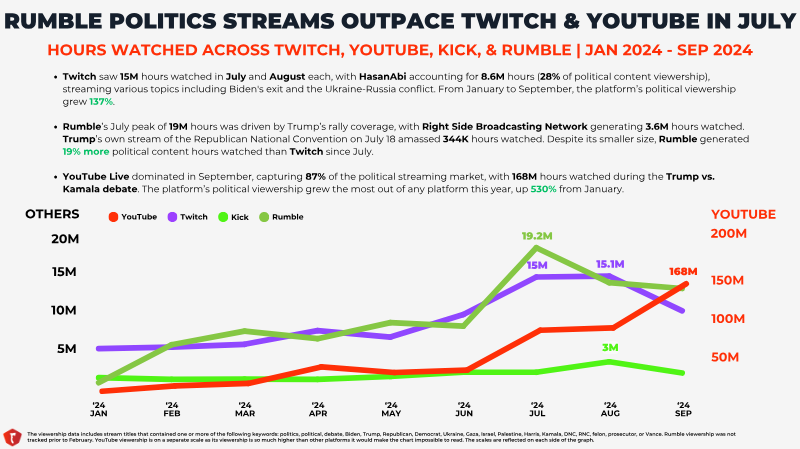

Stream Hatchet
ReportPolitics in Live Streaming: 2024
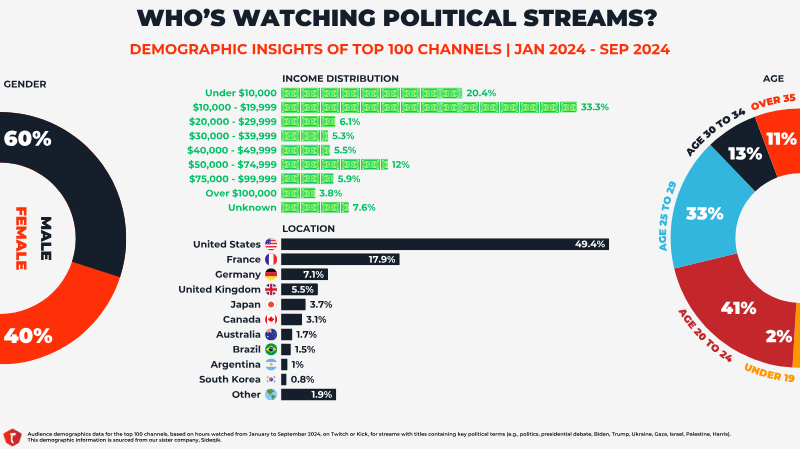
Live streaming has emerged as a critical venue for political discourse, effectively rivaling traditional media in its capacity to engage younger, tech-savvy audiences in real time. This analysis examines the intersection of politics and live streaming across major platforms—including Twitch, YouTube, Kick, and Rumble—from January 2023 through September 2024. The findings indicate that political content is a rapidly growing segment of the live-streaming ecosystem, with the market share of political streams increasing from 0.8% to nearly 3% over the first nine months of 2024. Data reveals a significant surge in political engagement during major 2024 events, such as the U.S. presidential campaign announcements and the September debate between Donald Trump and Kamala Harris. YouTube Live has established itself as the dominant platform for this content, capturing 87% of the political streaming market in September 2024 and experiencing a 530% increase in political viewership since January. While Rumble maintains the highest concentration of political content relative to its total viewership at 32%, Twitch and Kick have also seen substantial growth in political engagement. The analysis also highlights potential irregularities in viewership data, specifically identifying a subset of YouTube channels that exhibited suspicious behavior, such as rapid name changes or deletion following broadcasts related to the 2024 U.S. election. These compromised channels accounted for approximately 35% of the hours watched for streams mentioning the presidential candidates in Q3 2024. Despite these anomalies, the data confirms that live-streaming audiences are highly responsive to political developments, with chat sentiment and engagement metrics providing a granular view of public reaction to candidates and policy issues. Ultimately, the shift toward live-streamed news consumption reflects a broader transformation in how global audiences interact with and participate in contemporary political events.


Stream Hatchet
Report