Marketing & User Acquisition
Campaigns, ad creatives, app store optimization and the cost of a player.
232 documents
AppsFlyer · 2021
ReportThe African Mobile Apps Landscape (2021)
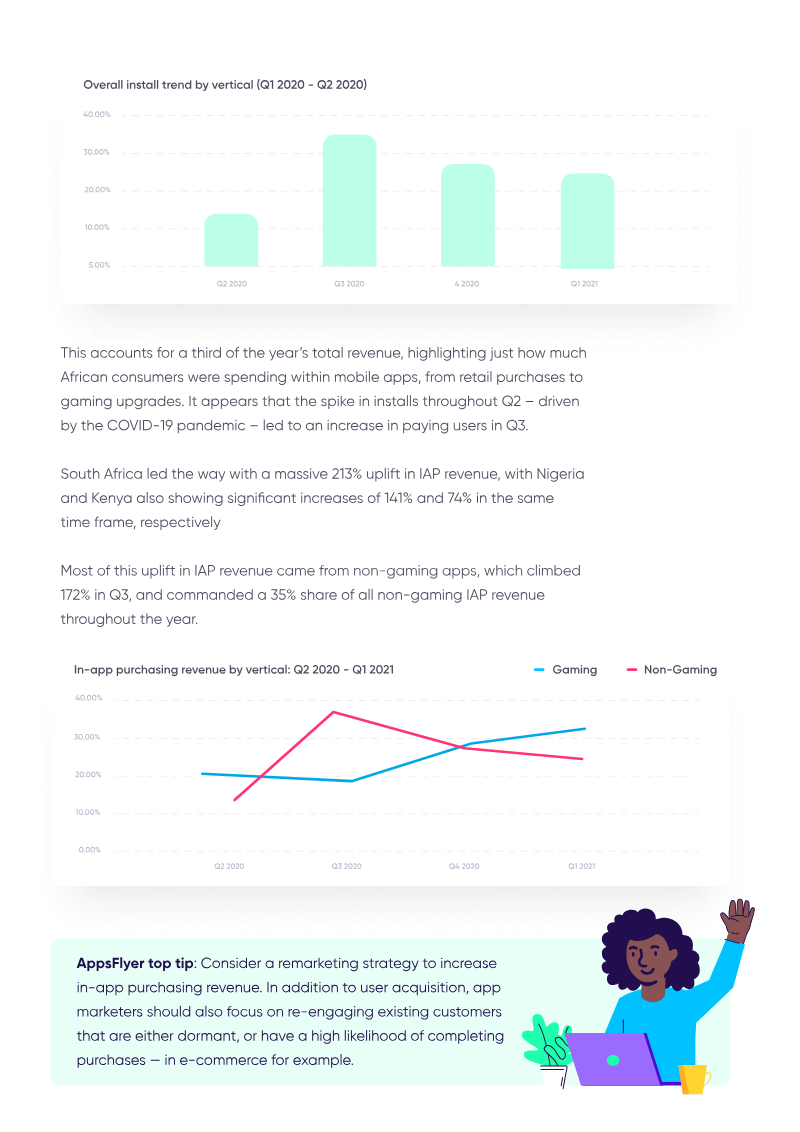
The African mobile app market experienced a period of rapid acceleration between Q1 2020 and Q1 2021, driven by a young, mobile-first population and the unique conditions of the COVID-19 pandemic. Analysis of 6,000 apps and 2 billion installs across South Africa, Nigeria, and Kenya reveals that overall app installs grew by 41% during this period. Nigeria led this growth with a 43% increase, while South Africa saw the most immediate surge in downloads following strict lockdown measures. The gaming sector proved particularly resilient, with installs jumping 50% in Q2 2020 as consumers sought home entertainment. This trend extended to monetization, as in-app advertising revenue surged by 167% between Q2 2020 and Q1 2021. Furthermore, in-app purchasing revenue peaked in Q3 2020, accounting for one-third of the year's total revenue. While Android remains the dominant platform with a 54% increase in non-organic installs, iOS also showed growth despite a 21% rise in cost-per-install. Several structural trends define the current landscape, including the rise of fintech apps addressing the needs of unbanked populations and the emergence of super apps that consolidate multiple services to overcome device storage limitations. Despite this progress, challenges remain regarding connectivity, as mobile internet adoption in Sub-Saharan Africa stands at 26%, well below the global average. To succeed, marketers are encouraged to move toward a multi-moment maturity model by integrating durable measurement foundations, focusing on high-value user acquisition, and utilizing remarketing strategies to drive long-term engagement.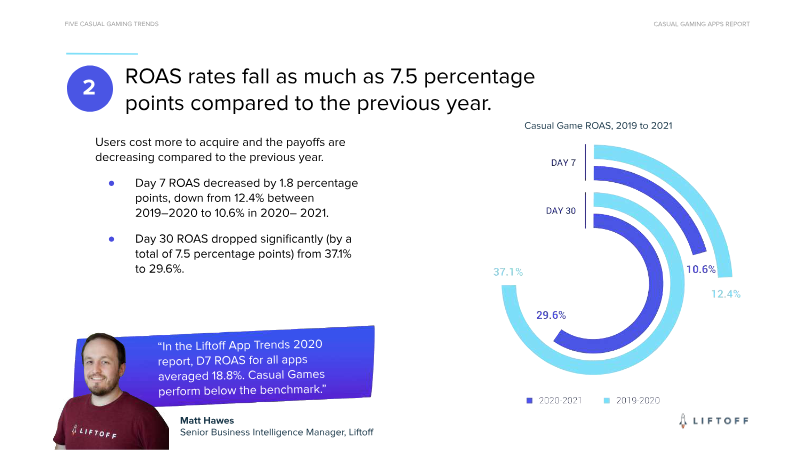
Liftoff · 2021
ReportCasual Gaming Apps Report: The State of Play in 2021
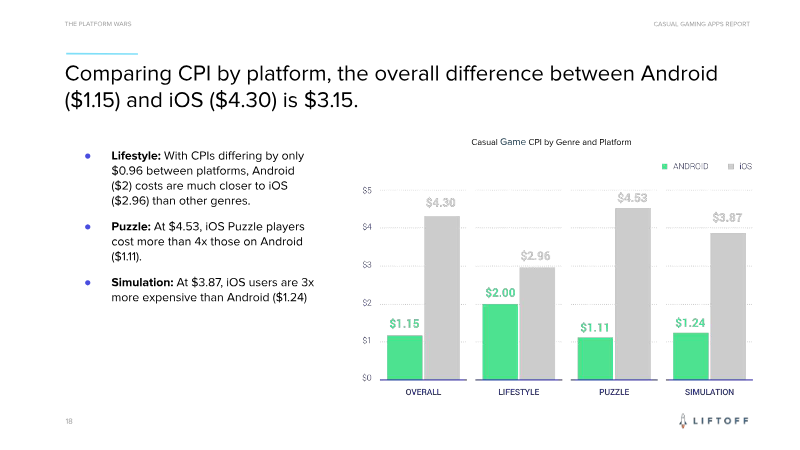
The casual gaming sector experienced significant growth and volatility between March 2020 and February 2021, driven largely by shifting consumer habits during the COVID-19 pandemic. While mobile gaming spend surged to nearly triple that of PC and console platforms, the market became increasingly competitive. Analysis of 246 million installs across 416 apps reveals that while the audience for casual titles is massive, the cost to acquire these users has risen sharply. The average cost-per-install (CPI) for casual games increased by 45.2% year-over-year to $1.96, while return-on-ad-spend (ROAS) saw a corresponding decline, dropping 7.5 percentage points to 29.6% by Day 30. Market dynamics vary significantly by sub-genre and platform. Lifestyle games emerged as the most expensive to acquire at $2.57 per install but offered the highest engagement, yielding a Day 7 ROAS of 22.5%, which far outperforms Puzzle and Simulation categories. Platform trends indicate a strategic shift toward Android, where CPIs surged by 120% as marketers prepared for privacy changes on iOS. Despite this, iOS remains the more expensive platform, with an average CPI of $4.30 compared to $1.15 on Android. Geographically, North America remains the most expensive region for user acquisition, while APAC and EMEA offer more cost-effective opportunities. Countries such as France, Germany, and South Korea are highlighted as high-performance markets with relatively low CPIs and strong ROAS. To combat rising costs and diminishing returns, the findings suggest a heavy reliance on creative experimentation, particularly through playable ads, which saw a 113% increase in usage. The data indicates that success in the current landscape requires balancing localized strategies with high-engagement ad formats to convert increasingly distracted global audiences.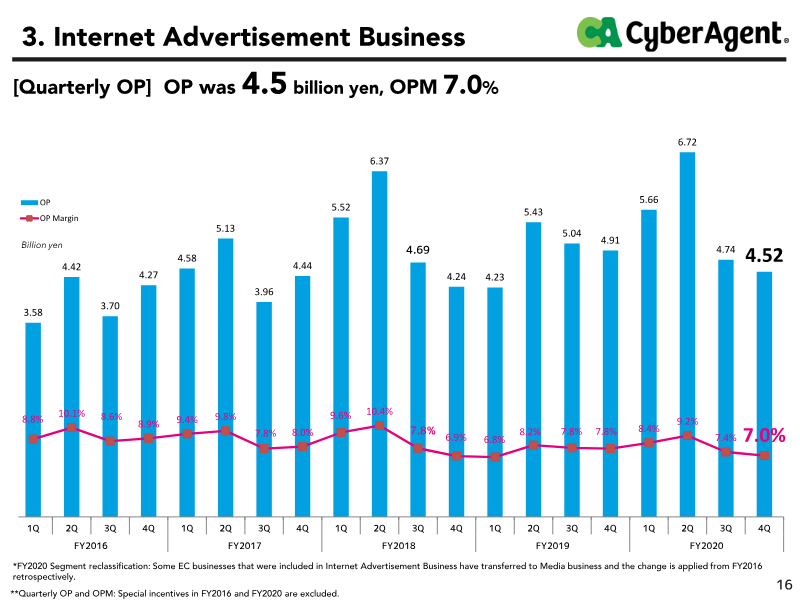

CyberAgent · 2020
PresentationFY2020 Presentation Material
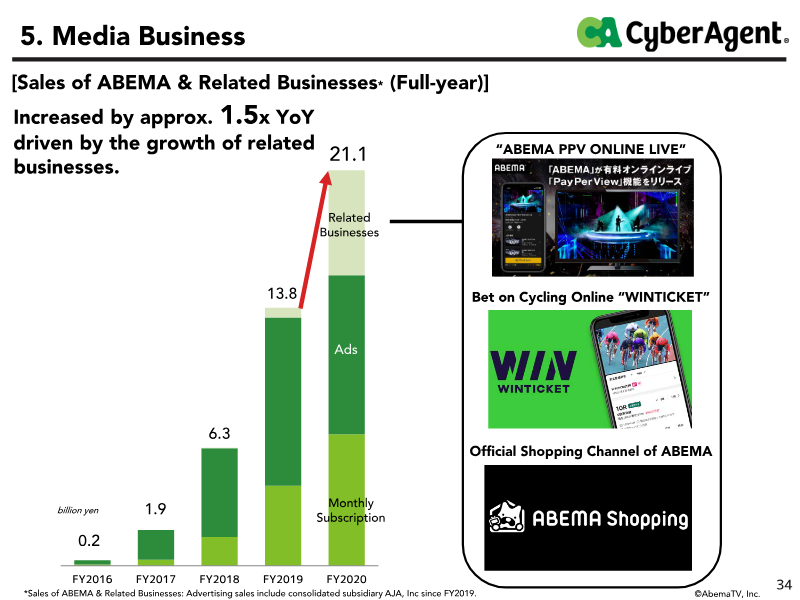
CyberAgent achieved record-high financial performance in fiscal year 2020, reporting consolidated sales of 478.5 billion yen and an operating profit of 33.8 billion yen. These results represent year-over-year increases of 5.5% and 9.9% respectively, surpassing initial forecasts despite the operational challenges posed by the global pandemic. Growth was primarily catalyzed by the Game business, which generated 155.8 billion yen in sales. This segment benefited from the sustained performance of legacy titles and the successful launch of Project SEKAI, which acquired over two million users within its first three weeks. The Media business, centered on the ABEMA streaming platform, remains a critical pillar for long-term expansion. ABEMA experienced a 22.6% increase in annual sales to 57 billion yen, supported by a cumulative download base exceeding 59 million. While the segment continues to operate at a loss of 18.5 billion yen due to aggressive up-front investments, these losses are narrowing as new monetization streams mature. Specifically, the rapid adoption of Pay-Per-View services and a seventeen-fold increase in transaction volume for the WINTICKET cycling betting service have diversified the platform's revenue model beyond traditional advertising. Looking toward fiscal year 2021, the strategic focus shifts toward scaling consolidated sales to 500 billion yen while maintaining a robust financial position. To manage this growth, a new governance structure has been implemented to separate management oversight from execution. Although increased selling, general, and administrative expenses led to a quarterly dip in operating profit during the final months of 2020, the overall trajectory remains positive. The combination of a highly profitable gaming portfolio and the accelerating monetization of digital media assets positions the organization for sustained domestic leadership in the Japanese internet services market.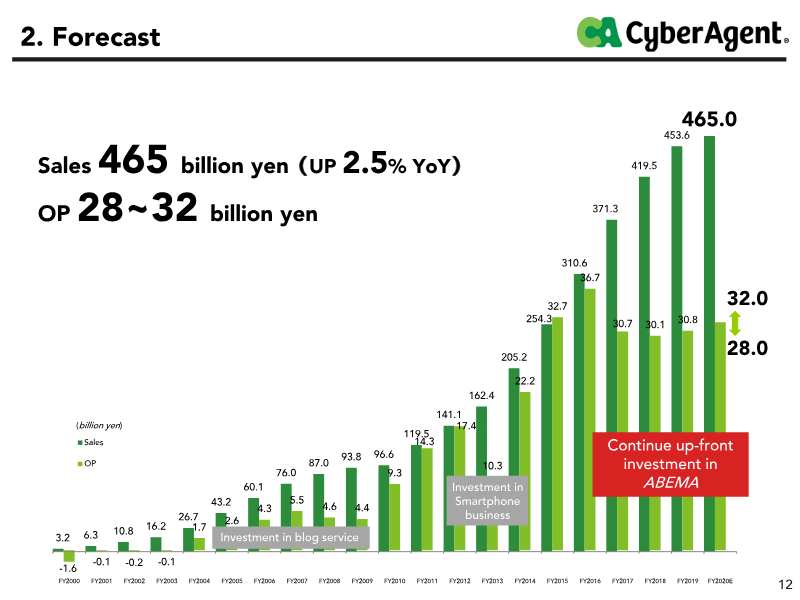
CyberAgent · 2020
Presentation3Q FY2020 Presentation Material
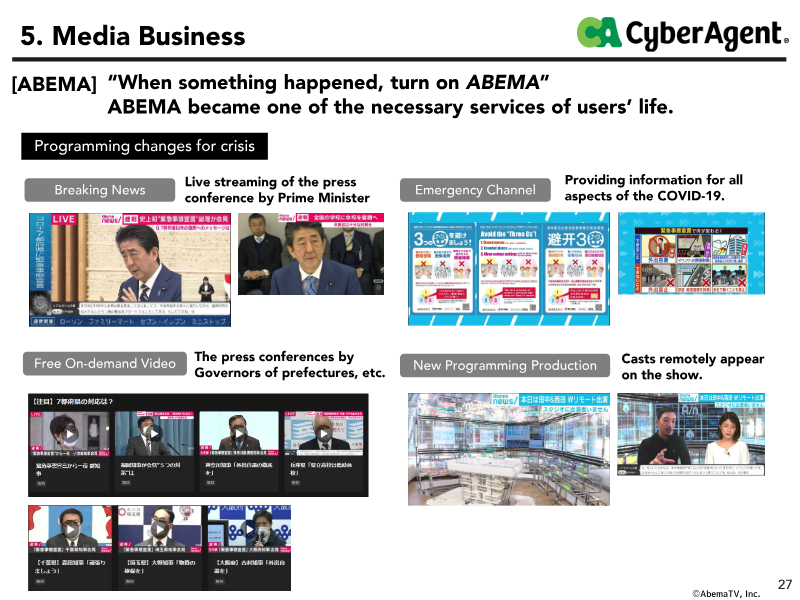
CyberAgent’s performance during the third quarter of fiscal year 2020 remained resilient despite the economic disruptions caused by the COVID-19 pandemic. Consolidated sales reached 112.8 billion yen, a marginal year-over-year decrease of 0.7%, while operating profit stood at 8.2 billion yen. By the end of this period, the company had already achieved between 89% and 102% of its full-year operating profit forecasts. This stability was largely driven by the Internet Advertisement segment, which successfully offset declining demand in certain sectors by pivoting toward advertisers benefiting from stay-at-home trends, and the Game business, which generated 36.7 billion yen in quarterly revenue following major title anniversaries. The media segment, centered on the streaming platform ABEMA, demonstrated significant growth with a 19.2% year-over-year increase in sales to 13.3 billion yen. This expansion was supported by a record 56 million downloads and a surge in the WINTICKET gambling transaction business, which doubled its volume to 7.2 billion yen. Strategic priorities for this segment include reaching one million ABEMA Premium subscribers by late 2020 and leveraging new virtual production technologies, such as Pay-Per-View systems, to enhance monetization. Looking forward, the corporate strategy focuses on establishing ABEMA as a long-term financial pillar while maintaining market share in the advertising sector through AI-driven efficiency. In the gaming division, the emphasis remains on the dual approach of developing new intellectual properties and extending the lifecycle of existing titles through robust operational management. These efforts are underpinned by a broader commitment to ESG initiatives and information security, ensuring sustainable value creation across the company’s diverse digital portfolio.

CyberAgent · 2020
Presentation2Q FY2020 Presentation Material: January to March 2020
CyberAgent achieved record-high financial performance during the second quarter of fiscal year 2020, with consolidated sales reaching 129.1 billion yen and operating profit surging 45.3% year-over-year to 12.4 billion yen. This growth was primarily anchored by the Game Business, which generated 44.8 billion yen in revenue. Success in this segment was driven by high-profile anniversary events for established titles like Granblue Fantasy and the strong market debut of KonoSuba: Fantastic Days. By the end of the first half, the company had already secured between 63% and 72% of its full-year profit targets, though projections for the remainder of the year remain cautious due to anticipated declines in advertising demand stemming from the COVID-19 pandemic. The media segment, centered on the ABEMA streaming platform, demonstrated significant momentum as stay-at-home orders accelerated user adoption. ABEMA reached 52 million downloads and grew its premium subscriber base to 676,000, with a clear trajectory toward one million subscribers by the end of the calendar year. While the segment still operates at a loss, these losses narrowed to 4.2 billion yen as sales rose nearly 19%. Monetization efforts are diversifying beyond traditional advertising into subscriptions and related services, such as the WinTicket betting platform, which saw transaction volumes double quarter-on-quarter to 3.5 billion yen. Strategic priorities for the future focus on balancing short-term gains with long-term operational stability. In the gaming sector, the emphasis remains on high-quality development and extending the lifecycle of existing intellectual properties. Simultaneously, the media division is pivoting toward a multi-faceted revenue model to ensure the sustainability of its expanding digital ecosystem. Despite the broader economic uncertainty introduced by global health trends, the current fiscal trajectory suggests a robust foundation built on digital entertainment and diversified media services.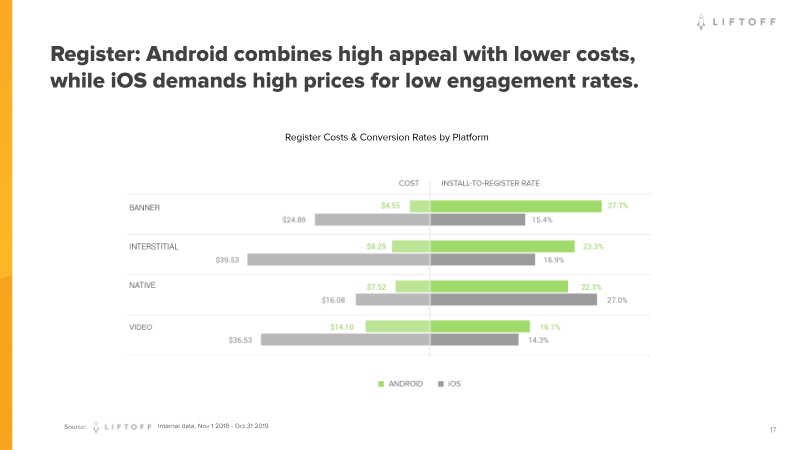
Liftoff · 2020
ReportMobile Ad Creative Index 2020
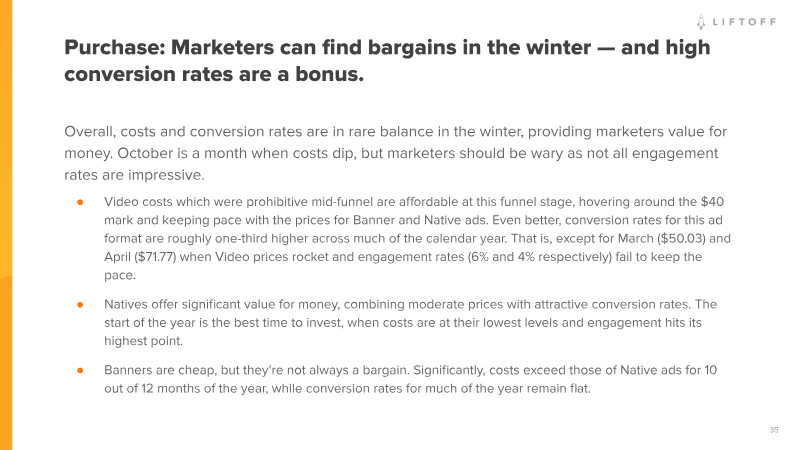
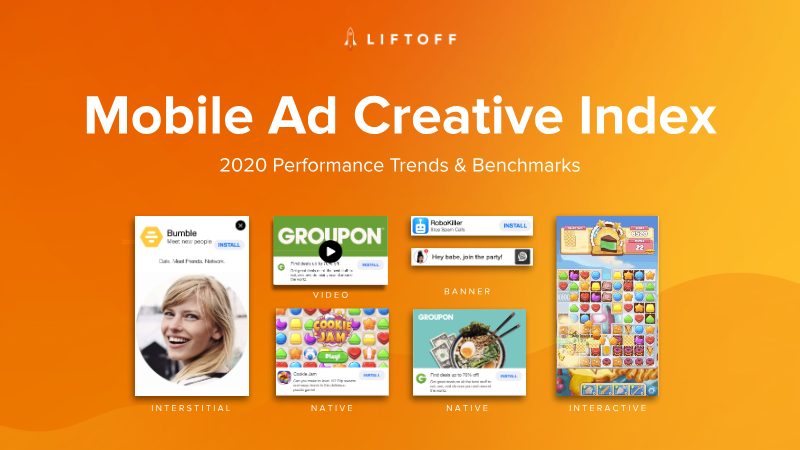
The 2020 mobile advertising landscape is defined by a stark divergence in performance metrics across creative formats, operating systems, and geographic regions. While banner ads remain the most cost-effective entry point for driving initial installs, native and video formats demonstrate superior efficacy in securing high-value, deep-funnel actions such as in-app purchases. Native ads, in particular, achieve conversion rates as high as 52.8%, signaling their importance for long-term user retention. However, these performance gains come at a premium on iOS, where costs consistently dwarf those on Android. For instance, the cost of securing an in-app purchase through native ads on iOS reaches $218.09, nearly triple the $73.62 required on Android. Geographically, North America persists as the most expensive market for user acquisition across all formats, while the LATAM and APAC regions offer significantly more accessible pricing for advertisers. Seasonal trends also influence these costs, with install expenses typically peaking during the summer months. To navigate these fluctuations, successful campaigns increasingly rely on iterative A/B testing and dynamic creative strategies. Case studies from major brands like Credit Karma and Groupon illustrate that disciplined testing can yield lifts in click-to-install rates exceeding 120%, underscoring the necessity of a data-driven approach to creative optimization. The industry is shifting toward a performance-based, cost-per-action model that prioritizes post-install revenue events over simple downloads. By leveraging machine learning and focusing on single-deal creative strategies, advertisers can better align their spending with actual user value. Ultimately, the data suggests that while the cost of acquisition is rising, particularly on premium platforms and in mature markets, the integration of dynamic product ads and rigorous testing frameworks remains the most effective path toward achieving sustainable return on ad spend.
Newzoo · 2019
ReportEsports Leagues: One of Many Opportunities for Brands (March 2019)
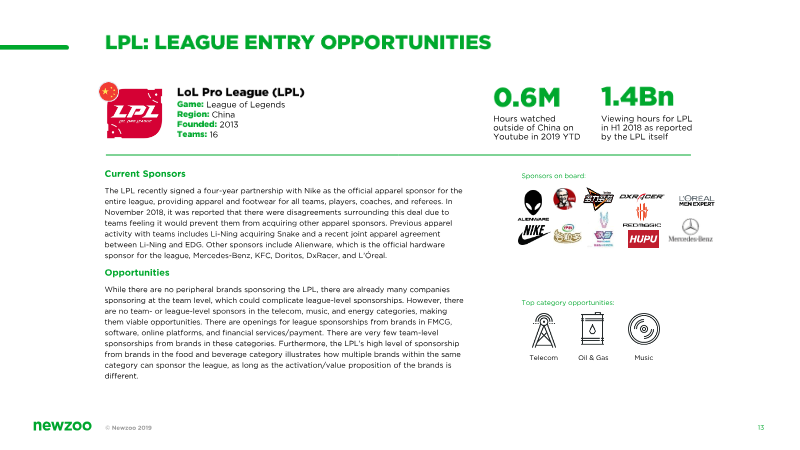
This analysis examines the strategic landscape of esports league sponsorships, providing a framework for consumer brands to evaluate and enter the gaming ecosystem. The primary objective is to demonstrate that esports has matured into a viable, high-value marketing channel, offering brands significant opportunities to engage with a large, affluent, and growing demographic. With the number of esports enthusiasts projected to reach 297 million by 2022, the industry represents a critical frontier for non-endemic brands seeking to diversify their media presence. The findings highlight a rapid acceleration in sponsorship activity, noting that the first quarter of 2019 alone surpassed the total deal volume of the same period in 2018. Data from five major franchised leagues—the LoL European Championship (LEC), LoL Championship Series (LCS), Overwatch League (OWL), LoL Pro League (LPL), and King Pro League (KPL)—demonstrate substantial viewership, with the LEC, LCS, and OWL collectively generating over 33.9 million live viewership hours in early 2019. The audience is characterized by high engagement, with 39% of enthusiasts aged 21 to 35 and 43% reporting high household incomes. The analysis emphasizes that while sponsorship slots are filling, significant gaps remain across various sectors, including music, cosmetics, telecommunications, and oil and gas. Success in this space requires careful navigation of potential conflicts between league-level and team-level agreements. Effective activations, such as Shell’s in-game power-ups or State Farm’s analyst desk, demonstrate that brands achieve the highest impact when they integrate their value proposition directly into the gameplay experience or provide meaningful context to the viewer. Methodologically, the insights are derived from proprietary market intelligence, including a global panel of over two million game enthusiasts, streaming trackers, and historical data modeling. The report concludes that brands must adopt a structured approach—assessing market, audience, and ecosystem fit—to successfully transition from traditional media strategies into the complex, evolving world of professional gaming.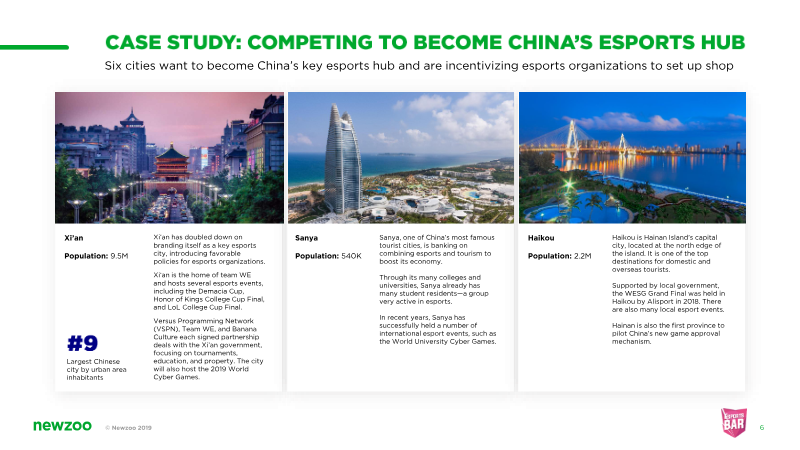


Newzoo · 2019
ReportTrends to Watch in 2019: Five Developments Transforming the Esports Market
The esports market is undergoing a significant maturation process, transitioning from a digital-first niche into a multifaceted entertainment industry. The primary thesis is that the sector is evolving through five key developments: the resurgence of physical, location-based initiatives; the cross-pollination of monetization strategies between esports and traditional sports; the rise of influencers as primary broadcasters; the adaptation of linear television storytelling formats; and an intensified focus on building long-term brand loyalty. Data indicates that the global esports market reached a valuation of $1.1 billion in 2019, supported by an audience of 453.8 million. While the industry has historically relied on digital engagement, there is a marked shift toward offline experiences, such as dedicated esports bars and PC cafes, particularly in China, where government support is driving infrastructure investment. Simultaneously, the industry is balancing indirect revenue streams like media rights and sponsorships with direct consumer monetization models—such as micro-transactions and premium content subscriptions—that traditional sports organizations are increasingly adopting to offset declining linear television viewership. The scope of this analysis covers global trends with a specific emphasis on the Chinese market’s rapid development of esports hubs. The findings suggest that the future of the industry depends on the ability of teams and leagues to cultivate distinct brand identities that transcend the games themselves. By leveraging influencers to reach fragmented audiences and utilizing emerging technologies like augmented reality to enhance live event spectacles, esports organizations are positioning themselves to capture greater market share. Ultimately, the industry is moving toward a professionalized model that prioritizes narrative-driven content and deep fan engagement to secure sustainable growth and attract non-endemic investment.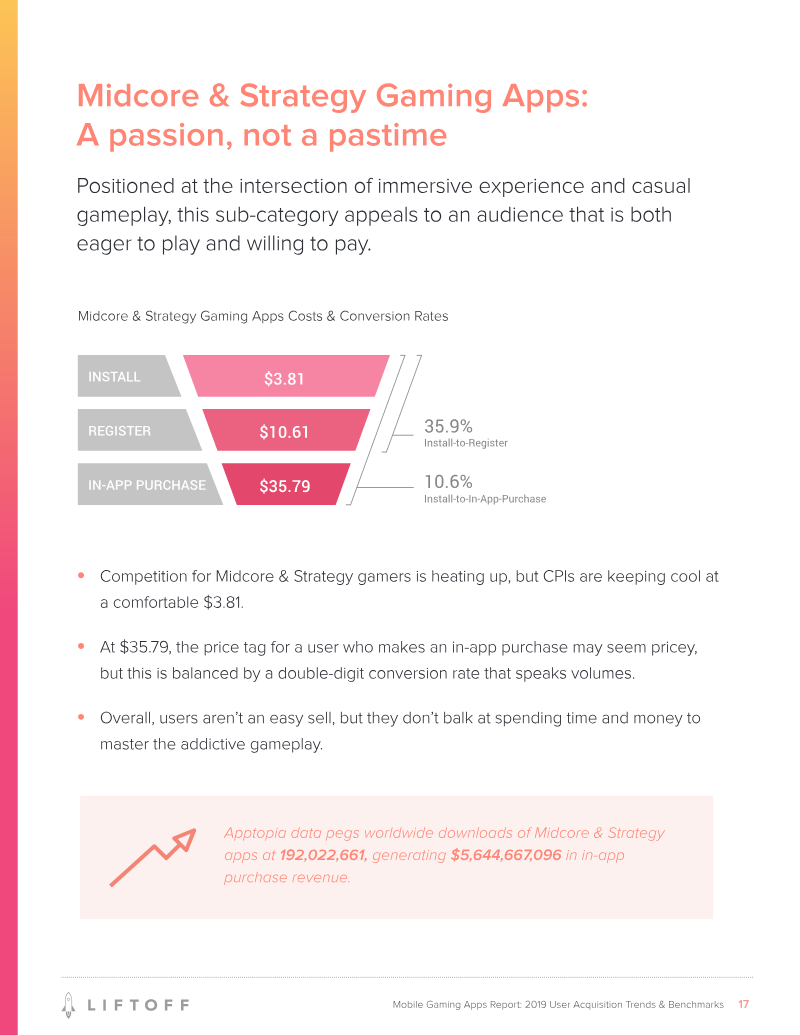
Newzoo · 2019
ReportMobile Gaming Apps Report: 2019 User Acquisition Trends & Benchmarks
The 2019 mobile gaming landscape is defined by a period of unprecedented consumer spending, with gaming apps accounting for 74% of total app store revenue. While the market continues to expand, user acquisition costs have escalated, reaching an average of $35.42 to acquire a single paying user. This environment necessitates a strategic approach to platform and regional selection, as Android currently offers a more cost-effective reach than iOS. Seasonal trends also play a critical role in performance, with the third quarter emerging as a peak period for high conversion rates and optimized acquisition costs. Geographically, the market presents a stark contrast between established and emerging territories. North America, Japan, and South Korea remain the most expensive regions for acquisition but continue to lead in long-term retention and in-app purchase revenue. Conversely, Russia, Brazil, and the broader EMEA region offer high-value opportunities characterized by lower registration costs and strong initial conversion rates. While these emerging markets provide a lower barrier to entry, they often struggle with deep-funnel engagement and monetization compared to the high-yield but competitive Asian and North American markets. Genre-specific data reveals that Social Casino and Hyper Casual games are the primary drivers of early engagement, with Social Casino apps achieving a category-leading 14.3% install-to-purchase conversion rate despite high acquisition costs. Hyper Casual games have solidified their position through ad-supported models and high Day 1 retention, effectively targeting non-traditional gamers in markets like Colombia and Turkey. Meanwhile, Midcore and Strategy titles demonstrate the greatest potential for long-term revenue and sustained engagement, particularly within the EMEA region, where they outperform North American benchmarks in conversion efficiency.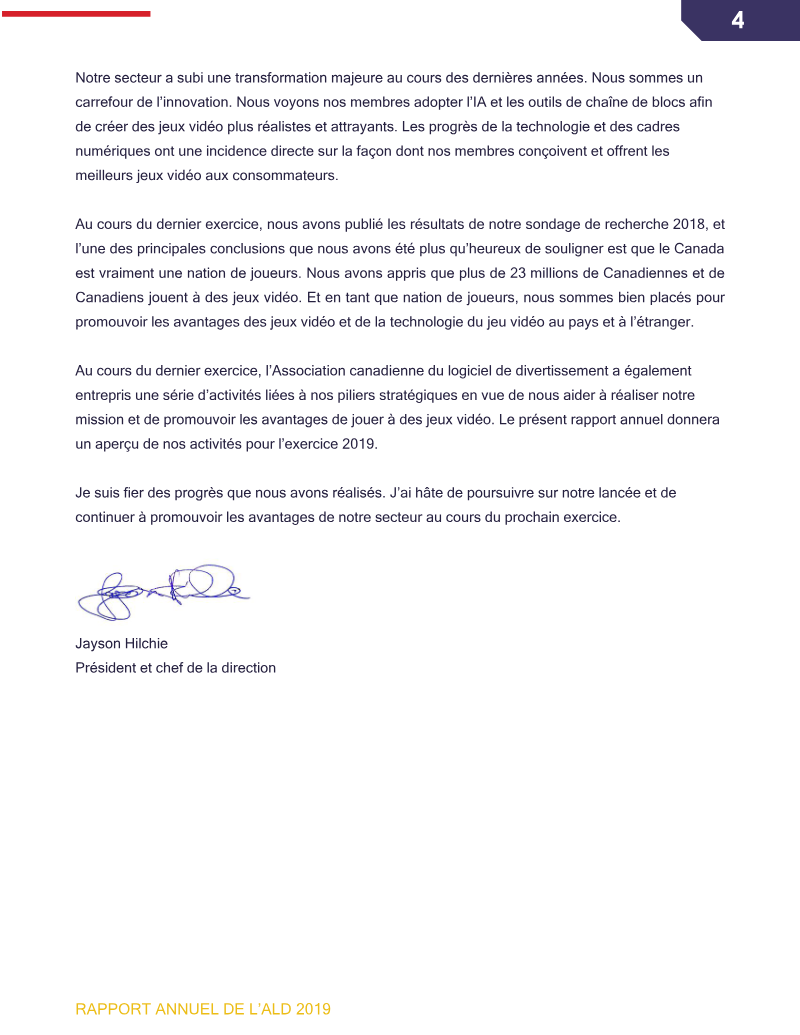

ESAC – Entertainment Software Association of Canada · 2019
ReportRapport Annuel 2019 Entertainment
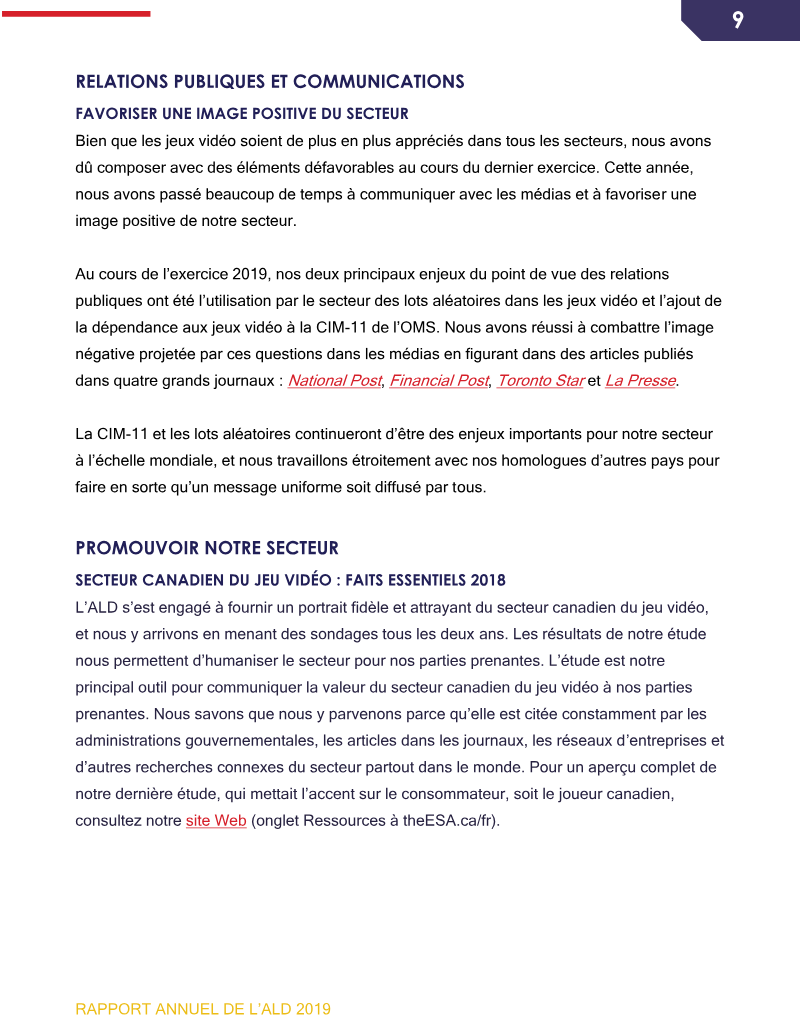
The 2019 annual report of the Canadian Entertainment Software Association (ALD) outlines the organization’s role as the principal advocate for Canada’s video-game sector, emphasizing a strategic focus on member-first principles, regulatory advocacy, and public perception. Central to its thesis is the conviction that a coordinated, policy-friendly environment and heightened visibility of the industry’s economic contribution will sustain long-term growth. Key findings highlight a robust domestic market, with more than 23 million Canadians identified as regular gamers through a 2018 NPD Group survey that captured demographic, console usage and purchasing patterns. The “Jeux vidéo sur la Colline” event drew a record 250 participants, including 25 federal legislators, and featured leading publishers such as Ubisoft, Nintendo, EA and Xbox, underscoring the sector’s political engagement. ALD’s lobbying efforts included testimonies before multiple parliamentary committees and direct dialogue with Minister Navdeep Bains, reinforcing support for tax-credit frameworks and innovation policies. Internationally, the association participated in the Global Video Game Associations Summit in Santa Monica, addressing issues like loot-box regulation and the WHO’s inclusion of gaming disorder in ICD-11. Operational highlights for 2019 include the appointment of a new director of policy and a director of communications, a targeted media campaign that secured coverage in four major Canadian newspapers, and the launch of bilingual parental-control tutorials in partnership with console manufacturers. Membership remained stable while two prominent publishers, Codename Entertainment and Kabam, joined the association, reflecting continued expansion of the member base. Overall, the report demonstrates ALD’s comprehensive advocacy, research, and outreach activities aimed at strengthening Canada’s video-game ecosystem during the fiscal year.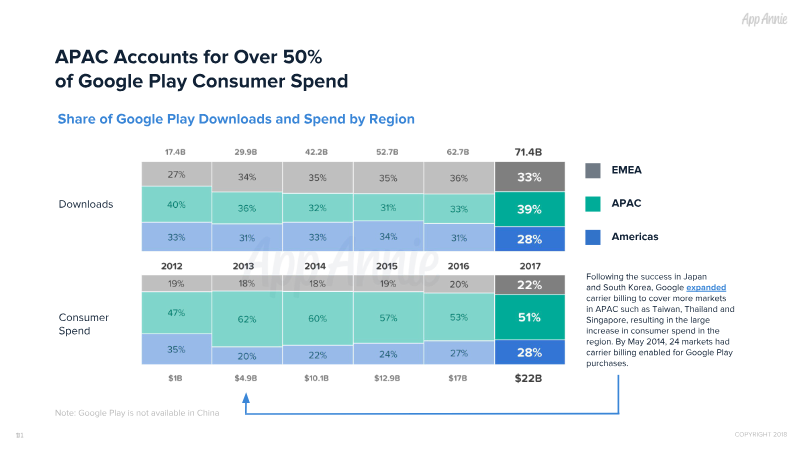
data.ai · 2018
ReportThe Data Behind 10 Years of Google Play (2018)
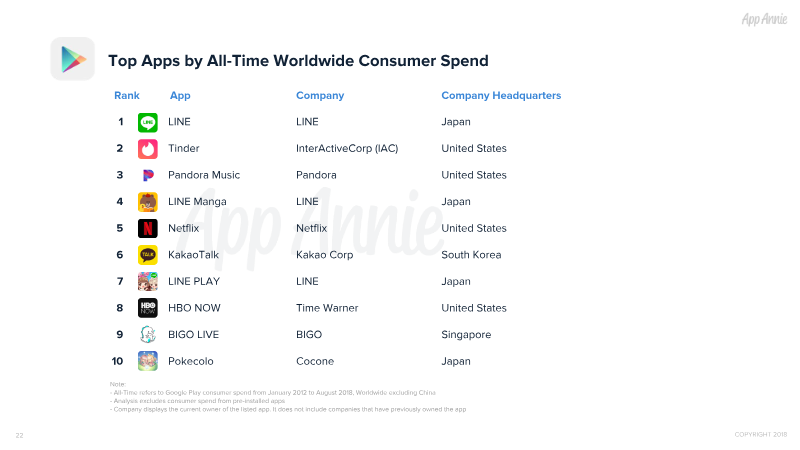
This analysis examines the growth and performance of the Google Play Store over a nearly seven-year period, spanning from January 2012 to August 2018. Utilizing data from the App Annie platform, the findings track the evolution of the Android ecosystem from its early stages to a mature marketplace featuring over 2.8 million available apps. During this timeframe, the platform recorded nearly 330 billion total downloads and generated over $85 billion in consumer spend, with more than 5,000 individual apps surpassing the $1 million revenue milestone. Geographic trends reveal a significant divide between volume and value. India leads the world in total downloads at 36.9 billion, followed closely by the United States and Brazil. However, Japan emerges as the most lucrative market, contributing $25.1 billion in consumer spend, significantly outpacing the United States and South Korea. The data highlights a shift in monetization strategies, particularly the 2017 transition toward in-app subscriptions. This change, supported by a reduction in Google’s transaction fees for long-term subscribers, resulted in a 55% growth in spend for non-gaming apps between 2016 and 2017. The competitive landscape is dominated by major social media and gaming entities. Facebook-owned properties occupy the top four spots for all-time downloads, while LINE and Tinder lead in non-gaming consumer spend. In the gaming sector, Subway Surfers is the most downloaded title, but GungHo Online’s Puzzle & Dragons and Mixi’s Monster Strike lead in total revenue. Looking forward, the analysis projects continued aggressive growth, estimating that annual consumer spend on Google Play will reach $42 billion by 2022, a 90% increase from 2017 levels.

Newzoo · 2017
Report