Related Documents

Financial
Q4 2025 Interim Report
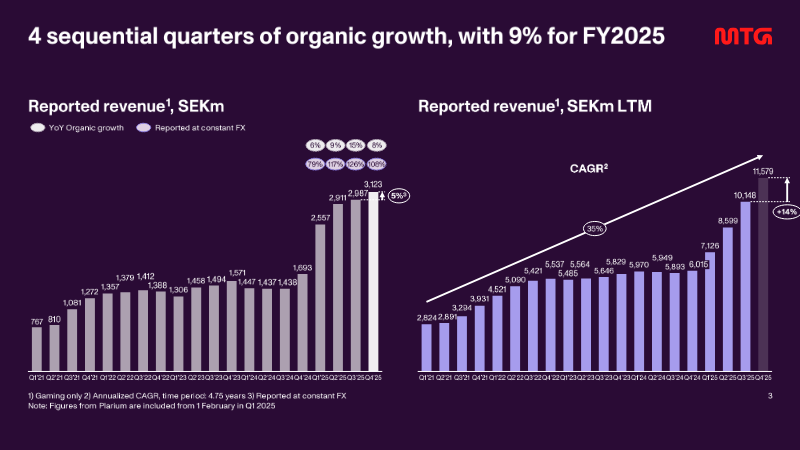
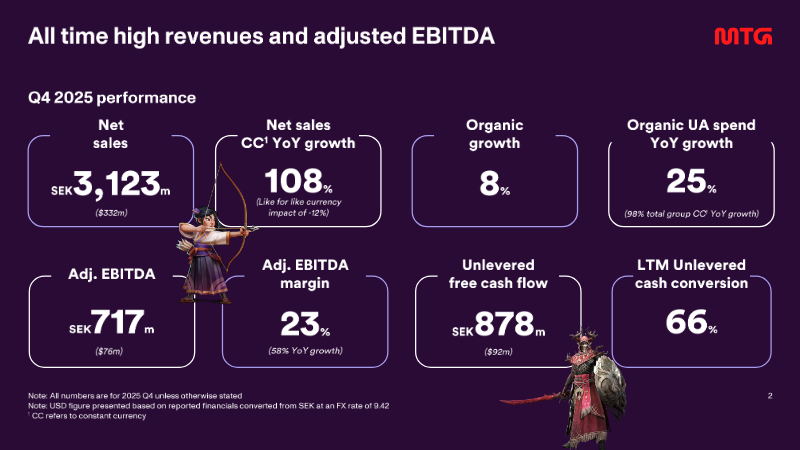
The interim filing presents the fourth‑quarter 2025 financial results for a midcore‑casual gaming group, emphasizing a record‑setting revenue run and the successful execution of a transformation agenda that includes the integration of the Plarium acquisition and the rollout of a new district structure in early 2026. Revenue reached SEK 3,123 million, reflecting 108 % organic growth year‑on‑year and a 25 % increase on a constant‑currency basis, while adjusted EBITDA rose to SEK 717 million, delivering a 23 % margin that matches the full‑year figure. Unlevered free cash flow amounted to SEK 878 million, with a cash‑conversion rate of 66 % and a leverage ratio of five times EBITDA, underscoring robust liquidity and disciplined capital management. User‑acquisition spending accelerated, representing 38 % of quarterly revenue—up from 37 % in the prior quarter—and grew 76 % on a reported basis, driven by heightened investment in original studios, new casual titles, and the racing franchise. The direct‑to‑consumer channel expanded by 600 basis points to 32 % of total revenue, reflecting a strategic shift toward higher‑margin in‑app purchases. Across the fiscal year, the company posted a 9 % organic revenue increase, with word‑games, racing, and RAID franchises delivering the strongest quarter‑end performance. Operating cash flow for the quarter stood at SEK 840 million, while adjusted net income was SEK 1,390 million, translating to an adjusted EPS of SEK 11.33. The financial outcomes exceed guidance and position the firm to meet its medium‑term outlook, with a pre‑IPO study for PlaySimple concluded and the midcore transformation progressing as planned.
Modern Times GroupFeb 2026
Report
Global Gaming M&A and Growth Financing Advisory: Q1 2025
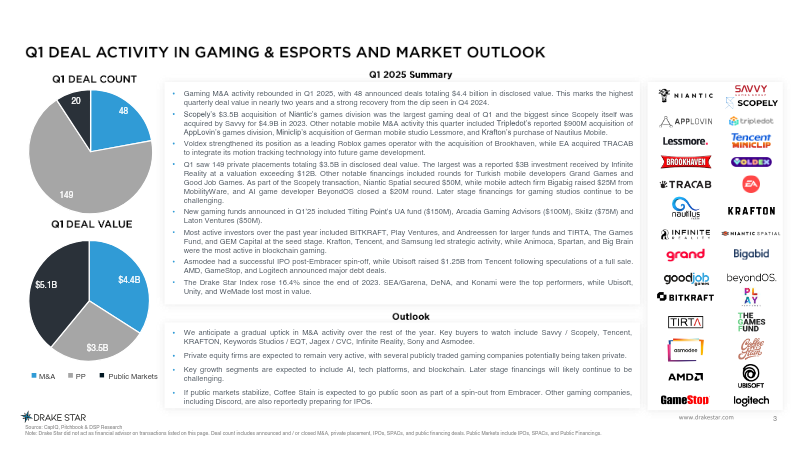
The global gaming industry experienced a notable resurgence in early 2025, characterized by a rebound in merger and acquisition activity and sustained interest in private financing. During the first quarter, 48 announced acquisitions reached a total value of $4.4 billion, anchored by the significant $3.5 billion acquisition of Niantic’s games division by Scopely. Simultaneously, the private placement market remained active, recording 149 deals worth $3.5 billion. These investments were primarily concentrated in mobile-focused developers and companies integrating artificial intelligence into their entertainment platforms, with major strategic entities like Savvy Games Group and Tencent continuing to drive market momentum. Despite this activity, the financial landscape remains bifurcated. While the broader sector shows signs of recovery, with the Drake Star Gaming Index posting a 16.37% gain, performance remains highly volatile across the top 35 public gaming companies. Valuation disparities are particularly pronounced; industry leaders such as NVIDIA and AppLovin command premium revenue multiples, while many other firms face a more challenging environment. Furthermore, while early-stage funding remains accessible, later-stage financing continues to present significant hurdles for companies seeking capital. Looking forward, the industry is positioned for a gradual increase in consolidation as public markets stabilize. Strategic focus is shifting toward the integration of AI and advanced technological platforms, which are expected to serve as primary catalysts for future growth. As market conditions improve, the sector is likely to see a renewed pipeline of initial public offerings, signaling a transition toward a more mature and diversified investment climate for global gaming stakeholders.
Drake StarJan 2025
Report
Gaming Industry Report: Q3 2024
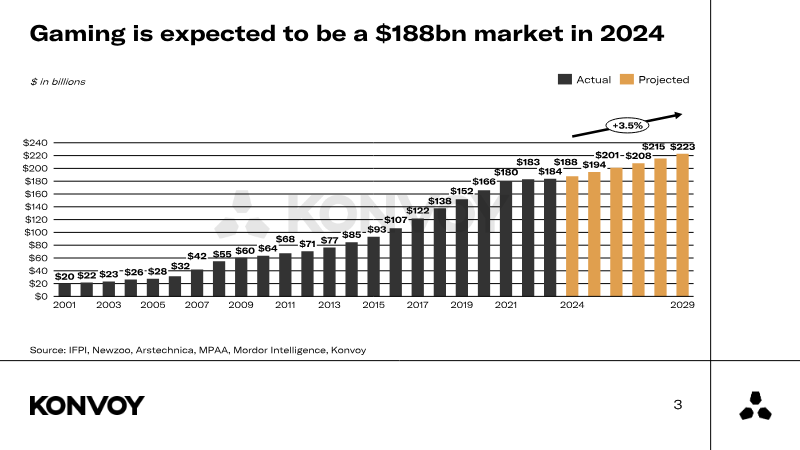
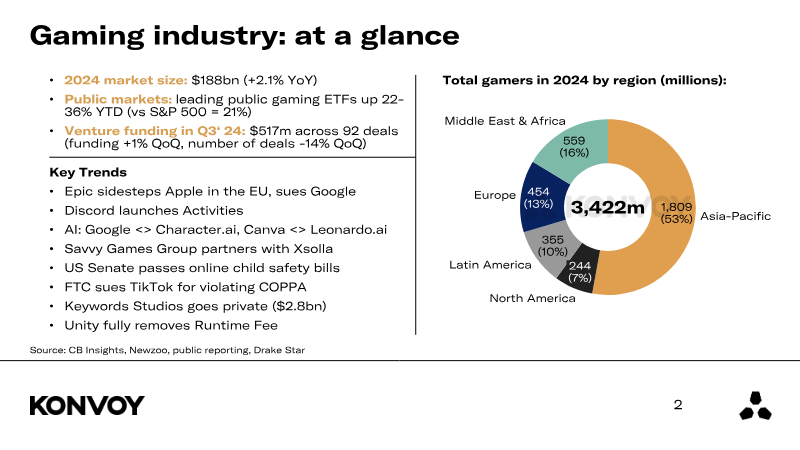
• 2024 market size: $188bn (+2.1% YoY) Total gamers in 2024 by region (millions): • Public markets: leading public gaming ETFs up 22- • 36% YTD (vs S&P 500 = 21%) Middle East & Africa Venture funding in Q3‘ 24: $517m across 92 deals 559 (funding +1% QoQ, number of deals -14% QoQ) (16%) • Epic sidesteps Apple in the EU, sues Google Europe (454 3,422m • Discord launches Activities ...
KonvoyOct 2024
Report
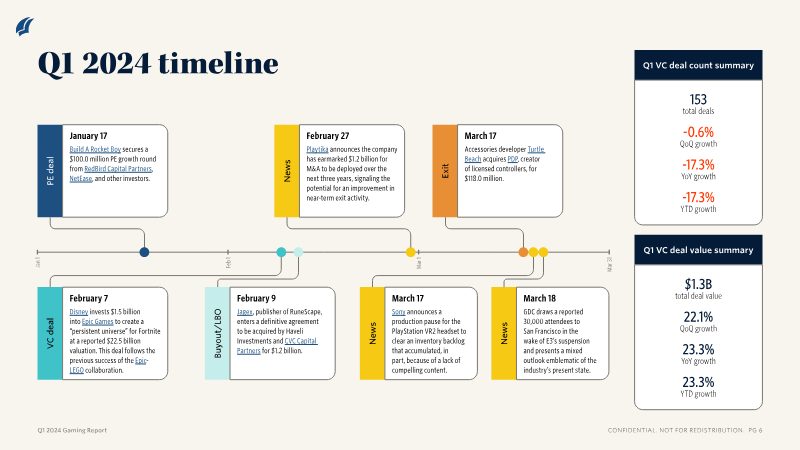
Gaming Report: Q1 2024
The gaming venture capital landscape in the first quarter of 2024 reflects a market reaching a steady state, characterized by a shift away from speculative Web3 and metaverse investments toward more sustainable development and content-focused funding. Global venture activity during this period totaled $1.3 billion across 153 deals. While deal count remained largely flat compared to the previous quarter, total deal value increased by 22.1% quarter-over-quarter. Despite a 17.3% year-over-year decline in deal volume, the market is currently on track to exceed 2023’s aggregate funding levels, suggesting a stabilization of capital deployment within a more realistic valuation environment. Development-focused companies, particularly those specializing in blockchain infrastructure and developer tools, captured significant attention in early 2024, momentarily outpacing content-focused investments. However, the broader industry remains highly competitive, with PC and console gameplay increasingly concentrated in established "forever titles." New content faces a challenging landscape, as only a small fraction of total playtime is dedicated to non-annual franchise releases. Investors are increasingly prioritizing high-quality content and scalable infrastructure, creating a more selective, investor-friendly environment. The report also highlights the growing importance of in-game advertising as a critical monetization strategy. With major industry players and brands integrating programmatic ad solutions, the sector is seeing increased utility for both developers and advertisers. Companies like Anzu exemplify this trend, leveraging technology to bridge the gap between brand reach and measurable return on investment. As the industry moves past the hype-driven cycles of the pandemic, the focus has shifted toward long-term operational efficiency and proven monetization models, with exit activity expected to improve as market conditions stabilize.
PitchBookJan 2024