Related Documents
Report
Mobile App Trends 2021: A Global Benchmark of App Performance
The mobile app industry underwent a transformative period of growth in 2020, characterized by a 50% year-over-year increase in global installs and a total consumer spend of $112 billion. While the fintech sector led in raw install growth at 51%, the gaming industry remained a dominant force with a $165 billion valuation, driven by a 43% surge in hyper-casual downloads. E-commerce demonstrated a distinct trend toward intensified user engagement; despite a modest 6% rise in installs, the vertical experienced a 44% increase in sessions and a 58% jump in in-app transactions, signaling a shift in consumer behavior toward deeper digital integration. User engagement metrics across the ecosystem reflected this heightened activity, with overall sessions rising by 30%. Fintech and e-commerce sessions saw particularly sharp increases of 85% and 44%, respectively. Within the gaming sector, performance varied significantly by sub-genre. Hyper-casual titles relied heavily on paid acquisition and faced rapid churn, whereas non-hyper-casual games maintained superior retention, reaching median session lengths of 45 minutes by day 30. Cost structures also diverged sharply, as acquisition costs for general gaming peaked at $2.52 per install in the fourth quarter, while hyper-casual costs plummeted to a low of $0.27. Sustaining growth in this increasingly competitive landscape requires a strategic pivot from volume-based metrics to sophisticated behavioral analytics. Developers must prioritize retention rates and effective cost per install (eCPI) to refine onboarding processes and ensure long-term profitability. Success in the current market depends on a data-driven, UX-centric approach that utilizes automation and real-time measurement to navigate evolving privacy regulations, such as iOS 14. Ultimately, the path to maximizing return on investment lies in personalized marketing campaigns and a granular understanding of vertical-specific user behaviors.
AdjustJan 2021

Report
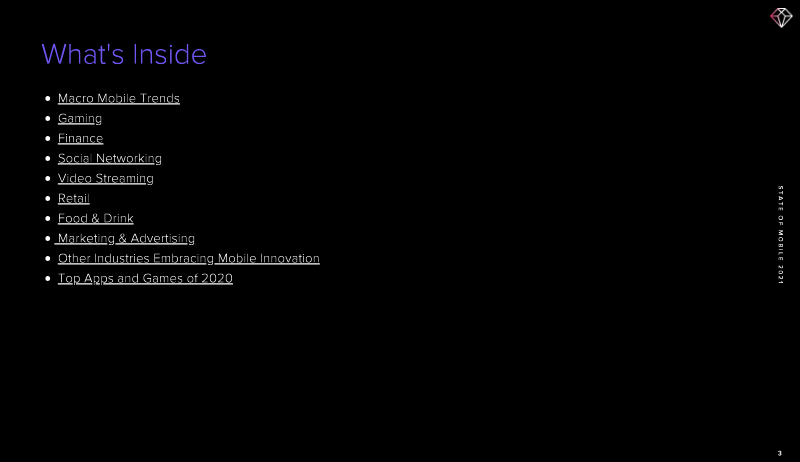
State of Mobile 2021
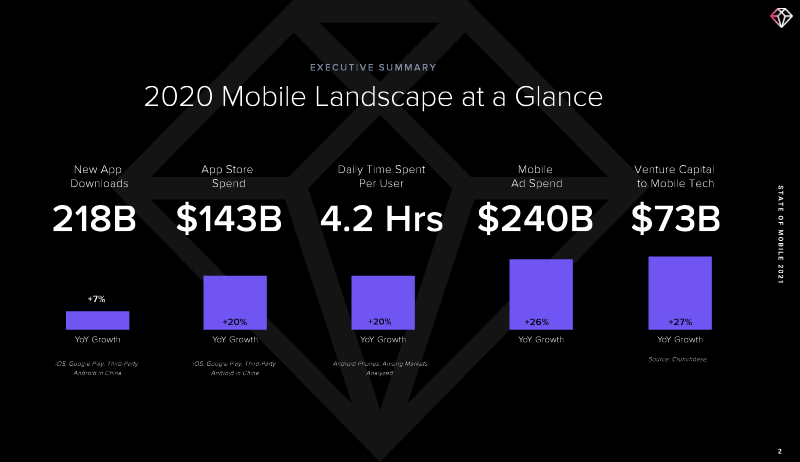
The mobile industry experienced a historic acceleration in 2020, effectively compressing two to three years of projected growth into a single twelve-month period. Global app downloads reached 218 billion while consumer spending surged 20% year-over-year to $143 billion. This shift was characterized by a fundamental change in consumer behavior, as global users averaged 4.2 hours of daily mobile engagement, surpassing live television viewership in the United States. Venture capital followed this momentum, with investments in mobile technology rising 27% to $73 billion. Mobile gaming remained the primary economic engine of the ecosystem, contributing 66% of total spend and positioning the sector to exceed $120 billion in 2021. The global pandemic acted as a catalyst for digital-first adoption across diverse sectors, most notably in finance, streaming, and retail. Time spent in finance apps increased by 45% globally, driven by the democratization of stock trading, while video streaming hours rose by 40%. Retail saw a 30% increase in usage as social commerce emerged as a dominant trend, projected to reach a $2 trillion market value by 2024. TikTok emerged as a standout performer, experiencing a 325% increase in engagement. This heightened activity fueled a robust mobile advertising market, which reached $240 billion in spend, supported by a 95% increase in ad placements within the United States. Specific categories saw unprecedented spikes in utility, with business app usage growing 275% and health and fitness spending rising 30% to $2 billion. Leading platforms such as Tinder, PUBG Mobile, and TikTok dominated their respective metrics for spend, active users, and downloads. Furthermore, specialized platforms like Azar and SmartNews demonstrated the success of integrating artificial intelligence and real-time data to capture Gen Z and news-seeking audiences. These developments underscore a permanent shift toward a mobile-centric global economy where digital engagement is the primary medium for commerce, communication, and entertainment.
data.aiJan 2021


Report
Mobile App Trends 2022
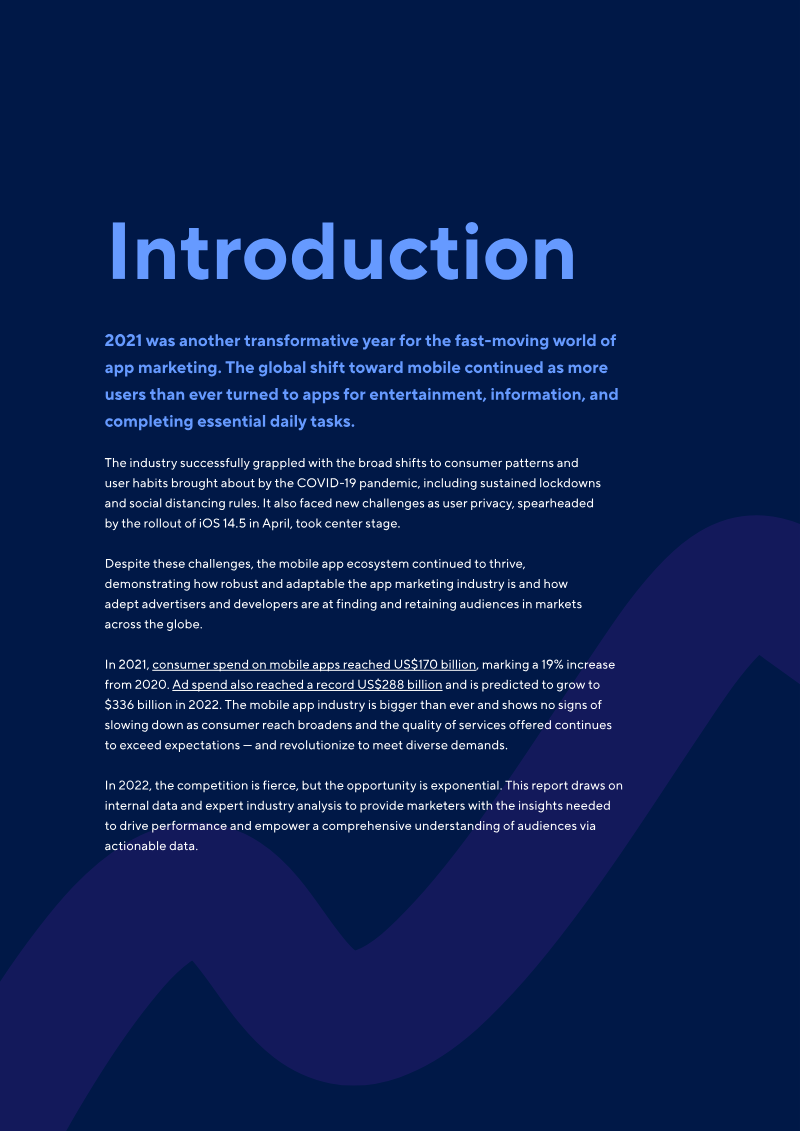
The mobile app industry experienced a period of robust expansion throughout 2021, characterized by $170 billion in consumer spending and $288 billion in advertising expenditures. Despite the implementation of Apple’s App Tracking Transparency framework, the sector demonstrated unexpected resilience as global opt-in rates reached 25%, significantly outperforming initial industry forecasts. This growth was distributed across several key verticals, with fintech and gaming leading the surge in installs at 35% and 32% respectively, while e-commerce maintained steady upward momentum with a 12% increase in downloads. Fintech emerged as a primary driver of engagement, particularly within the asset management and cryptocurrency subverticals. While traditional banking and payment apps maintained the highest share of installs, crypto apps achieved record session lengths exceeding 15 minutes. This heightened engagement occurred alongside a sharp rise in acquisition costs, with effective cost-per-install (eCPI) for fintech apps more than tripling. Consequently, developers are increasingly pivoting toward subscription-based models to ensure long-term profitability and offset the rising price of user acquisition. The e-commerce and gaming sectors mirrored this trend of higher costs paired with increased user value. Although e-commerce retention rates saw a slight decline, total in-app revenue jumped by 46%, driven by longer session durations in marketplace apps. Similarly, the gaming industry saw hyper-casual titles dominate download volumes while adventure and strategy games secured deeper engagement. Across all sectors, the transition toward higher-quality user bases is evident; while it is becoming more expensive to acquire users, those who remain are spending more time and money within apps, making retention and lifetime value the critical metrics for sustained success in a maturing mobile market.
AdjustJan 2022

Report
Mobile App Trends 2022: A Global Benchmark of App Performance
The global mobile ecosystem experienced significant expansion throughout 2021 and into 2022, characterized by record-breaking consumer spending of $170 billion and a projected ad spend of $336 billion. Despite initial concerns regarding privacy changes following the release of iOS 14.5, the industry demonstrated remarkable resilience as App Tracking Transparency opt-in rates reached 25% globally, far exceeding early market expectations. This growth was distributed across key verticals including fintech, e-commerce, and gaming, with mobile e-commerce sales alone reaching $3.56 trillion. The fintech sector emerged as a primary driver of engagement, with installs and sessions rising by 34% and 53% respectively. While traditional banking and payment apps maintain the highest market share, cryptocurrency and stock trading platforms saw the most intense user activity, with session lengths nearly doubling. However, this heightened interest triggered a sharp increase in acquisition costs, with fintech eCPIs rising from $1.05 to $3.40 over the course of a year. Similarly, e-commerce apps saw a 46% surge in in-app revenue despite rising costs and declining retention, signaling a shift where users are spending more money and time per session even as new user acquisition becomes more expensive. Mobile gaming remains the dominant force in the app economy, accounting for 52% of total consumer spend. Global game installs grew by 32%, led by the hyper-casual subvertical, though action and adventure titles commanded the highest levels of engagement and session frequency. While Day 30 retention rates for games nearly doubled to 9%, the industry faces a growing divide between high-volume downloads and long-term stickiness. As user acquisition costs continue to climb across all regions—particularly in LATAM and EMEA—the focus for developers has shifted from pure volume to maximizing lifetime value and implementing sophisticated re-engagement strategies to sustain growth in an increasingly competitive landscape.
AppLovinJan 2022