Related Documents

Report
Annual Report and Accounts 2012
14.59 Moscow Stockholm CEO’s Review 1 CFO’s Review 4 Five Year Summary 6 Modern Responsibility 10 Directors’ Report 16 The MTG Share 46 Corporate Governance Report 50 Board of Directors 60 Executive Management 63 Consolidated Financial Statements 67 Parent Company Financial Statements ...
Modern Times Group

Financial
Fiscal Year Ended March 2026: Results Presentation
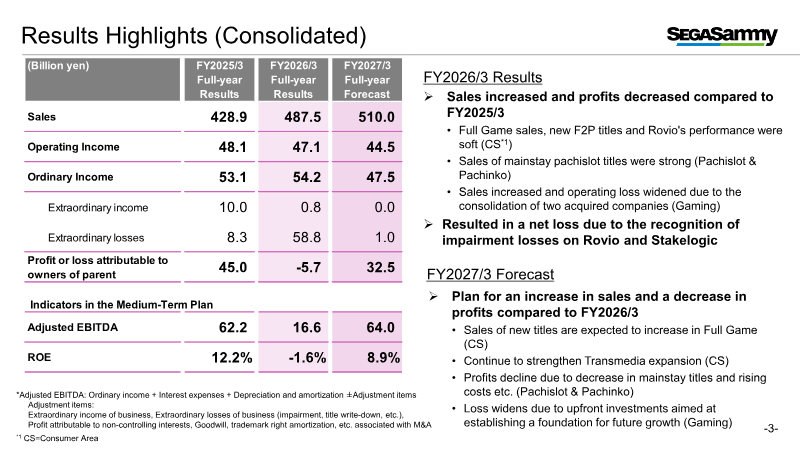
Fiscal year 2026 ended with a 13 % rise in sales to ¥487.5 bn, yet operating income swung from a ¥48.1 bn profit in FY2025 to a ¥5.7 bn loss, driven by significant goodwill impairments on Rovio and Stakelogic and a widening deficit in the Gaming segment. Adjusted EBITDA fell to ¥16.6 bn, reflecting heavy upfront development costs and impairment charges, while net equity contracted by ¥48.7 bn as cash balances were depleted following the acquisitions of GAN and Stakelogic. Within Entertainment Contents, sales edged up to ¥326.6 bn from ¥321.5 bn, but operating income declined from ¥40.8 bn to ¥32.4 bn because new Full‑Game and F2P titles underperformed, despite steady growth in licensing revenue. Forecasts for FY2027 project sales of ¥357 bn and operating income of ¥42.5 bn, contingent on successful new IP launches, repeat sales, and a planned lift in licensing income. Margin erosion from title underperformance remains a key risk. Capital allocation for FY2026/3 was restructured to focus on ¥190 bn of cumulative investment over FY2025–FY2027, allocating ¥80 bn to development, ¥120 bn to strategic acquisitions, and planning ¥70 bn in share buybacks while pausing large‑scale M&A. Shareholder returns are expected to rise sharply, with FY2026/3 projected at ¥31.5 bn (≈¥11.7 bn in dividends) and FY2027/3 potentially reaching ¥16.2 bn under a 50 % total‑return ratio applied to projected net income. Pachislot sales showed modest growth, buoyed by new titles and strong first‑week performance of flagship IPs such as “Hokuto No Ken” and “Kabaneri of the Iron Fortress.” Pachinko sales declined as the temporary lift from Lucky Trigger 3.0 Plus faded and hall utilization softened. The group plans to introduce reel‑exchangeable cabinets, expected to account for roughly 20 % of pachislot revenue, and is positioning the gaming business for a J‑curve bottom in FY2027 through intensive lease sales and B2B platform upgrades. The release schedule for FY2026/3 emphasizes a concentrated push of multi‑platform titles, including the Nintendo Switch 2 launch in March 2026 and a slate of global releases across consoles, PC, and mobile from late 2025 to mid‑2026. Key animation properties such as *Detective Conan* and *Lupin the Third* are slated for April–June 2025, with several new IPs and Netflix exclusives planned for early 2026. Pachislot and pachinko product launches are detailed with projected unit sales ranging from 8,000 to 49,000 units across varying gambling‑specification tiers.
SegaSammyMay 2026

Financial
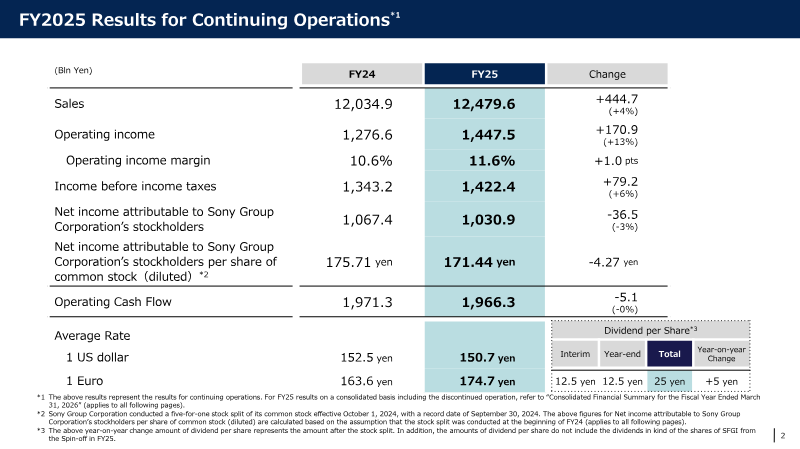
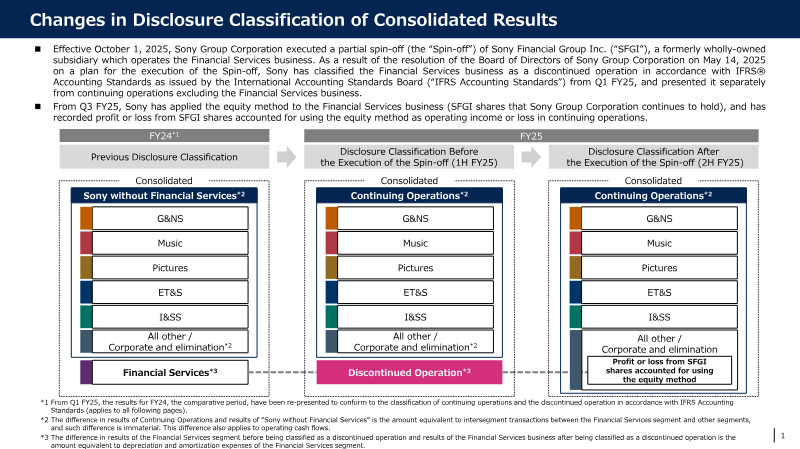
FY2025 Consolidated Financial Results
Sony Group’s FY2025 consolidated results demonstrate modest revenue growth and a mixed profitability profile across its core business units. Total sales increased 4 % to ¥12.48 trn, largely driven by higher operating income in the Imaging & Sensing Solutions (I&SS) and Music segments. Operating income rose 13 % to ¥1.45 trn, while net income attributable to shareholders fell 3 % to ¥1.03 trn because of a larger equity‑method loss in the Financial Services arm and higher impairment charges. Operating cash flow remained flat at ¥1.97 trn, and the spin‑off of Sony Financial Group was treated as a discontinued operation from Q1 FY25 onward. Within the Music division, sales climbed 15 % to ¥277.5 billion, propelled by growth in Recorded Music and Music Publishing streaming revenues (+9 % and +14 % respectively), live‑event income, and a strong contribution from the Demon Slayer franchise. Operating income in this segment surged 25 % to ¥89.7 billion, reaching a record high even after excluding one‑time items. Sony projects flat sales for FY2026, with operating income expected to decline 11 % to ¥47 billion as streaming gains are offset by the loss of Demon Slayer’s impact. The company consolidates its Pictures and Music results on a U.S. dollar basis, translating foreign‑currency sales and costs using weighted average exchange rates while accounting for hedging transactions. Foreign‑exchange fluctuations affect both sales and operating income, with I&SS hedging gains or losses incorporated into these calculations. These disclosures supplement, but do not replace, Sony’s IFRS‑compliant consolidated financial statements.
Sony Group CorporationMay 2026


Report
The Essential UA Financing Guide: 2026
The guide outlines a non‑dilutive financing model designed to fund mobile studios’ user acquisition (UA) campaigns by leveraging cohort performance data. It argues that the global UA spend reached $78 billion in 2025, rising 13% year‑on‑year, and that studios typically allocate 50–70 % of revenue to paid UA while financing through equity. The proposed solution offers capital without equity dilution, with repayment tied directly to user revenue and a lock‑step mechanism that scales cash flow alongside UA spend. The repayment schedule follows the cohort’s return on ad spend (ROAS) curve, beginning when ROAS reaches 100 %. Eligibility criteria focus on predictability rather than speed of payback. Studios must demonstrate at least six months of clean ROAS curves, a history of trending toward transaction data, and an average monthly payback around $100 k attributable to predictable cohorts. The financing partner evaluates whether recent cohorts mirror historically profitable ones, using a benchmark tool that compares a studio’s cohort against over 5,000 mobile app cohorts. Key metrics include cohort margin of safety, tail risk, payer retention, volatility, and scalability. The methodology involves sharing cohort data from platforms such as Appsflyer, Adjust, GCP, or Snowflake. Underwriters then size a facility, allowing studios to draw up to 80 % of their monthly UA spend per cohort. Repayment proceeds once the ROAS curve reaches breakeven, with downside shared if cohorts underperform. The guide targets mobile studios worldwide operating in 2026, offering a structured pathway to unlock growth capital while preserving equity.
InvestGameApr 2026