Related Documents

Report
Tower Defense Games 2020 Industry Snapshot
The tower defense sub-genre within the mobile arcade category demonstrated significant monetization potential and engagement depth throughout 2020. Based on an analysis of over 134,000 integrated games and 900 million unique monthly players, the sector is characterized by high-value users and strong global performance. Key financial benchmarks reveal that tower defense titles achieve an average revenue per paying user (ARPPU) of $83, significantly outperforming related genres like board games and idlers. Furthermore, the sub-genre maintains an average revenue per daily active user (ARPDAU) of $1.66 and a daily conversion rate of 3.83%, indicating a highly effective monetization funnel compared to other casual arcade segments. Geographic performance varies by metric, with European and Asian markets showing the strongest engagement. Italy leads in Day 7 retention at 39%, while France records the highest average playtime at 210 minutes. China stands out as the most effective market for monetization, boasting a conversion rate of 8.7%, nearly double that of the United States at 4.6%. These figures suggest that while Western audiences engage deeply in terms of time, Asian markets provide superior direct financial returns. The success of the genre is attributed to its accessible core mechanics, which offer immediate satisfaction and high replayability. Developers benefit from a sustainable content model where minor adjustments to characters or obstacles can shift the entire meta-game without requiring extensive new map design. The integration of meta-features such as daily challenges, cooperative modes, and PvP elements further drives player stickiness. Notable market entrants in 2020, including Kingdom Wars Defense and Rush Royale, exemplify these trends by blending traditional defense mechanics with RPG and merge elements to capture high user ratings and market share.
GameAnalyticsJan 2021


Report
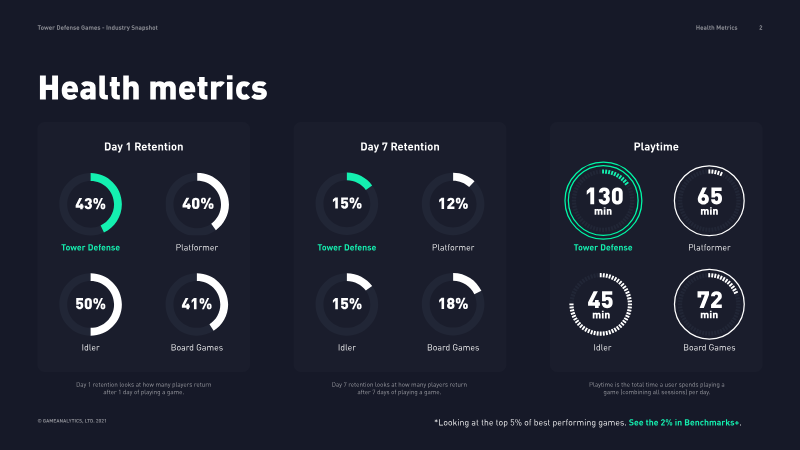
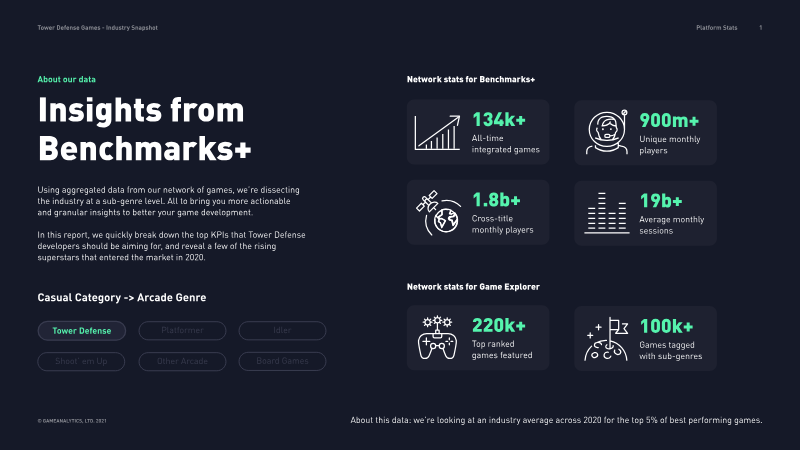
Tower Defense Games: Deconstructing the Superstars (2020 Industry Snapshot)
The tower defense sub-genre represents a high-performing segment within the casual arcade category, characterized by strong monetization potential and deep player engagement. Analysis of global mobile gaming data from 2020 reveals that tower defense titles significantly outperform related genres like platformers and idlers in key financial metrics. Specifically, the sub-genre boasts an Average Revenue Per Paying User (ARPPU) of $83 and an Average Revenue Per Daily Active User (ARPDAU) of $1.66. These figures are supported by a robust daily conversion rate of 3.83%, which is more than double that of board games. Geographic performance varies across different engagement and monetization KPIs. Italy leads in Day 7 retention at 39%, while France records the highest average daily playtime at 210 minutes. However, China emerges as the most effective market for monetization, achieving a conversion rate of 8.7%, nearly double that of the United States. These statistics are derived from a massive dataset encompassing over 134,000 integrated games and 900 million unique monthly players, providing a granular view of the competitive landscape. The success of the genre is attributed to its accessible core mechanics combined with high replayability. Developers leverage meta-features such as daily challenges, PvP options, and RPG elements to drive long-term retention. By introducing new characters or obstacles, studios can shift the game meta without the resource-heavy requirement of designing entirely new maps. Notable titles launched in 2020, such as Kingdom Wars Defense and Rush Royale, exemplify these trends by blending traditional defense mechanics with innovative strategy and merging elements to maintain high user ratings and market relevance.
GameAnalyticsJan 2020

Report
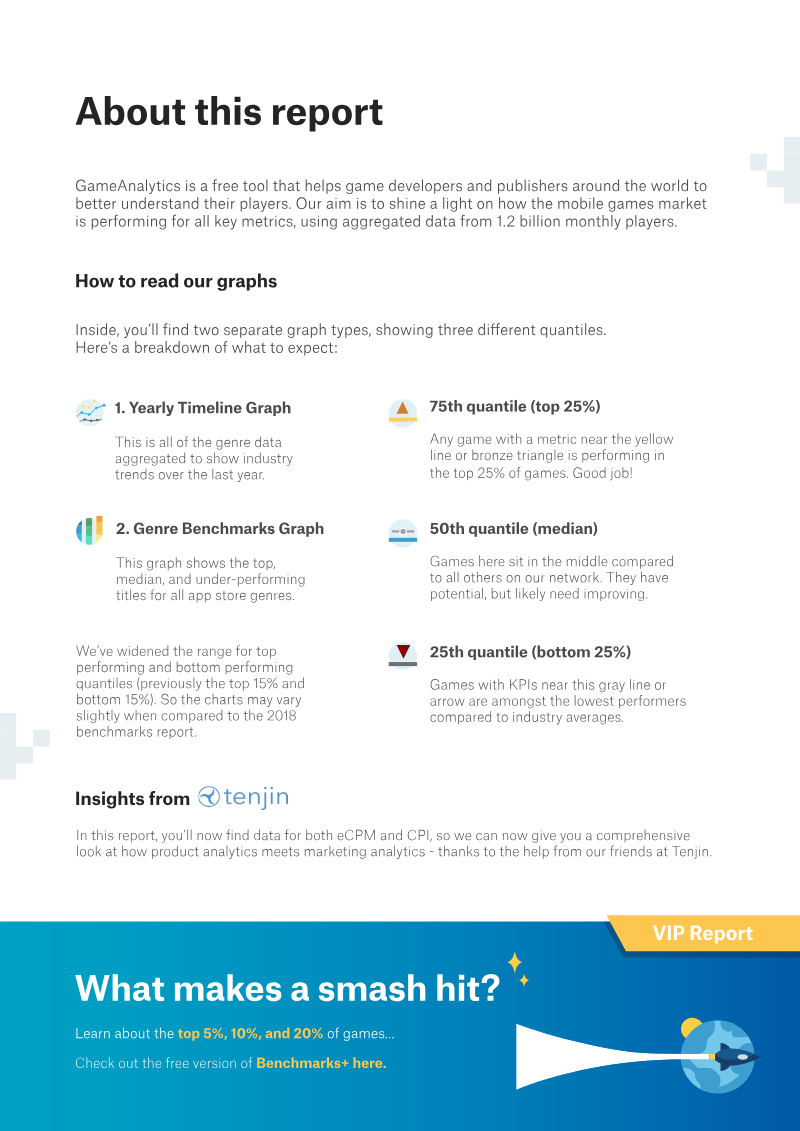
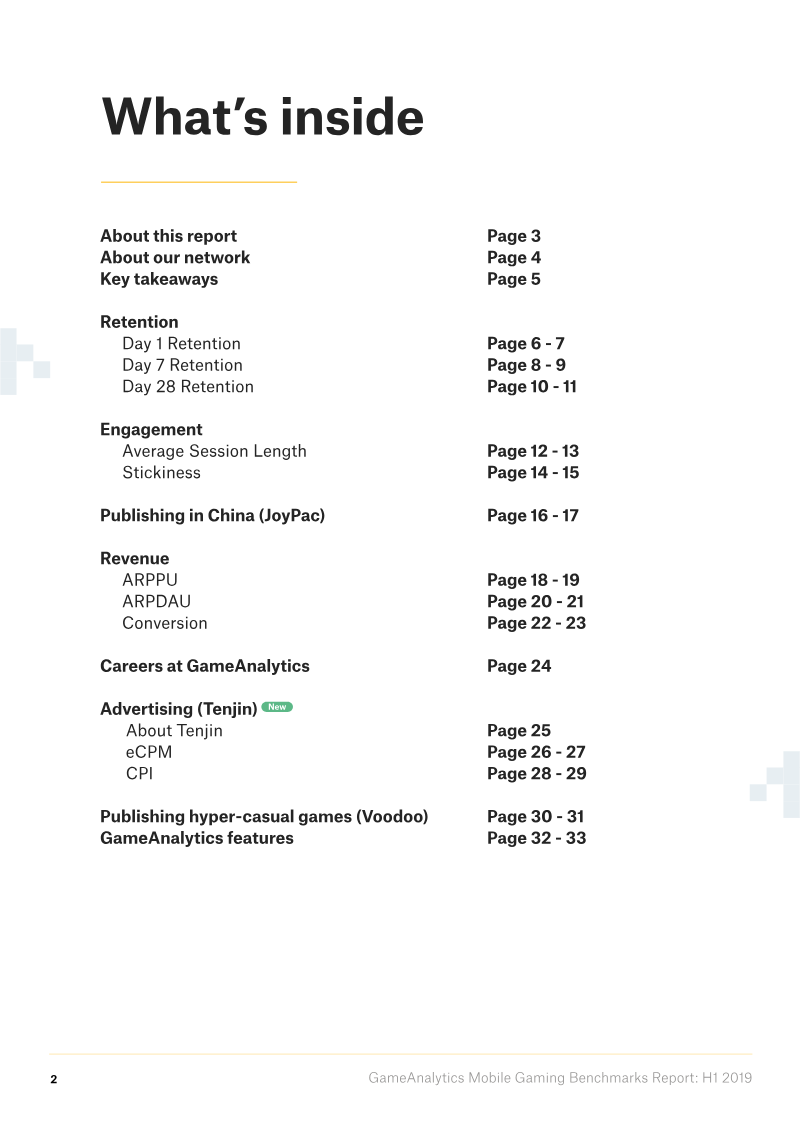
Mobile Benchmarks Report GameAnalytics
The mobile gaming landscape in the first half of 2019 reflects a significant structural shift as developers increasingly pivot from in-app purchases toward ad-based monetization models. Analysis of 100,000 titles and 1.2 billion monthly active users reveals a 15-20% year-over-year decline in Average Revenue Per Paying User (ARPPU) and Average Revenue Per Daily Active User (ARPDAU). While the median ARPDAU sits at $0.02, hyper-casual games maintain viability through advertising, supported by median eCPMs of approximately $5.00. Despite these shifts, Mid-core genres like Strategy and Role-Playing Games continue to dominate financial performance, yielding the highest conversion rates and revenue generation across the industry. Engagement metrics remain the primary indicator of long-term success, with top-performing titles aiming for a 35% Day 1 retention rate and a 4% Day 28 retention rate. Classic genres, specifically Card and Casino games, lead the market in player stickiness, boasting session lengths that can reach 22 minutes compared to the broader median of 4-5 minutes. Geographic trends further highlight the rising prominence of the Chinese market, where over 60% of the population engages in mobile gaming and median eCPMs have climbed to $3.90, nearly rivaling established Western markets like the United States. Industry leaders utilize these benchmarks to streamline publishing pipelines, often requiring a minimum 50% Day 1 retention rate to greenlight titles for further optimization. Success in this competitive environment relies on the integration of real-time data, remote configuration, and advanced player segmentation to manage game lifecycles. By monitoring key performance indicators and error logs through automated dashboards, publishers can identify high-potential titles early and refine gameplay mechanics to meet the rigorous standards of the current mobile ecosystem.
GameAnalyticsJan 2019

Report
Gaming Spotlight H1 2024
Mobile gaming solidifies its position as the leading segment of the global video‑game market, with revenue projected to reach $83 billion in 2024, reflecting a 6 percent year‑over‑year increase. In contrast, home‑console spending is expected to decline by 1 percent to $42 billion, while handheld revenues are slated to fall 2 percent to just under $2.5 billion. The upward trajectory of mobile is driven primarily by rapid expansion in emerging regions such as India and Indonesia, where user acquisition and spending are accelerating faster than in mature markets. Within mobile, fast‑growing sub‑genres—particularly simulators and multiplayer online battle arenas—accounted for $2.34 billion, representing 5.8 percent of total mobile revenue, and achieved a modest 0.4‑point rise in download share during the latest reporting period. In the United States, monetisation patterns among mobile players continue to favour rewarded‑video advertisements. These ads recorded the highest net‑sentiment score of +20 points and were the most frequently encountered format in the third quarter of 2023. Other ad formats, including playable, native, banner/display, and standard video, lagged behind both in visibility and user sentiment, indicating a clear preference hierarchy that shapes publisher revenue strategies. Overall, the data underscore a market increasingly centred on mobile platforms, propelled by growth in developing economies and reinforced by user‑friendly ad experiences. Console and handheld segments face modest contractions, suggesting that future investment and innovation will likely concentrate on mobile‑first titles, emerging‑region outreach, and optimisation of rewarded‑video ad ecosystems to sustain growth.
Sensor TowerJun 2024