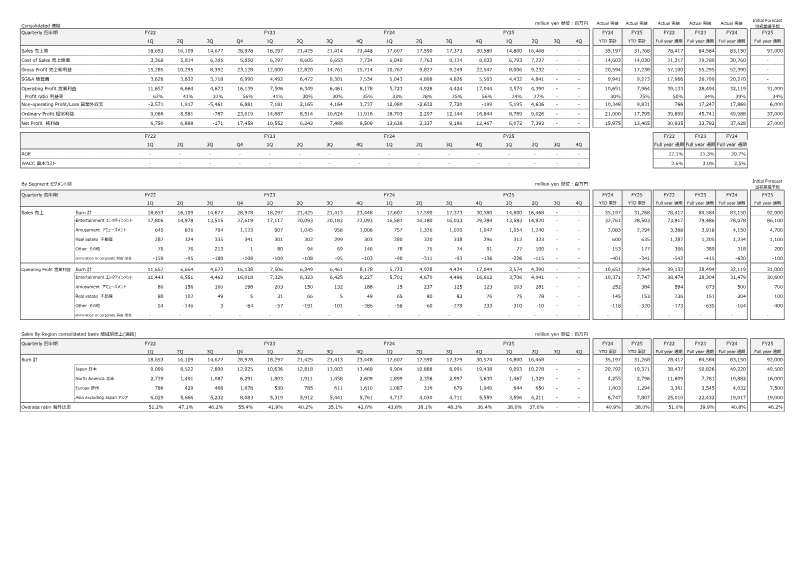
The entertainment segment is the primary revenue driver, consistently contributing over 90% of total sales and fueling a peak quarterly revenue of ¥28,978 million in FY25 Q4.
See it on page 2Gross profit margins have experienced significant compression, falling from 62% in FY22 Q1 to 30% by FY25 Q2 due to rising costs of sales.
See it on page 1The company has successfully pivoted to a digital-first model, with digital sales accounting for approximately 70% of revenue and online/mobile units representing 60–80% of total sales volume.
See it on page 2Financial performance showed a strong recovery in FY25 Q4 with ¥16,139 million in operating profit and ¥17,458 million in net profit, following a period of volatility that included a net loss in FY24 Q3.
See it on page 1Japan remains the core market at 49% of total sales, while the company maintains a global footprint with overseas revenue ratios fluctuating between 35% and 55%.
See it on page 1Capital expenditure more than doubled from ¥789 million in FY22 to ¥1,967 million in FY24, primarily directed toward real estate and equipment investments.
See it on page 2Corporate expansion is evidenced by headcount growth from 2,413 employees in FY22 Q1 to 2,873 by FY25 Q4.
See it on page 2The consolidated financial appendix presents quarterly and annual performance for FY22 through FY25, focusing on sales, cost of sales, gross profit, SG&A, operating profit, and net profit across entertainment, amusement, real‑estate, and other segments. Sales peaked in FY25 Q4 at ¥28,978 million, driven largely by the entertainment segment (¥27,619 million), while cost of sales rose proportionally, resulting in a gross profit margin decline from 62 % in FY22 Q1 to 30 % by FY25 Q2. Operating profit fluctuated, with a notable dip in FY24 Q3 (¥4,673 million) before rebounding to ¥16,139 million in FY25 Q4. Net profit followed a similar pattern, reaching ¥17,458 million in FY25 Q4 after a negative result in FY24 Q3. Segment analysis shows entertainment consistently dominates revenue, contributing over 90 % of total sales, with amusement and real‑estate providing modest but stable contributions. Geographic revenue distribution indicates Japan remains the largest market (≈49 % of total sales), followed by North America and Asia excluding Japan, with overseas ratios ranging from 35 % to 55 %. Headcount grew from 2,413 employees in FY22 Q1 to 2,873 by FY25 Q4, reflecting expansion. Capital expenditure totals ¥789 million in FY22 and increased to ¥1,967 million in FY24, with real‑estate and equipment investments comprising the bulk. Digital sales maintain a high digital ratio (≈70 %) and online/mobile units account for 60–80 % of total sales units, underscoring a strategic shift toward digital platforms. Overall, the data illustrate robust revenue growth driven by entertainment titles, moderate margin compression due to rising costs, and a strategic emphasis on digital distribution across multiple regions.