FinancialCyberAgent
FY2024 Third Quarter Consolidated Financial Results: Japan
10 pages~18 min full read
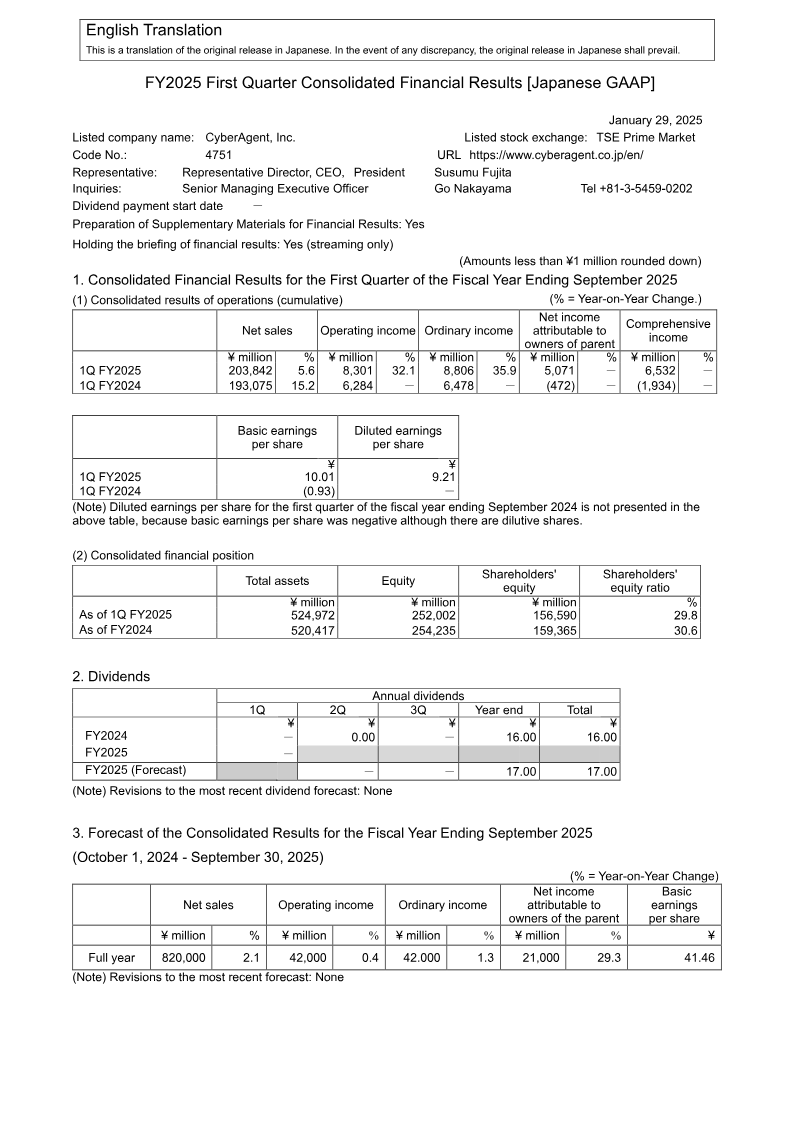
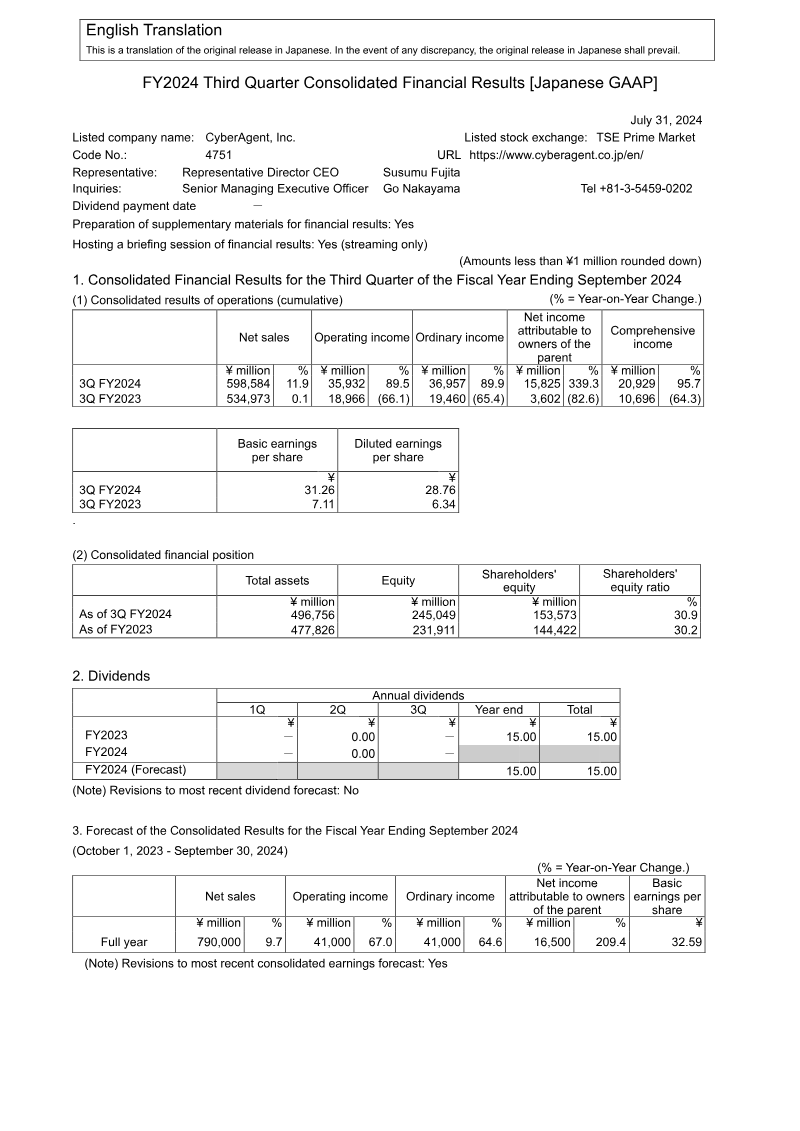
CyberAgent reported strong FY2024 Q3 growth with net sales rising 11.9% to ¥598,584 million and operating income surging 89.5% to ¥35,932 million.
See it on page 1Net income attributable to owners increased 339% year-on-year to ¥15,825 million, with diluted earnings per share rising from ¥6.34 to ¥28.76.
See it on page 6The Game Business and Internet Advertisement segments were primary growth drivers, contributing ¥151,070 million and ¥324,839 million in sales respectively.
See it on page 4CyberAgent revised its FY2024 earnings forecast upward, now projecting ¥41,000 million in operating income.
See it on page 1The Media Business, anchored by ABEMA, significantly narrowed its operating loss to ¥489 million on sales of ¥125,885 million.
See it on page 4CyberAgent announced the acquisition of content-creation firm Nitroplus Co., Ltd. to bolster its intellectual property and media mix capabilities.
See it on page 9CyberAgent, Inc. reported a strong third‑quarter performance for FY2024, with net sales rising 11.9% year‑on‑year to ¥598 584 million and operating income increasing 89.5% to ¥35 932 million. Ordinary income attributable to owners surged 339.3% to ¥15 825 million, driven by record growth in the Internet Advertisement and Game segments. Net income attributable to owners rose 339% from ¥3 602 million in the same period of FY2023 to ¥15 825 million, while diluted earnings per share climbed from ¥6.34 to ¥28.76.
Segment analysis shows the Media Business, anchored by ABEMA, generated ¥125 885 million in sales with a reduced operating loss of ¥489 million. The Internet Advertisement segment achieved ¥324 839 million in sales, operating income of ¥17 553 million. The Game Business contributed ¥151 070 million in sales and ¥26 844 million in operating income. Investment Development and Other segments posted modest sales but contributed to overall profitability.
Total assets increased to ¥496 756 million, driven mainly by cash and deposits, while total liabilities rose modestly to ¥251 706 million. Equity stood at ¥245 049 million, with an equity ratio of 30.9%. The company maintained a stable share count of approximately 506 million shares outstanding.
CyberAgent revised its FY2024 earnings forecast upward, projecting net income of ¥790 000 million and operating income of ¥41 000 million. The company also announced the acquisition of Nitroplus Co., Ltd., a content‑creation firm, to enhance its IP and media mix capabilities. The acquisition is expected to strengthen CyberAgent’s position in global entertainment markets, aligning with its strategy of integrating technology and creativity across digital platforms.