FinancialCyberAgent
FY2024 Consolidated Financial Results: Japan
18 pages~31 min full read
Key insights
4 takeaways · ~2 min read- 01
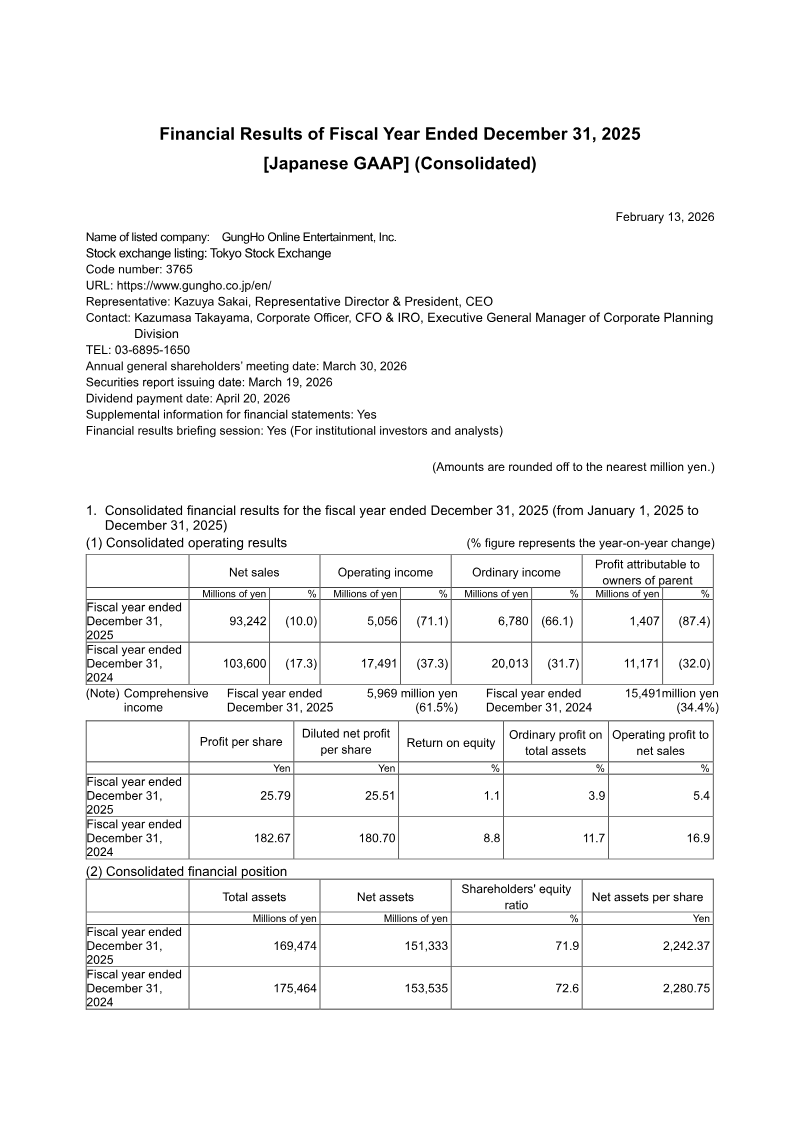
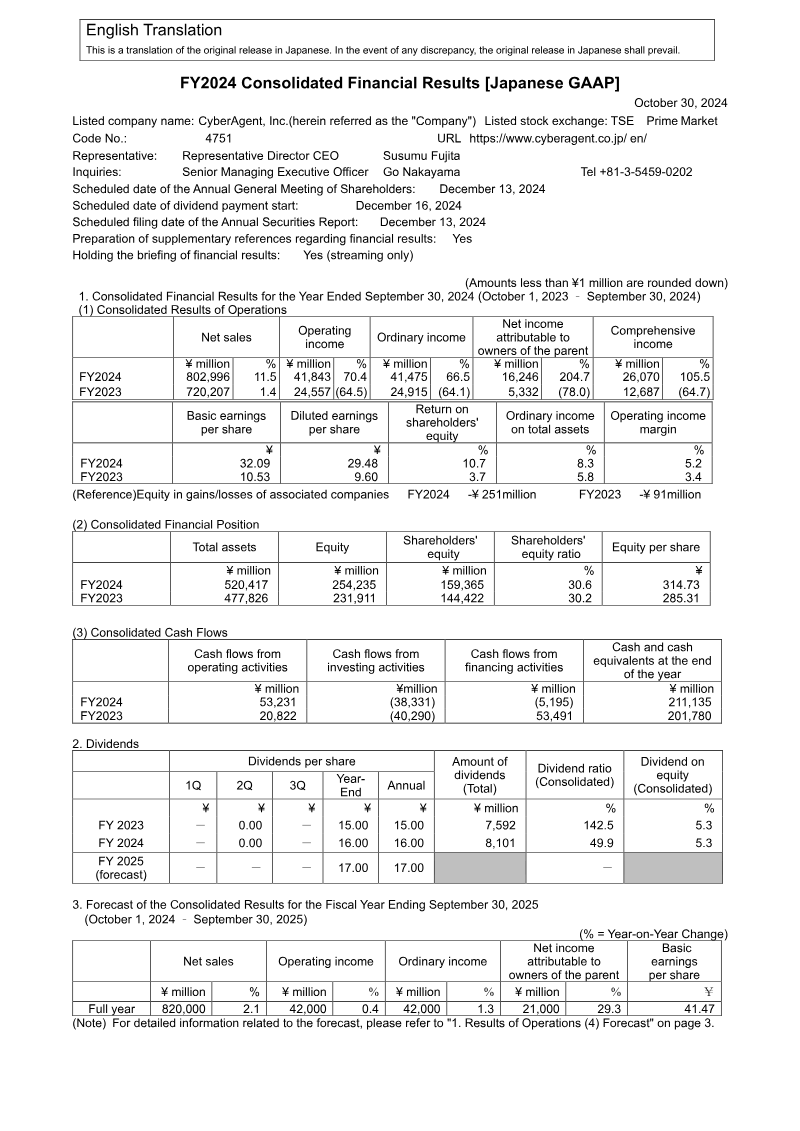
CyberAgent, Inc. (TSE: 4751) released its FY2024 consolidated financial results prepared under Japanese GAAP.
See it on page 1 - 02
The report identifies Susumu Fujita as the Representative Director and CEO of the company.
See it on page 1 - 03
Go Nakaya serves as the Senior Managing Executive Officer responsible for investor inquiries.
See it on page 1 - 04
The company is publicly traded on the Tokyo Stock Exchange Prime Market.
See it on page 5