FinancialKoei Tecmo
Consolidated Financial Results: Year Ended March 31, 2025
10 pages~14 min full read
Key insights
6 takeaways · ~2 min read- 01
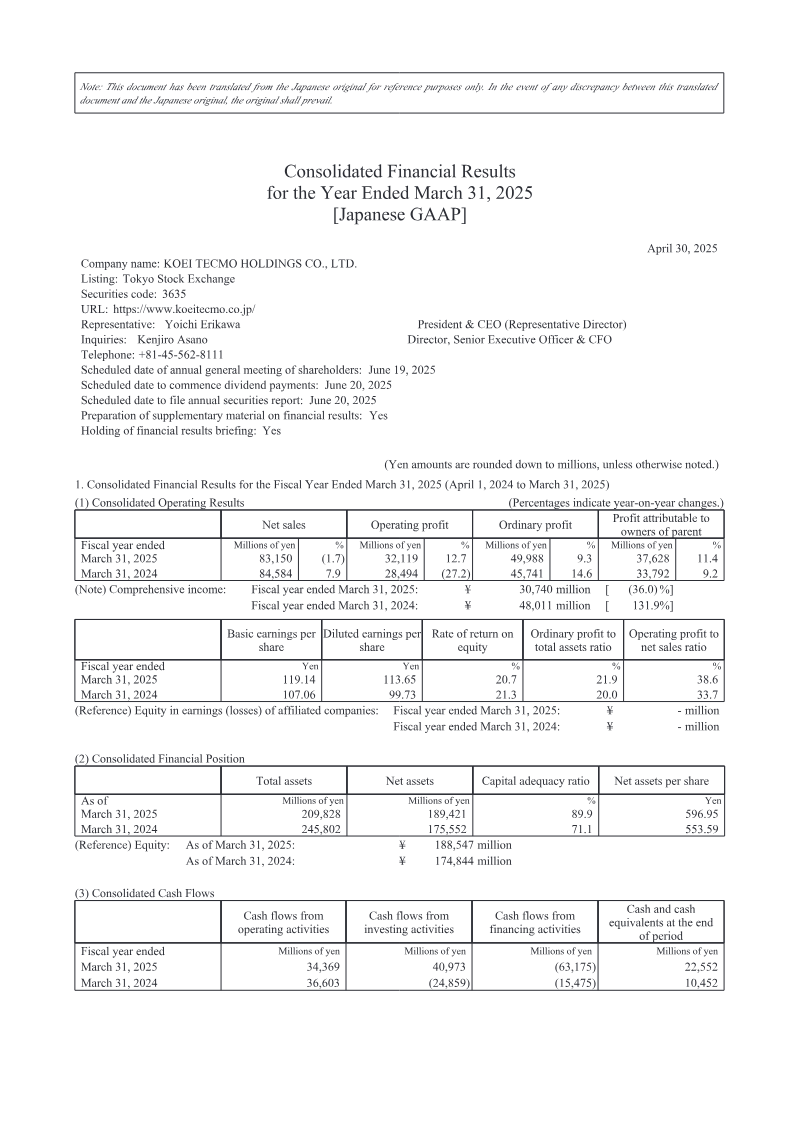
Koei Tecmo Holdings reported a 12.7% increase in operating profit to ¥32,119 million and an 11.4% rise in net profit to ¥37,628 million for the fiscal year ended March 31, 2025, despite a 1.7% decline in net sales to ¥83,150 million.
See it on page 1 - 02
The company’s capital adequacy ratio improved significantly from 71.1% to 89.9% as total assets contracted to ¥209,828 million, largely due to a reduction in investment securities.
See it on page 1 - 03
Investing activities shifted to a net inflow of ¥40,973 million, primarily driven by proceeds from the sale of securities, while financing cash flow saw a net outflow of ¥63,175 million due to dividend payments and bond redemptions.
See it on page 10 - 04
Management forecasts a decline in profitability for the 2026 fiscal year, projecting a 3.5% drop in operating profit to ¥31,000 million and a 26.0% decrease in ordinary profit to ¥37,000 million.
See it on page 2 - 05
Comprehensive income fell sharply by 36.0% to ¥30,740 million, reflecting a significant decline in other comprehensive items compared to the previous fiscal year.
See it on page 7 - 06
The company maintains a consistent dividend policy with a payout ratio of 50.4% and has integrated Koei Tecmo Corporate Finance Co., Ltd. into its consolidated financial reporting.
See it on page 2