FinancialCyberAgent
FY2023 Third Quarter Consolidated Financial Results: Japan
8 pages~13 min full read
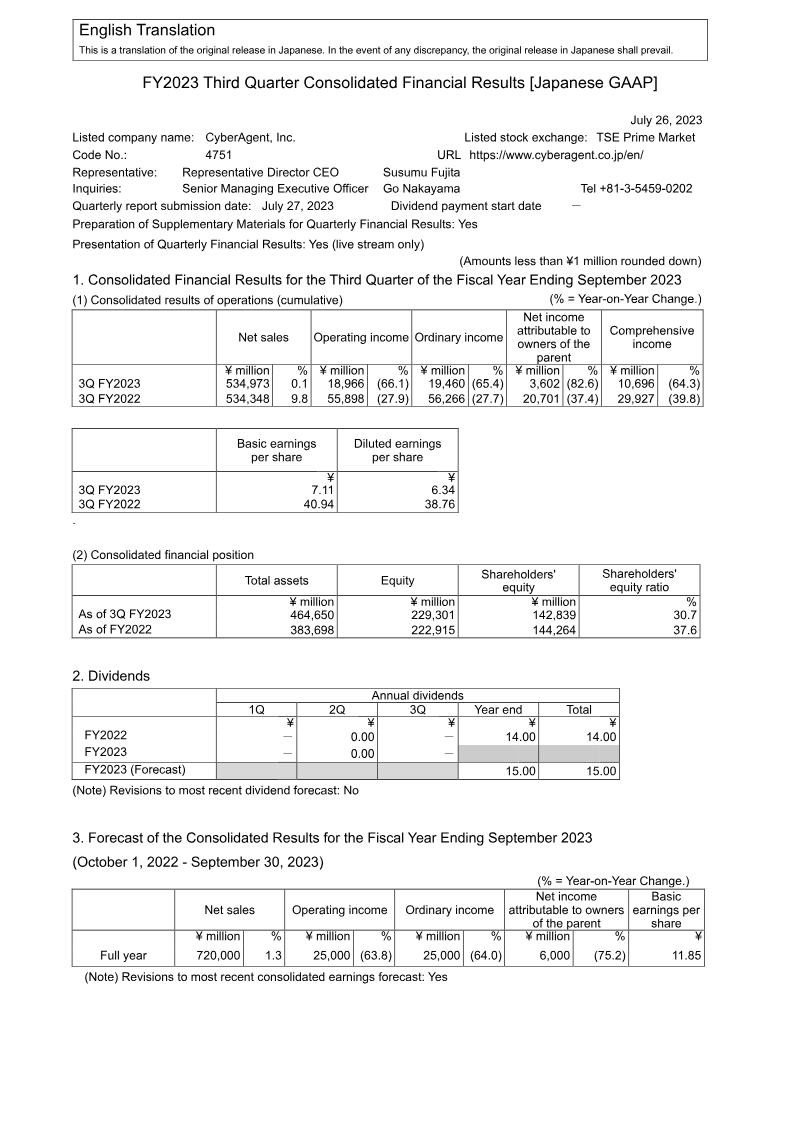
CyberAgent’s net income attributable to the parent plummeted 82.6% year-over-year to ¥3,602 million for the third quarter of FY2023.
See it on page 1Operating income fell sharply by 66.1% to ¥18,966 million, despite net sales remaining nearly flat with a marginal 0.1% increase to ¥534,973 million.
See it on page 4The game development segment experienced a significant downturn, with revenue dropping 21.2% to ¥136,808 million and operating income declining by 58.2%.
See it on page 4The media segment, encompassing ABEMA and WINTICKET, recorded an operating loss of ¥11,461 million on ¥100,336 million in sales.
See it on page 4Internet advertising achieved record sales of ¥301,323 million, yet the segment's operating income still contracted by 28.8%.
See it on page 8The company's financial position shifted as the equity ratio declined from 37.6% to 30.7%, driven by a ¥74,566 million increase in liabilities from bond issuance and bank loans.
See it on page 4Management has revised the FY2023 earnings forecast downward, citing ongoing investment requirements and macroeconomic headwinds.
See it on page 1CyberAgent, Inc. reported FY2023 third‑quarter consolidated results under Japanese GAAP for the period ending June 30 2023. Net sales rose marginally by 0.1 % to ¥534,973 million, yet operating income fell sharply by 66.1 % to ¥18,966 million, and ordinary income dropped 65.4 % to ¥19,460 million. Net income attributable to the parent contracted 82.6 % to ¥3,602 million from ¥20,701 million in the same quarter of FY2022. Basic earnings per share declined from ¥40.94 to ¥7.11, with diluted EPS falling from ¥38.76 to ¥6.34.
Total assets increased by ¥80,952 million to ¥464,650 million, driven mainly by convertible bond issuance and long‑term bank loans. Equity rose modestly to ¥229,301 million, while liabilities grew by ¥74,566 million. The equity ratio declined from 37.6 % to 30.7 %. Dividend policy remained unchanged, with no interim dividend announced for FY2023 and a forecast of ¥15 million per share for the year.
Segment analysis shows media (ABEMA, WINTICKET, Ameba) generated ¥100,336 million in sales but recorded an operating loss of ¥11,461 million. Internet advertising achieved a record ¥301,323 million in sales but saw operating income shrink 28.8 %. Game development revenue fell 21.2 % to ¥136,808 million with a 58.2 % decline in operating income. Investment development and other businesses posted modest sales increases but limited profitability.
The company revised its FY2023 earnings forecast, reflecting expectations of continued investment in media and advertising while acknowledging the impact of macro‑economic headwinds on operating performance.