ReportKoei Tecmo
Financial Highlights: 1st Quarter of Fiscal Year Ending March 2022
2 pages~3 min full read
Key insights
7 takeaways · ~3 min read- 01
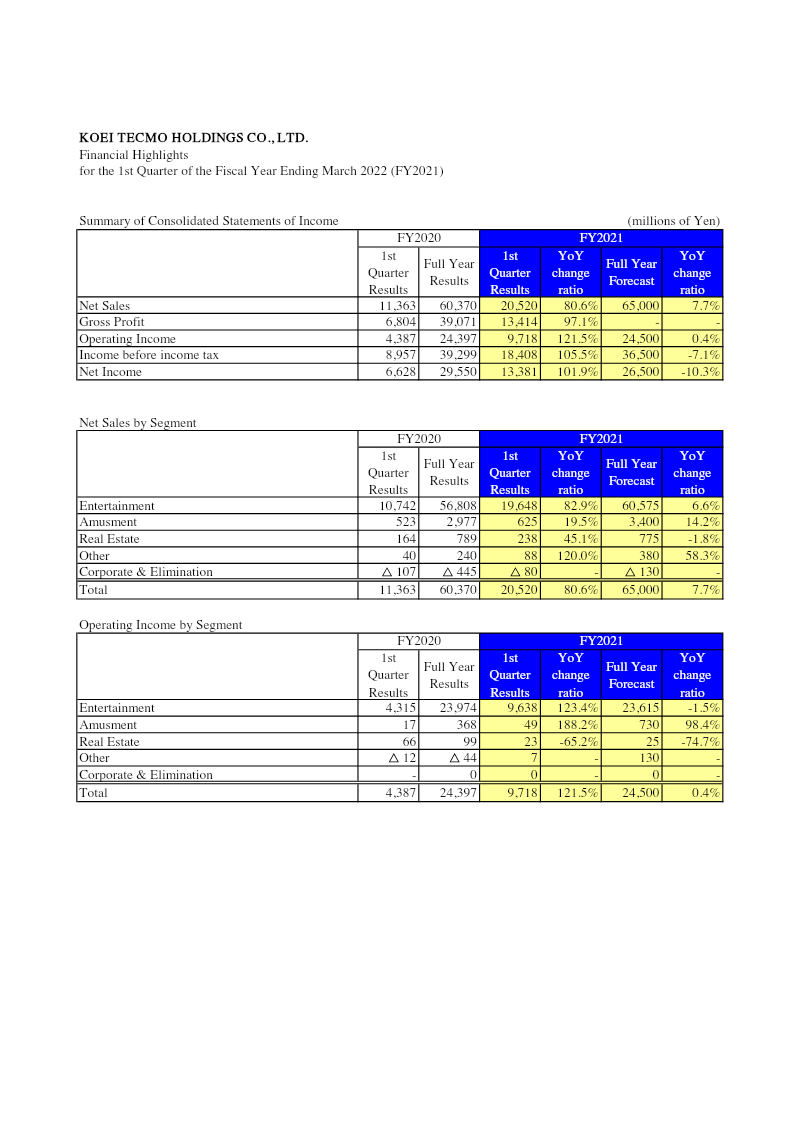
The company experienced significant Q1 growth for the fiscal year ending March 2022, with net sales rising 80.6% to ¥60,370 million and net income increasing 101.9% to ¥29,550 million.
See it on page 1 - 02
Entertainment remains the primary revenue driver, accounting for ¥56,808 million in net sales and achieving 82.9% year-over-year growth.
See it on page 1 - 03
Operating income saw a substantial surge of 121.5% to ¥24,397 million, largely fueled by a 123.4% increase in the entertainment segment and a 188.2% increase in the amusement segment.
See it on page 1 - 04
Full-year forecasts project a conservative 7.7% increase in net sales to ¥65,000 million and a 10.3% decline in net income to ¥26,500 million.
See it on page 1 - 05
Real-estate performance was mixed, showing a 45.1% increase in revenue but a 65.2% decline in operating income.
See it on page 1 - 06
As of June 30, 2021, the company maintained a solid asset base of ¥190,842 million, supported by an increase in current assets to ¥42,361 million.
See it on page 2 - 07
Current liabilities rose to ¥23,446 million, primarily due to the addition of a ¥9,500 million short-term loan payable.
See it on page 2


